![Gann Fan and Fibonacci Indicator for MT4 – Free Download [TradingFinder]](https://cdn.tradingfinder.com/image/504048/2-124-en-gann-fan-and-fibonacci-mt4-1.webp)
![Gann Fan and Fibonacci Indicator for MT4 – Free Download [TradingFinder] 0](https://cdn.tradingfinder.com/image/504048/2-124-en-gann-fan-and-fibonacci-mt4-1.webp)
![Gann Fan and Fibonacci Indicator for MT4 – Free Download [TradingFinder] 1](https://cdn.tradingfinder.com/image/504042/2-124-en-gann-fan-and-fibonacci-mt4-2.webp)
![Gann Fan and Fibonacci Indicator for MT4 – Free Download [TradingFinder] 2](https://cdn.tradingfinder.com/image/504043/2-124-en-gann-fan-and-fibonacci-mt4-3.webp)
![Gann Fan and Fibonacci Indicator for MT4 – Free Download [TradingFinder] 3](https://cdn.tradingfinder.com/image/504041/2-124-en-gann-fan-and-fibonacci-mt4-4.webp)
The Gann Fan and Fibonacci indicator is one of the advanced hybrid tools in technical analysis. By combining the classical analytical style of Gann angle theory with Fibonacci retracement levels, it enables precise identification of key price and time-sensitive zones in financial markets such as Forex and cryptocurrency.
Instead of relying solely on price data, this indicator evaluates the dynamic relationship between time and price through the geometric Gann angles and important Fibonacci ratios.
Gann Fan and Fibonacci Indicator Table
Table below presents the general features of the Gann Fan and Fibonacci indicator:
Indicator Categories: | Trading Assist MT4 Indicators Levels MT4 Indicators |
Platforms: | MetaTrader 4 Indicators |
Trading Skills: | Intermediate |
Indicator Types: | Reversal MT4 Indicators |
Timeframe: | Multi-Timeframe MT4 Indicators |
Trading Style: | Intraday MT4 Indicators |
Trading Instruments: | Share Stocks MT4 Indicators Indices Market MT4 Indicators Commodity Market MT4 Indicators Cryptocurrency MT4 Indicators Forex MT4 Indicators |
Gann Fan and Fibonacci at a Glance
In the MT4 platform, the Gann Fan and Fibonacci indicator identifies key support and resistance Level, and price reversal areas by combining Gann angles with Fibonacci retracement levels.
Gann angles represent the relationship between price and time and are drawn as diagonal lines.
Fibonacci levels are horizontal lines showing potential retracement or continuation points.
By overlapping these two factors, the probability of price reaction in that area increases, providing optimal entry and exit points.
Indicator in an Uptrend
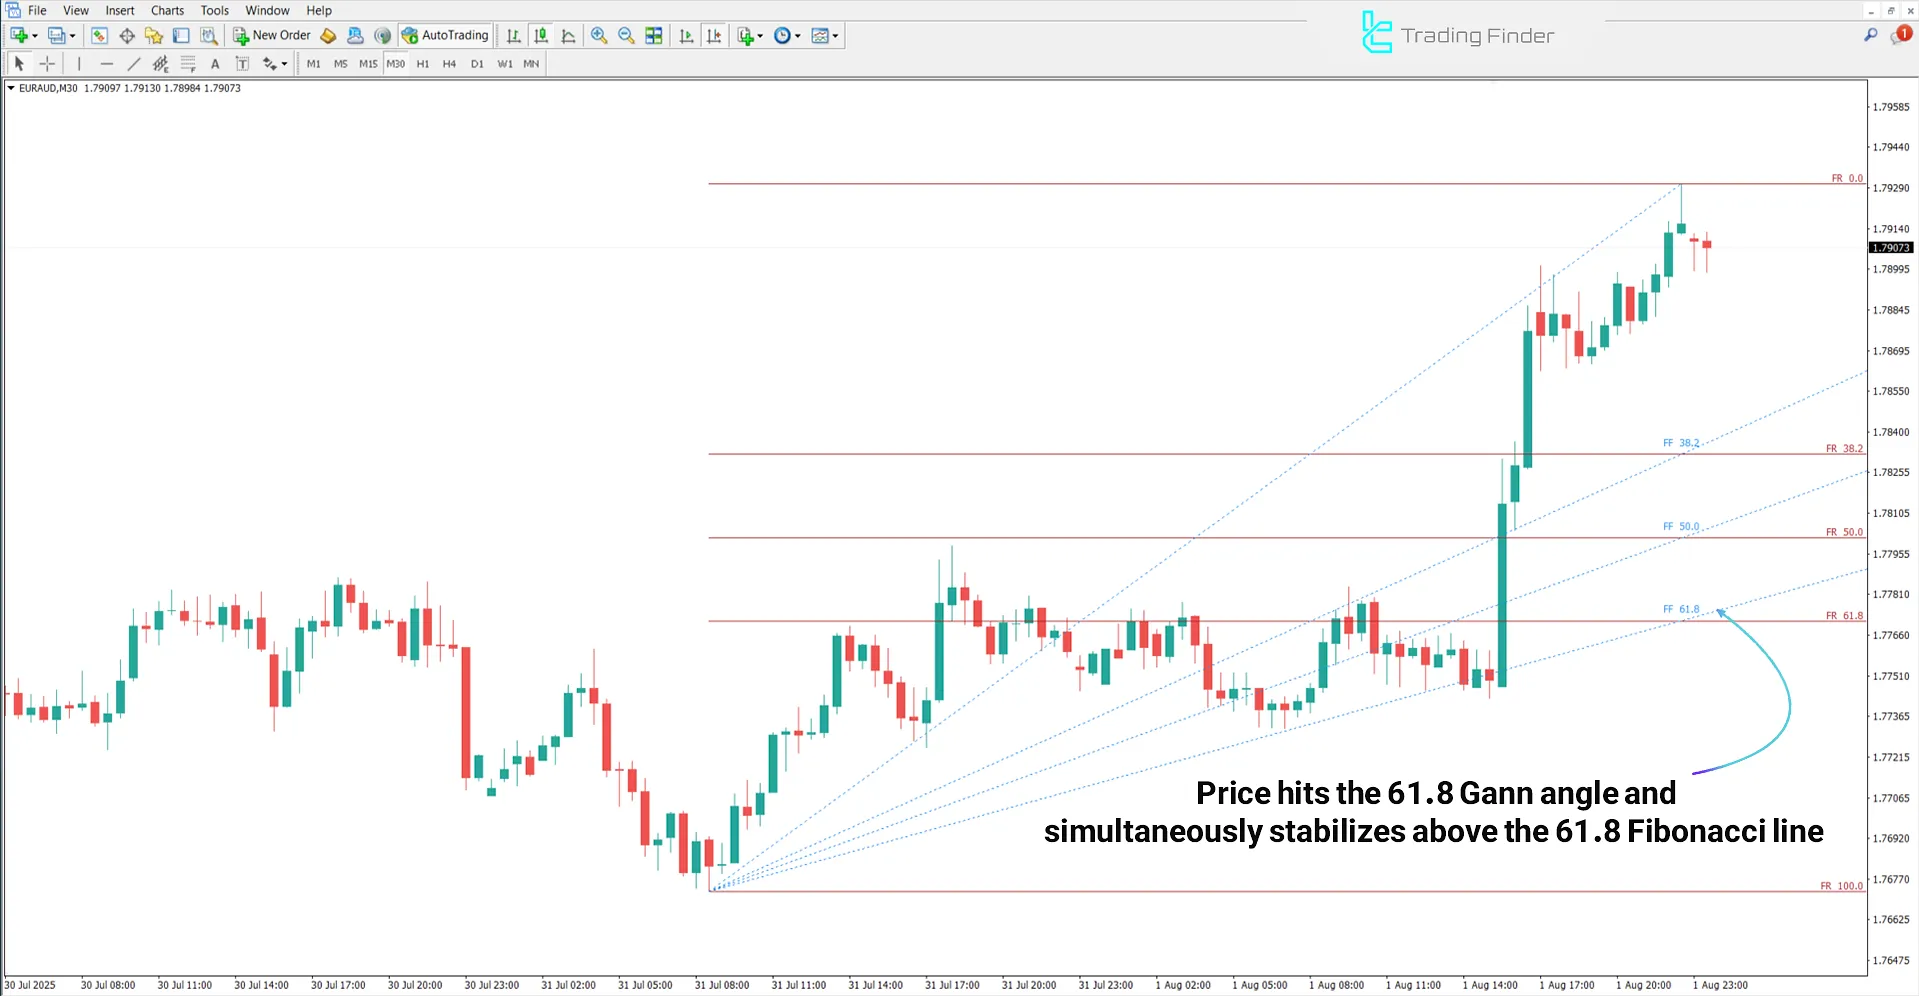
The chart below shows the EUR/AUD currency pair on the 30-minute timeframe.
In an uptrend, a buy signal occurs when the price hits one of the Gann support angles and simultaneously aligns with a Fibonacci retracement level such as 61.8%.
If the price reacts upwards in this zone, it can be considered a valid buy entry signal.

Indicator in a Downtrend
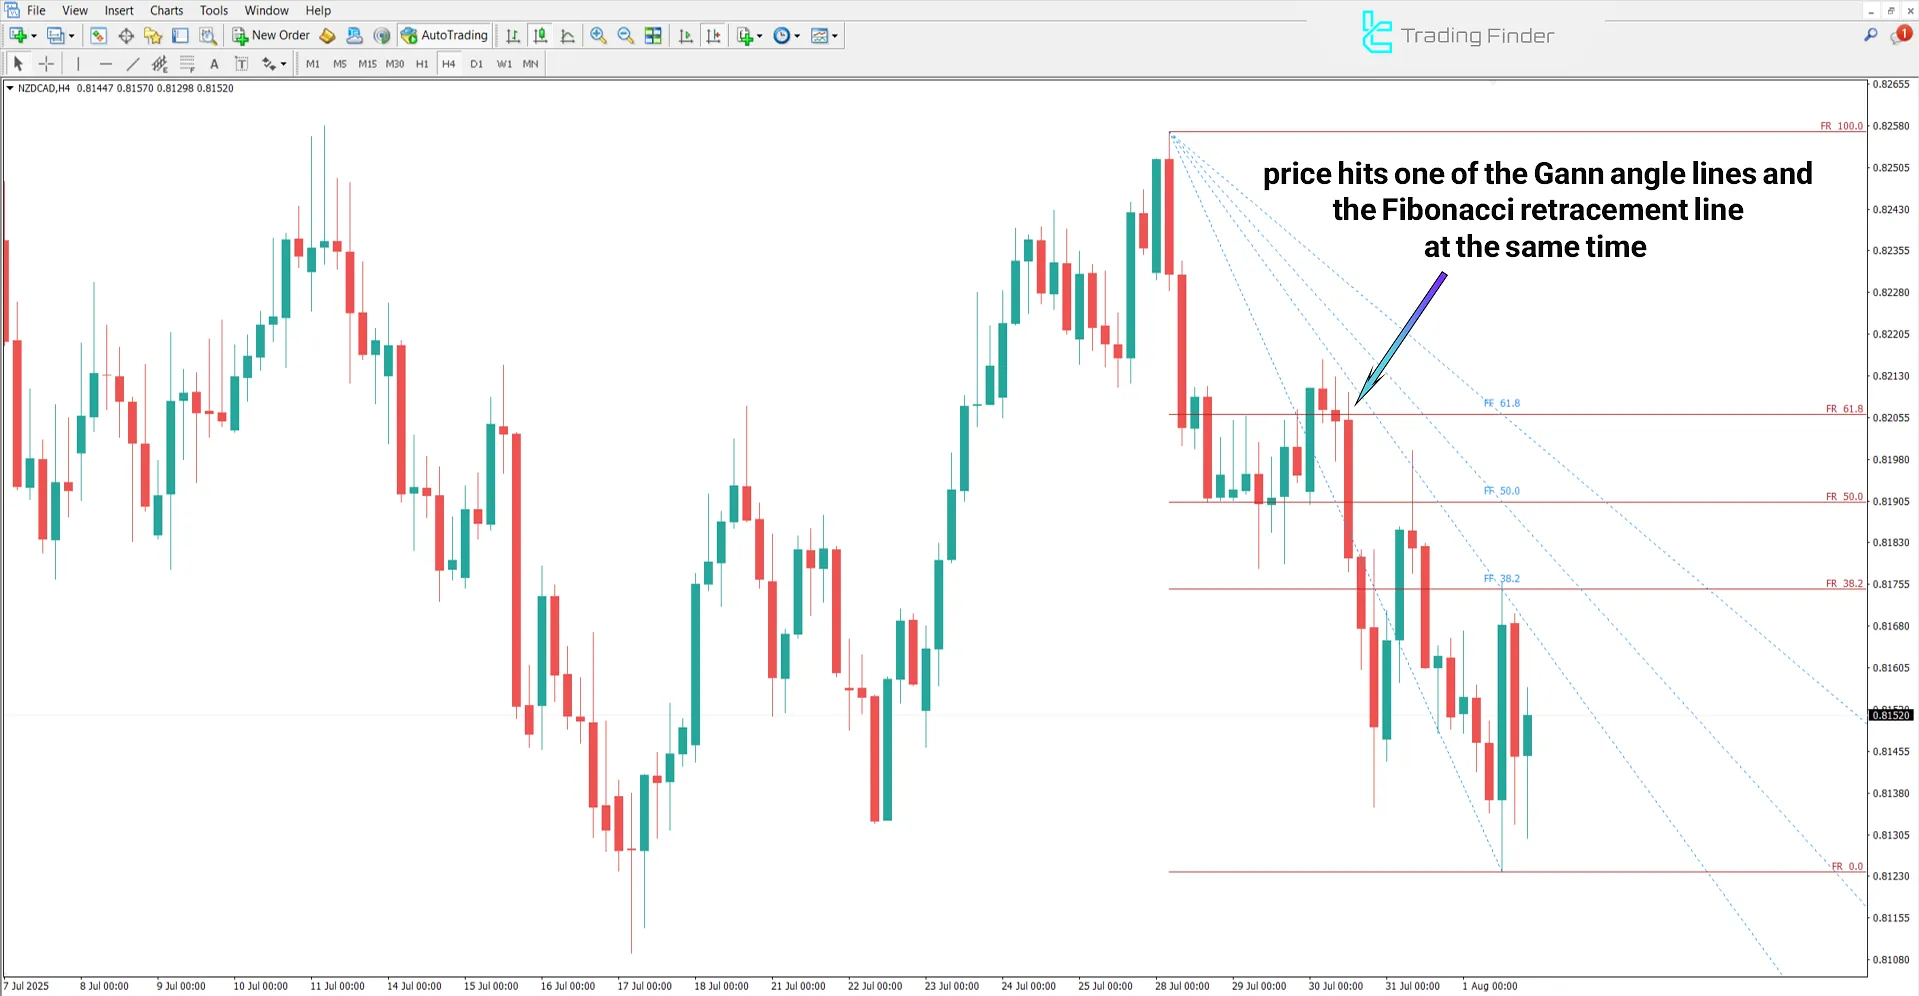
The following chart shows the NZD/CAD currency pair on the 4-hour timeframe.
In a downtrend, a sell signal is generated when the price touches one of the Gann resistance angles and overlaps with a Fibonacci retracement level.
If the price stalls in this area and signs of weakening buyers appear, it can be considered a suitable zone for entering a sell position.

Gann Fan and Fibonacci Indicator Settings
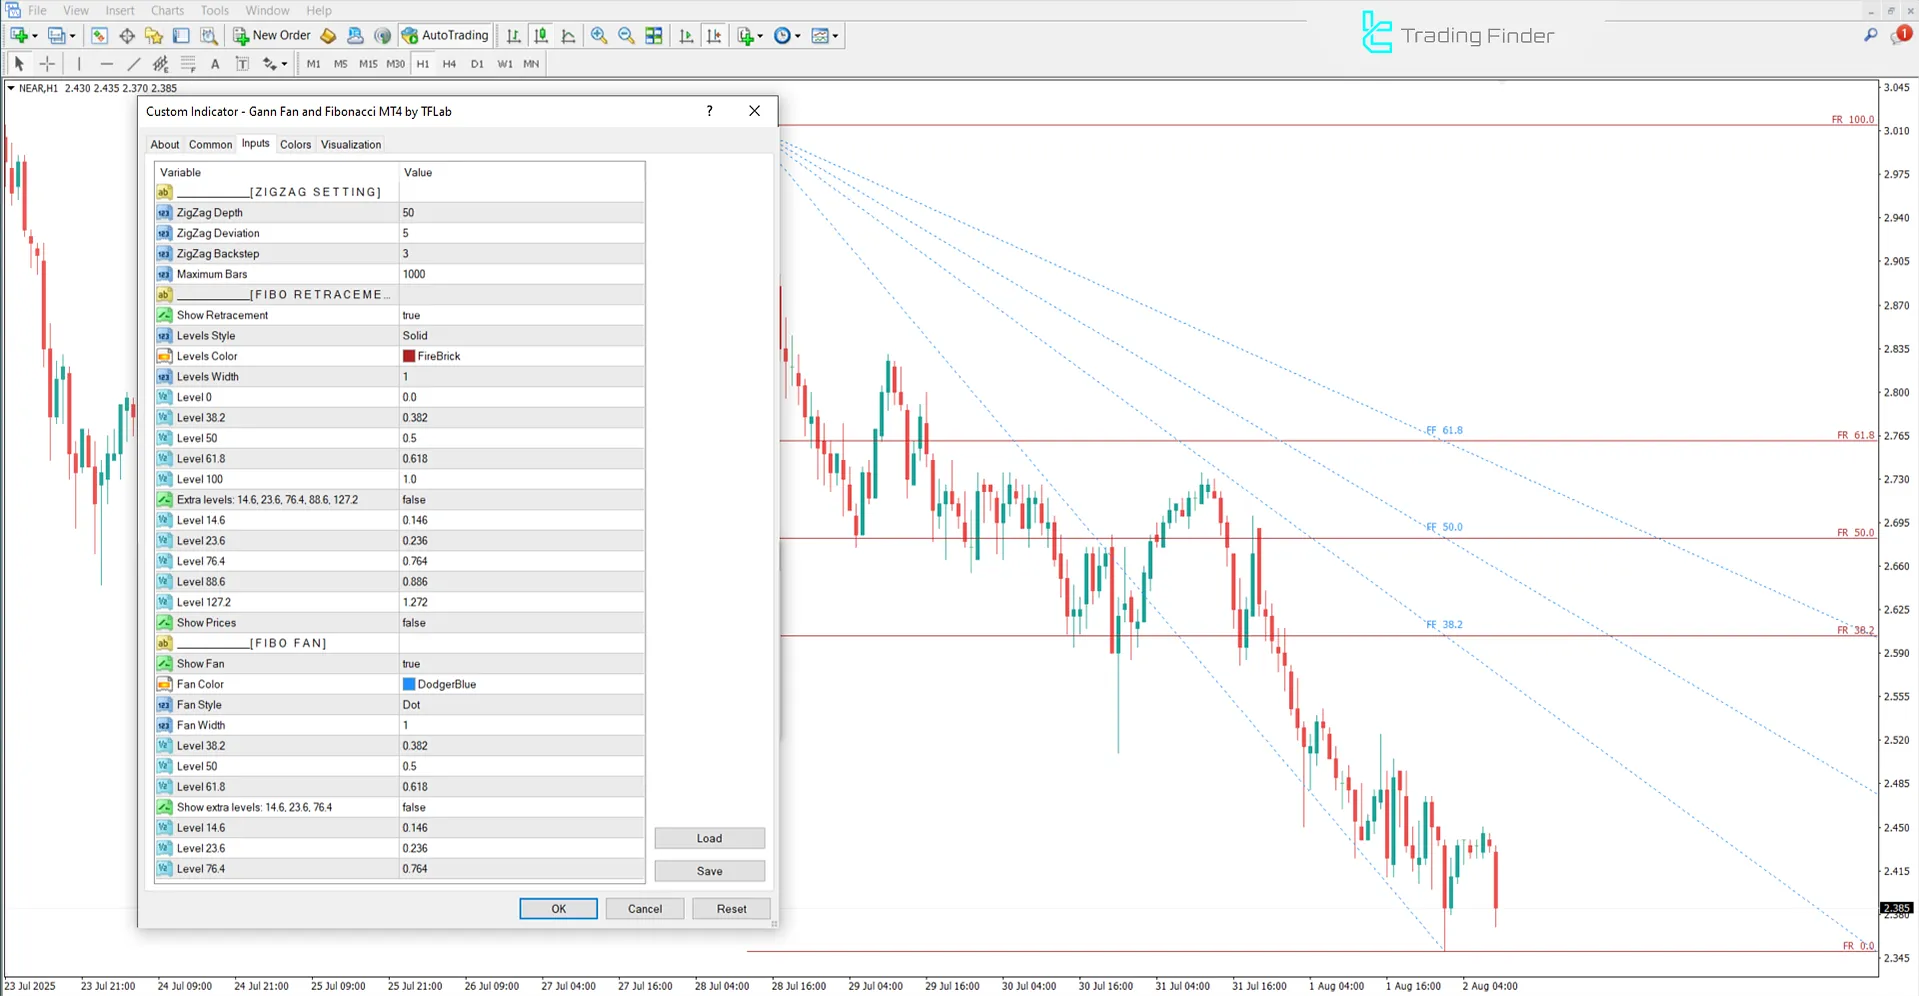
Image below shows the settings of the Gann Fan and Fibonacci indicators in the MetaTrader 4 platform:

ZIGZAG SETTING
- ZigZag Depth: Zigzag depth
- ZigZag Deviation: Zigzag deviation
- ZigZag Backstep: Zigzag backstep
- Maximum Bars: Maximum number of candles to analyze
FIBO RETRACEMENT
- Show Retracement: Show Fibonacci retracement levels
- Levels Style: Line style
- Levels Color: Fibonacci level line color
- Levels Width: Fibonacci line thickness
- Level 0: 0% level
- Level 38.2: 38.2% retracement
- Level 50: 50% retracement
- Level 61.8: 61.8% retracement
- Level 100: 100% level
- Extra Levels: 14.6%, 23.6%, 76.4%, 88.6%, 127.2%
- Level 14.6: 14.6% retracement
- Level 23.6: 23.6% retracement
- Level 76.4: 76.4% retracement
- Level 88.6: 88.6% retracement
- Level 127.2: 127.2% extension
- Show Prices: Display price values on the levels
FIBO FAN
- Show Fan: Display Fibonacci fan lines
- Fan Color: Fan line color
- Fan Style: Fan line style
- Fan Width: Fan line thickness
- Level 38.2: 38.2% fan angle
- Level 50: 50% fan angle
- Level 61.8: 61.8% fan angle
- Show Extra Levels: 14.6%, 23.6%, 76.4%
- Level 14.6: 14.6% fan angle
- Level 23.6: 23.6% fan angle
- Level 76.4: 76.4% fan angle
Conclusion
The Gann Fan and Fibonacci indicator combines two classical analytical methods Gann angles and Fibonacci retracement levels into a powerful tool for identifying key support, resistance, and price reversal areas.
By creating an overlap between time and price, it pinpoints areas with a high probability of market reaction.
Gann Fan and Fibonacci Indicator for MT4 PDF
Gann Fan and Fibonacci Indicator for MT4 PDF
Click to download Gann Fan and Fibonacci Indicator for MT4 PDFCan the Gann Fan and Fibonacci indicator be combined with other tools?
Yes, combining this indicator with tools such as RSI, price action, and candlestick patterns can confirm signals and improve decision-making accuracy.
Is the Gann Fan and Fibonacci indicator suitable for ranging markets?
This trading tool performs better in trending markets, but it can also identify retracement areas in ranging conditions.


