![Gann Square Indicator for MetaTrader 4 – Free Download [TradingFinder]](https://cdn.tradingfinder.com/image/507836/2-126-en-gann-square-mt4-1.webp)
![Gann Square Indicator for MetaTrader 4 – Free Download [TradingFinder] 0](https://cdn.tradingfinder.com/image/507836/2-126-en-gann-square-mt4-1.webp)
![Gann Square Indicator for MetaTrader 4 – Free Download [TradingFinder] 1](https://cdn.tradingfinder.com/image/507839/2-126-en-gann-square-mt4-2.webp)
![Gann Square Indicator for MetaTrader 4 – Free Download [TradingFinder] 2](https://cdn.tradingfinder.com/image/507838/2-126-en-gann-square-mt4-3.webp)
![Gann Square Indicator for MetaTrader 4 – Free Download [TradingFinder] 3](https://cdn.tradingfinder.com/image/507841/2-126-en-gann-square-mt4-4.webp)
The Gann Square Indicator is a technical analysis tool based on the theories of W.D. Gann. Leveraging the symmetry between price and time helps identify market turning points, support and resistance levels, and trend structures.
This indicator consists of several geometric and time-based components (Gann Angles, Gann Square, Gann Fan, and Time Arcs), each playing a specific role in market analysis.
Gann Square Indicator Table
The general features of the Gann Square indicator are presented in the table below.
Indicator Categories: | Signal & Forecast MT4 Indicators Trading Assist MT4 Indicators Levels MT4 Indicators Gann Indicators for MetaTrader 4 |
Platforms: | MetaTrader 4 Indicators |
Trading Skills: | Elementary |
Indicator Types: | Breakout MT4 Indicators Reversal MT4 Indicators |
Timeframe: | Multi-Timeframe MT4 Indicators |
Trading Style: | Intraday MT4 Indicators |
Trading Instruments: | Stock Market MT4 Indicators Cryptocurrency MT4 Indicators Forex MT4 Indicators |
Gann Square Indicator Overview
The Gann Square Indicator is an analytical tool based on the combination of price movements and time cycles, designed to detect key entry and exit points in the market. Its functional structure is built on three main pillars:
- Symmetry of Time and Price When time and price balance at the same level, the probability of trend reversal increases;
- Angles and Diagonal Lines Analysis Breaking or touching significant Gann angles indicates either trend strength or a potential change of direction;
- Price Time Confluence Intersections of fan lines, horizontal price levels, and vertical time lines often result in strong market reactions.
Indicator in an Uptrend
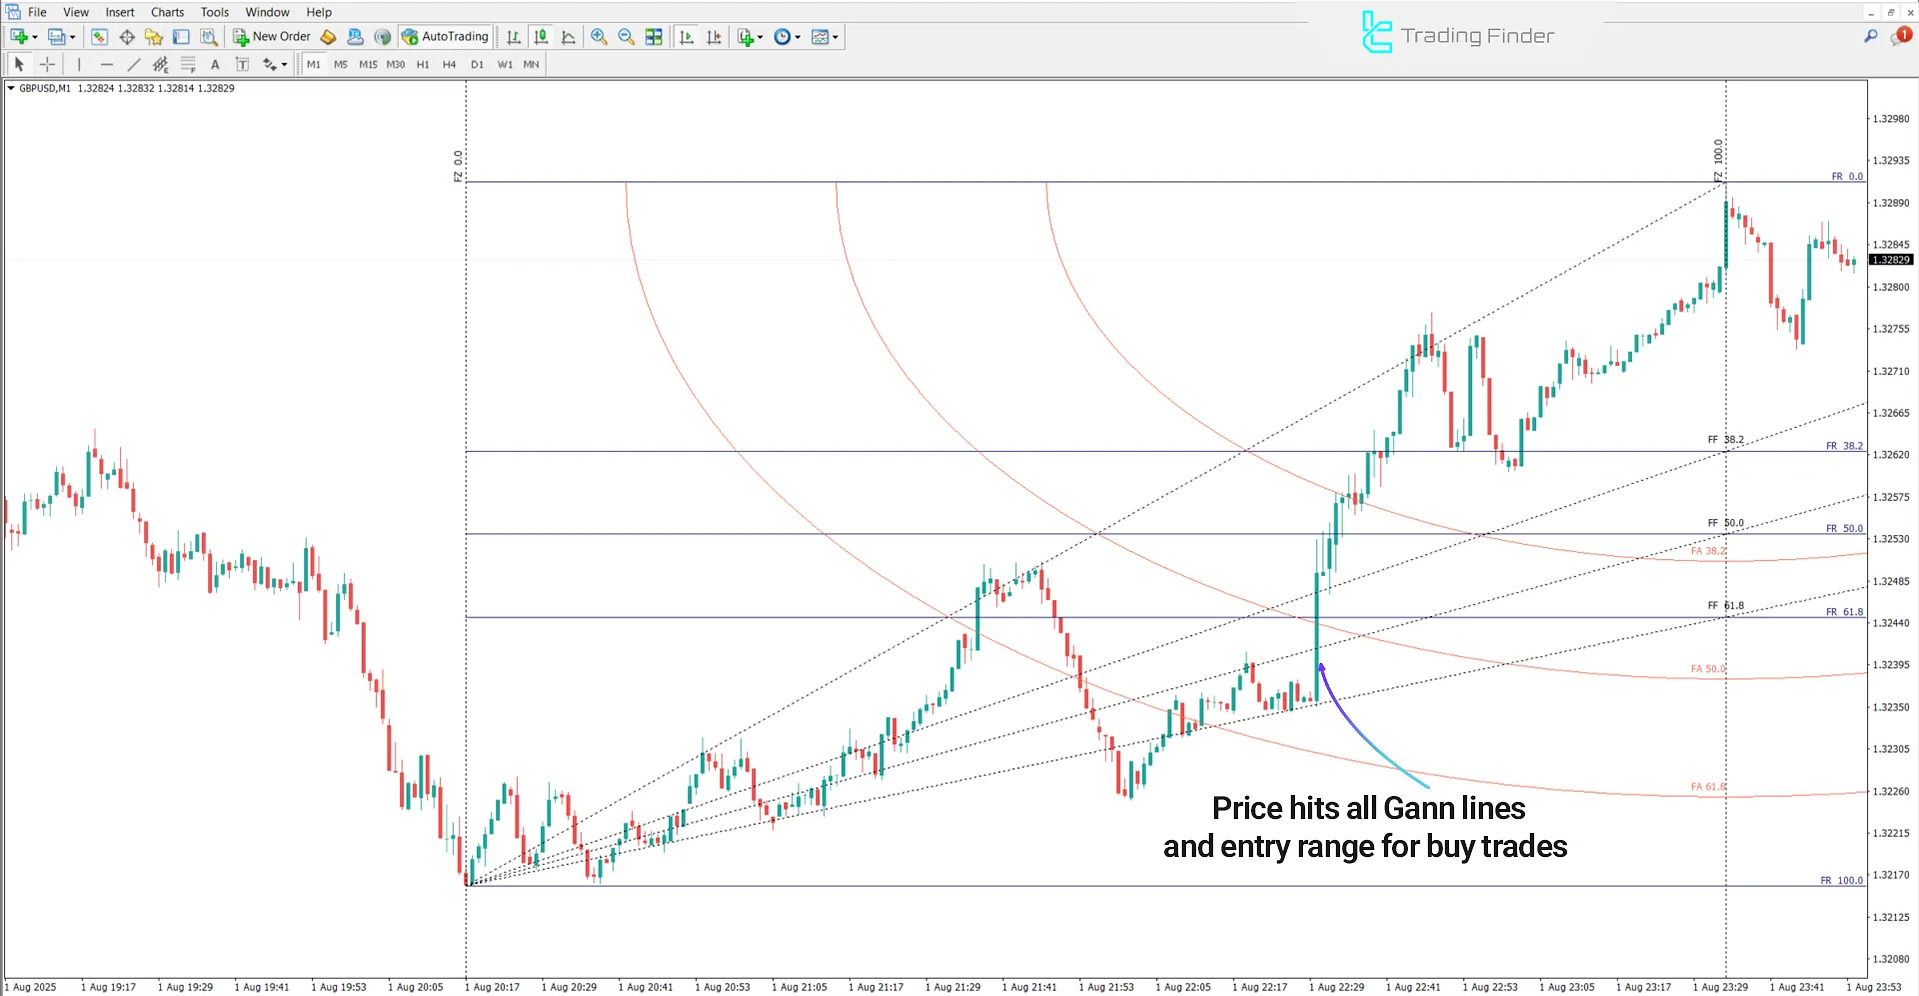
The chart below shows the GBP/USD pair in a 1-minute timeframe. In an uptrend, when the price holds above the 61.8% level while breaking higher angles, such as 50, it reflects buying pressure and market demand dominance.
Additionally, the confluence of ascending fan lines with primary time cycles generates a valid signal to enter long positions.

Indicator in a Downtrend
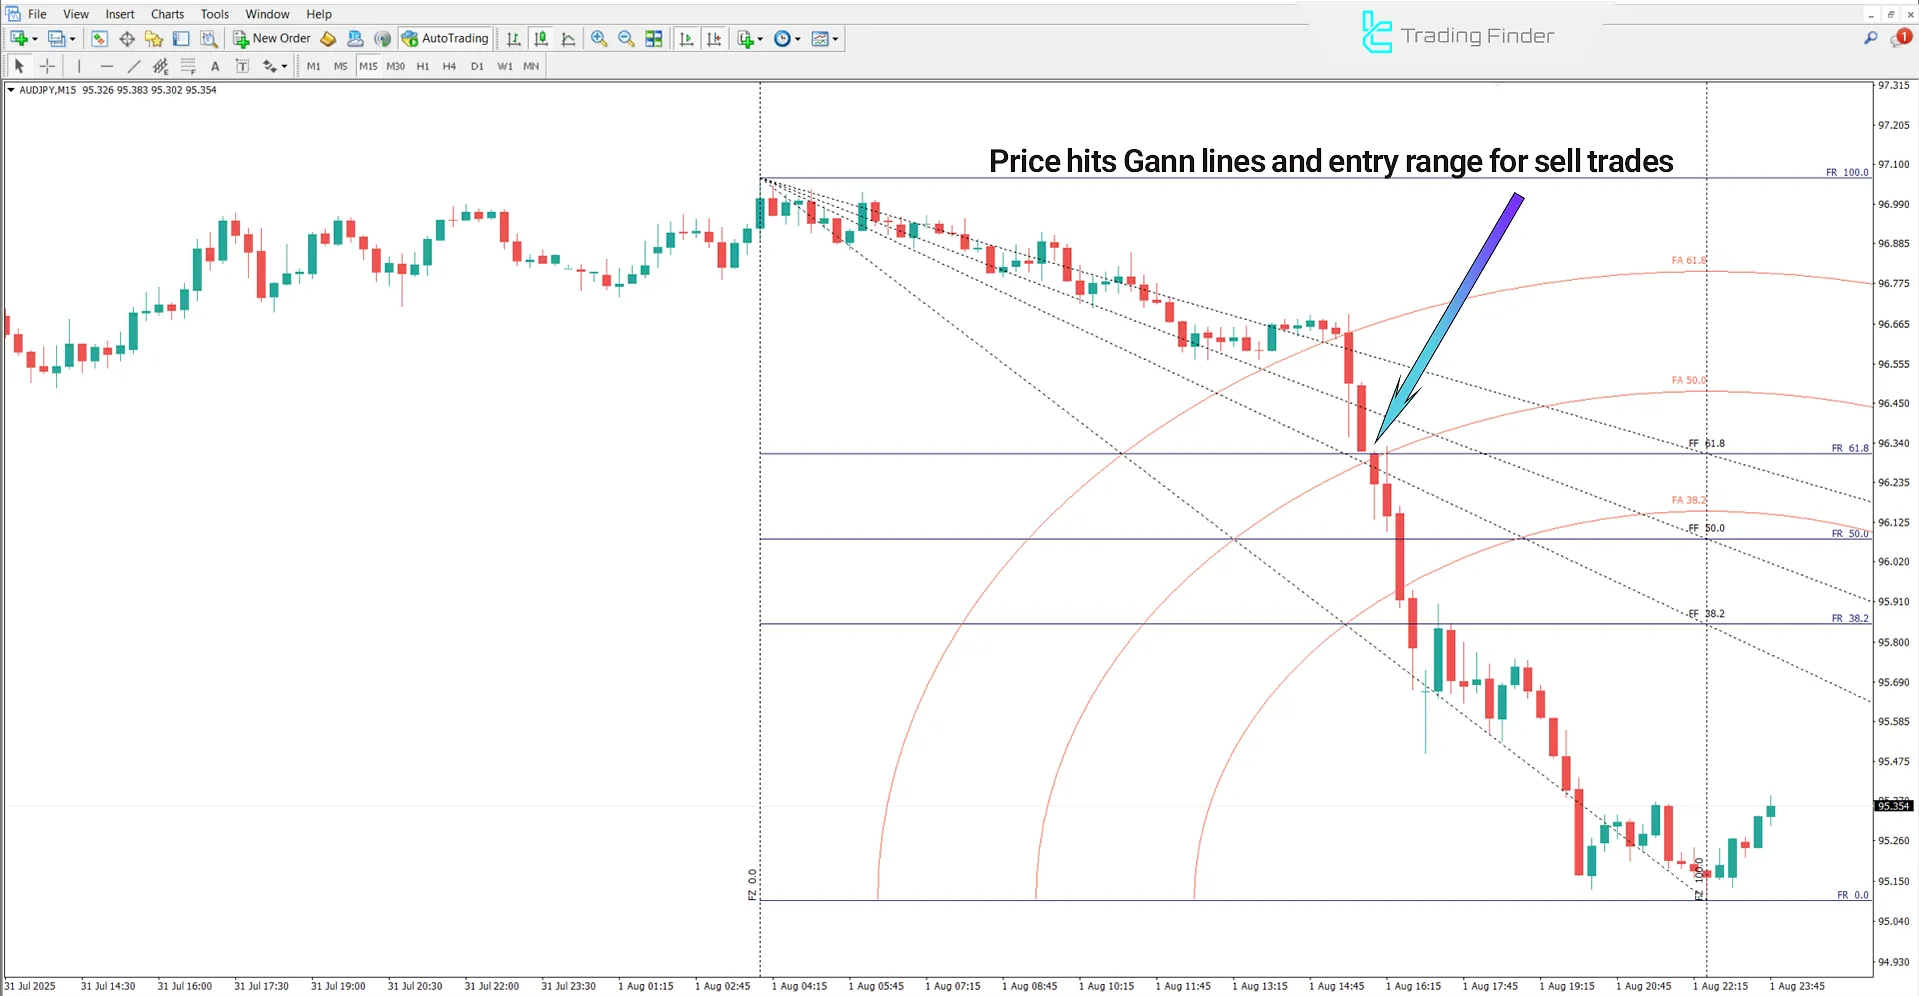
The chart below shows the AUD/JPY pair in a 15-minute timeframe. In a downtrend, when the price moves below the 61.8% level and breaks lower angles, it signals increasing selling pressure.
If this movement coincides with a price peak near a sensitive time cycle or a bearish intersection with descending fan lines, the likelihood of further price decline increases.

Gann Square Indicator Settings
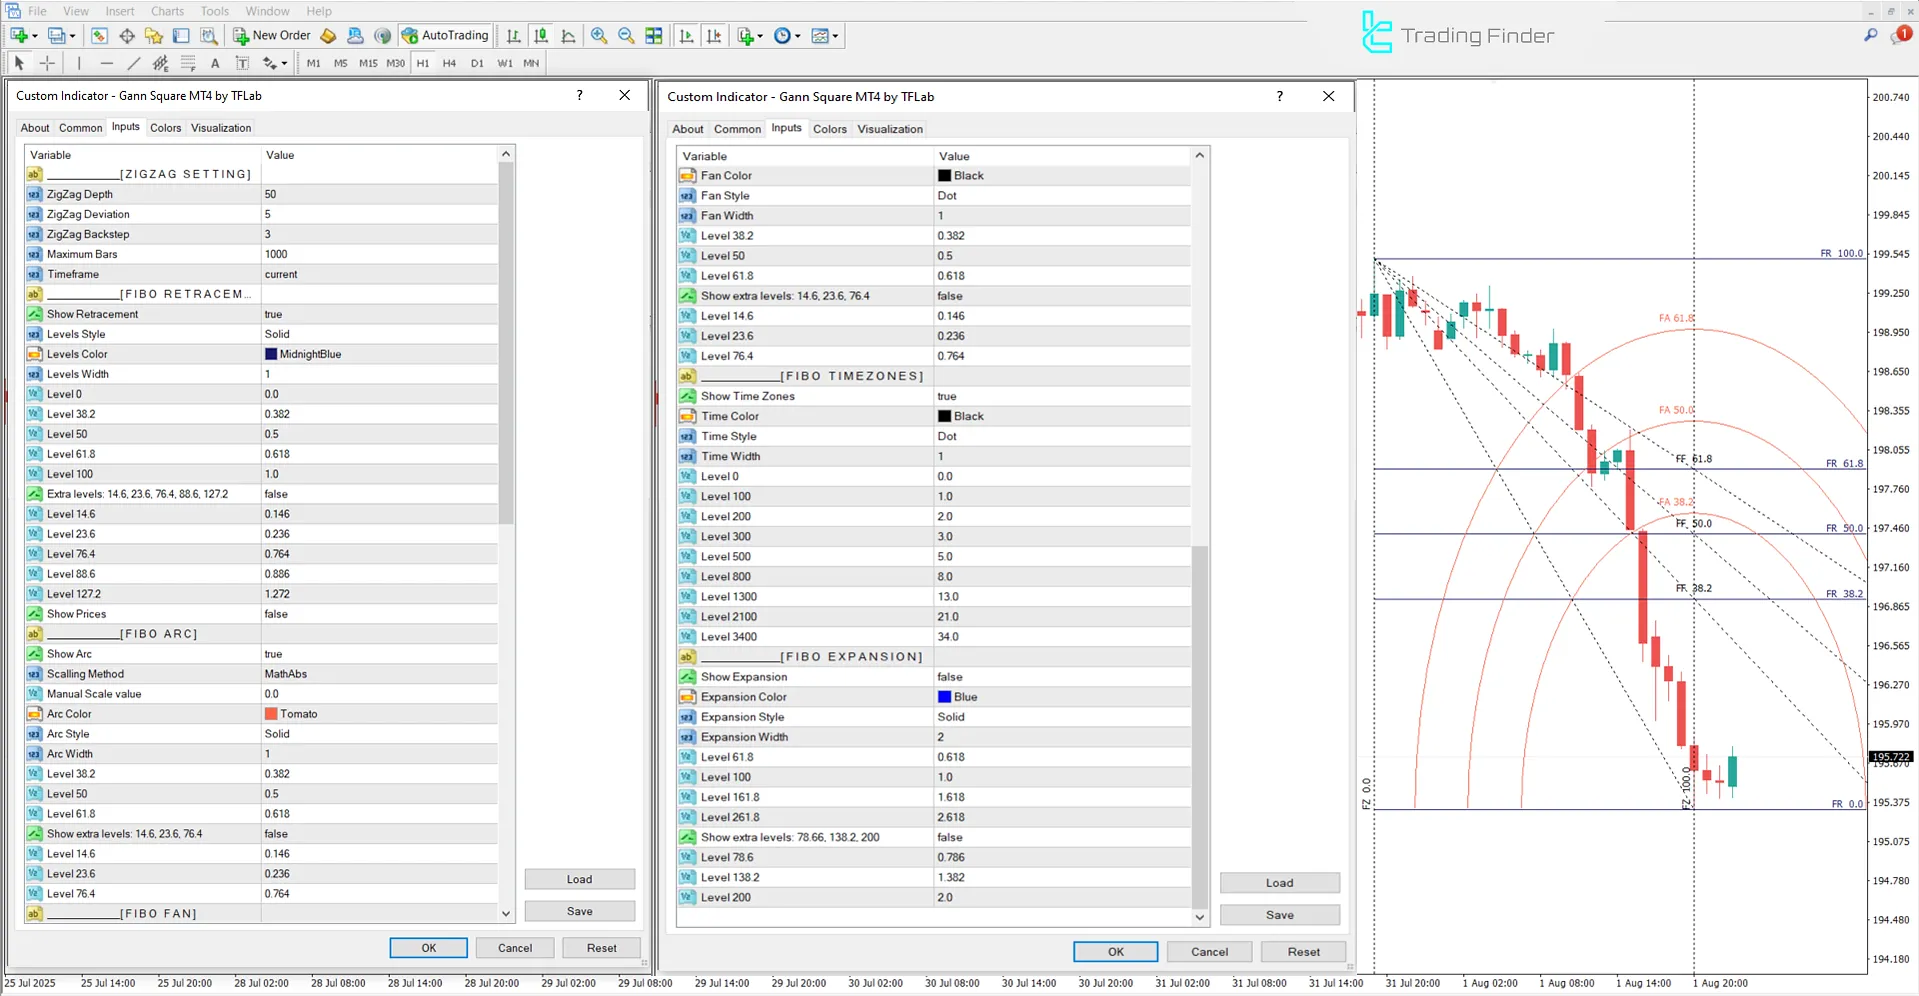
The image below shows the settings panel of the Gann Square indicator:

ZIGZAG SETTING
- ZigZag Depth: Controls sensitivity to price swings
- ZigZag Deviation: Minimum price change for a new leg
- ZigZag Backstep: Filter to avoid false pivots
- Maximum Bars: Number of candles used in calculation
- Timeframe: Chart period for analysis
FIBO RETRACEMENT
- Show Retracement: Enables Fibonacci retracement display
- Level Style: Visual format of retracement lines
- Levels Color: Show format of retracement lines
- Levels Width: Display Visual format of retracement lines
- Level 0: Baseline Price Level 0%
- Level 38.2: Golden Ratio Zone 38.2%
- Level 50: Midpoint Retracement Level 50%
- Level 61.8: Key Fibonacci Ratio 61.8%
- Level 100: Full Price Range 100%
- Extra Levels: Additional Fibonacci Ratios
- Level 14.6: Minor Support Level 14.6%
- Level 23.6: Shallow Retracement Zone 23.6%
- Level 76.4: Deep Pullback Level 76.4%
- Level 88.6: Extreme Retracement Zone 88.6%
- Level 127.2: Extended Target Level 127.2%
- Show Prices: Display Price Labels
FIBO ARC
- Show Arc: Display Fibonacci Arc
- Scaling Method: Arc Scaling Mode
- Manual Scale Value: Custom Scale Input
- Arc Color:Arc Line Color
- Arc Style: Arc Line Style
- Arc Width: Arc Line Thickness
- Level 38.2: Golden Ratio Zone 38.2%
- Level 50: Midpoint Retracement Level 50%
- Level 61.8: Key Fibonacci Ratio 61.8%
- Show extra levels: Display Additional Ratios
- Level 14.6: Minor Support Ratio 14.6%
- Level 23.6: Shallow Retracement Zone 23.6%
- Level 76.4:Deep Pullback Ratio 76.4%
FIBO FAN
- Fan Color: Fan Line Color
- Fan Style: Fan Line Style
- Fan Width: Fan Line Thickness
- Level 38.2: Golden Ratio Zone 38.2%
- Level 50: Midpoint Retracement Level 50%
- Level 61.8: Key Fibonacci Ratio 61.8%
- Show extra levels: Display Additional Ratios
- Level 14.6: Minor Support Ratio 14.6%
- Level 23.6: Shallow Retracement Zone 23.6%
- Level 76.4: Deep Pullback Ratio 76.4%
FIBO TIMEZONES
- Show Time Zones: Display Time Intervals
- Time Color: Zone Line Color
- Time Style: Zone Line Style
- Time Width: Zone Line Thickness
- Level 0: Starting Time Point 0%
- Level 100: First Cycle Zone 100%
- Level 200: Second Cycle Zone 200%
- Level 300: Third Cycle Zone 300%
- Level 500: Fifth Cycle Zone 500%
- Level 800: Eighth Cycle Zone 800%
- Level 1300: Thirteenth Cycle Zone 1300%
- Level 2100: Twenty First Cycle 2100%
- Level 3400: Thirty Fourth Cycle 3400%
FIBO EXPANSION
- Show Expansion: Display Price Projection
- Expansion Color: Expansion Line Color
- Expansion Style: Expansion Line Style
- Expansion Width: Expansion Line Thickness
- Level 61.8: Golden Ratio Target 61.8%
- Level 100: ull Range Projection 100%
- Level 161.8: Extended Fibonacci Target 161.8%
- Level 261.8: Advanced Expansion Level 261.8%
- Show extra levels: Display Additional Ratios
- Level 78.6: Deep Retracement Ratio 78.6%
- Level 138.2: Extended Projection Zone 138.2%
- Level 200: Double Range Target 200%
Conclusion
The Gann Square Indicator is one of the advanced, multi-dimensional tools in technical analysis that, by combining market geometry, time cycles, and price behavior, provides the ability to identify reversal points, trend structures, and sensitive price levels.
Its main components Gann Angles, Gann Square, Gann Fan, and Time Arcs are all based on time price symmetry.
This indicator enables traders to evaluate the market not only on past data but also with a computational and precise perspective, helping to spot optimal entry and exit zones.
Gann Square Indicator MetaTrader 4 PDF
Gann Square Indicator MetaTrader 4 PDF
Click to download Gann Square Indicator MetaTrader 4 PDFOn what principles is the Gann Square Indicator based?
It is based on the proportionality and symmetry between time and price, geometric angles, and time cycles.
What is the best timeframe for using Gann Square?
This tool can be applied to all timeframes, but it shows higher accuracy and reliability on higher timeframes (daily, weekly, monthly).


