![Hammer Pattern indicator for MT4 Download - Free - [Trading Finder]](https://cdn.tradingfinder.com/image/108261/11-29-en-hammer-pattern-mt4.webp)
![Hammer Pattern indicator for MT4 Download - Free - [Trading Finder] 0](https://cdn.tradingfinder.com/image/108261/11-29-en-hammer-pattern-mt4.webp)
![Hammer Pattern indicator for MT4 Download - Free - [Trading Finder] 1](https://cdn.tradingfinder.com/image/92783/11-29-en-hammer-mt4-02.webp)
![Hammer Pattern indicator for MT4 Download - Free - [Trading Finder] 2](https://cdn.tradingfinder.com/image/92782/11-29-en-hammer-mt4-03.webp)
![Hammer Pattern indicator for MT4 Download - Free - [Trading Finder] 3](https://cdn.tradingfinder.com/image/92786/11-29-en-hammer-mt4-04.webp)
The Hammer Pattern indicator is a practical tool for traders to identify the Hammer pattern on the price chart in Technical analysis. The Hammer Candlestick indicator in MetaTrader 4 (MT4) detects the Hammer pattern and marks price reversal points.
It highlights these points by drawing a blue rectangle for the Hammer pattern and a red rectangle for the inverted Hammer pattern, helping traders easily recognize them.
Hammer Indicator Table
Indicator Categories: | Chart & Classic MT4 Indicators Candle Sticks MT4 Indicators Educational MT4 Indicators |
Platforms: | MetaTrader 4 Indicators |
Trading Skills: | Elementary |
Indicator Types: | Leading MT4 Indicators Reversal MT4 Indicators |
Timeframe: | Multi-Timeframe MT4 Indicators |
Trading Style: | Day Trading MT4 Indicators Intraday MT4 Indicators Scalper MT4 Indicators |
Trading Instruments: | Indices Market MT4 Indicators Cryptocurrency MT4 Indicators Forex MT4 Indicators |
Hammer Pattern Identification

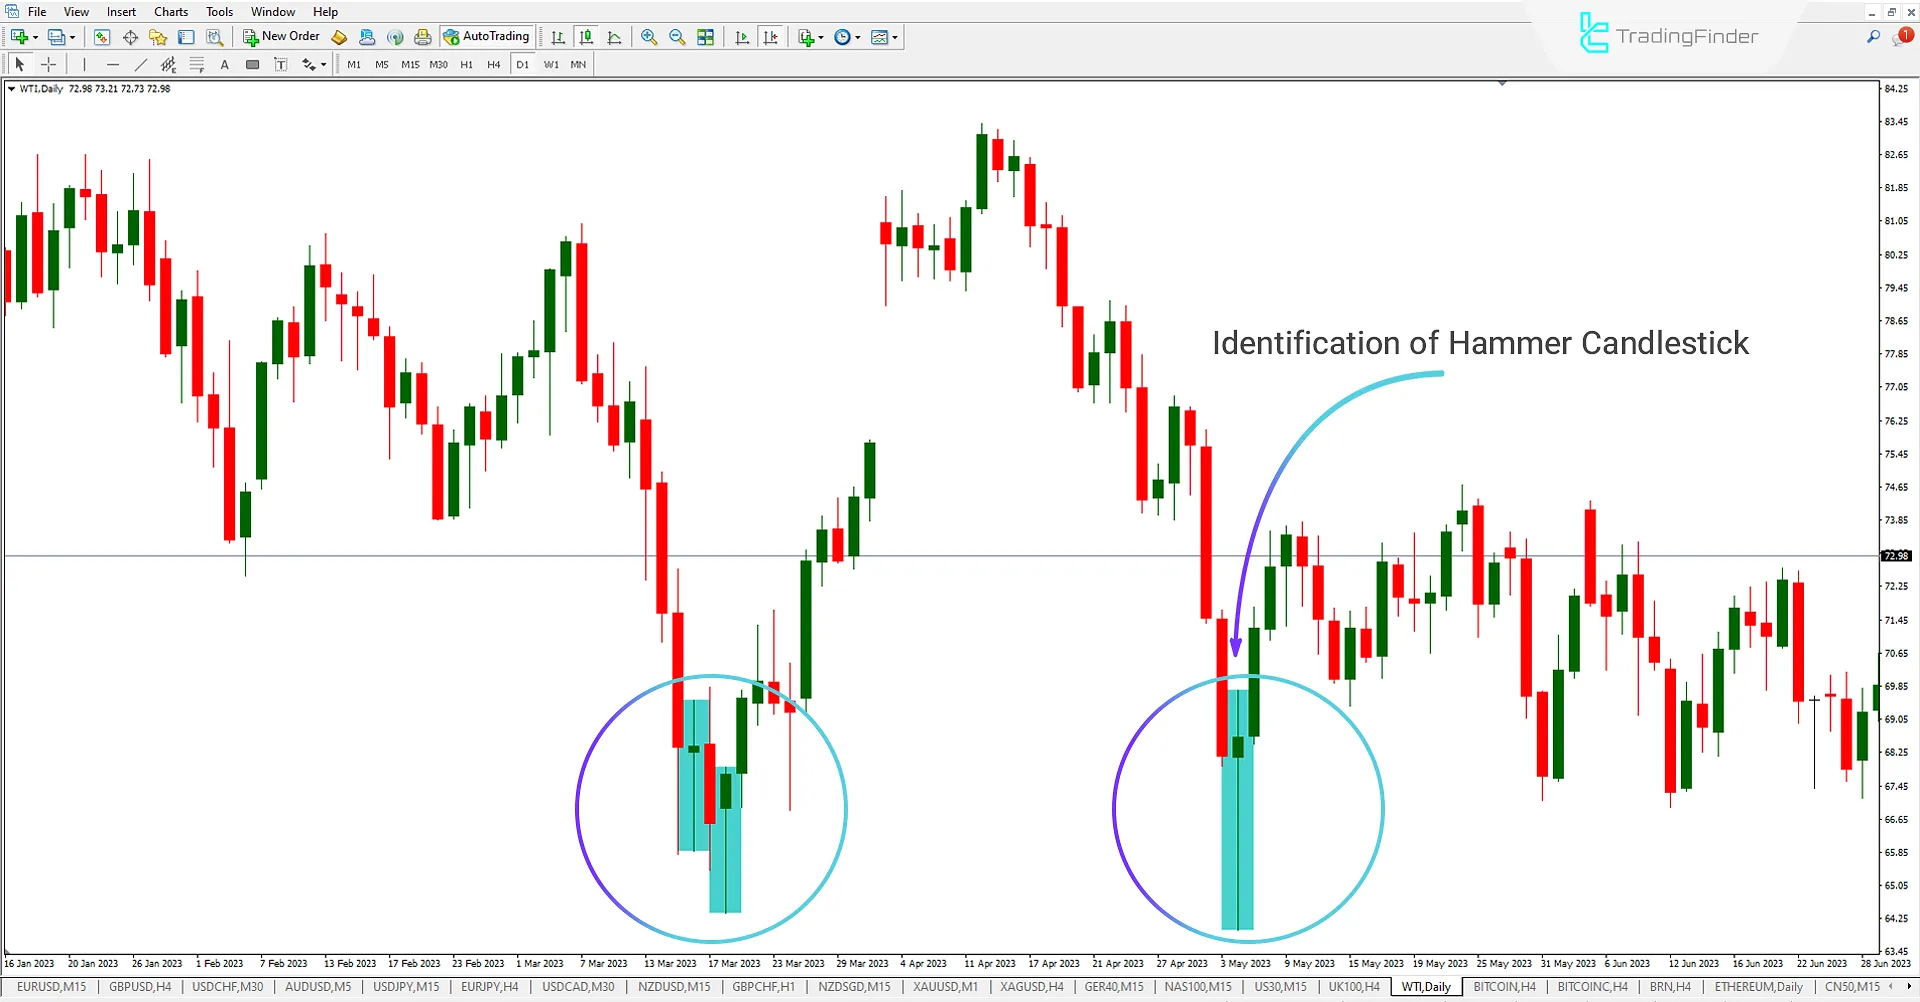
In the daily WTI Oil chart, the Hammer Pattern indicator detects the Hammer pattern and marks it with a blue rectangle on the price chart. This visual aid helps traders easily recognize the pattern and predict potential trend reversals in the market.
Inverted Hammer Pattern

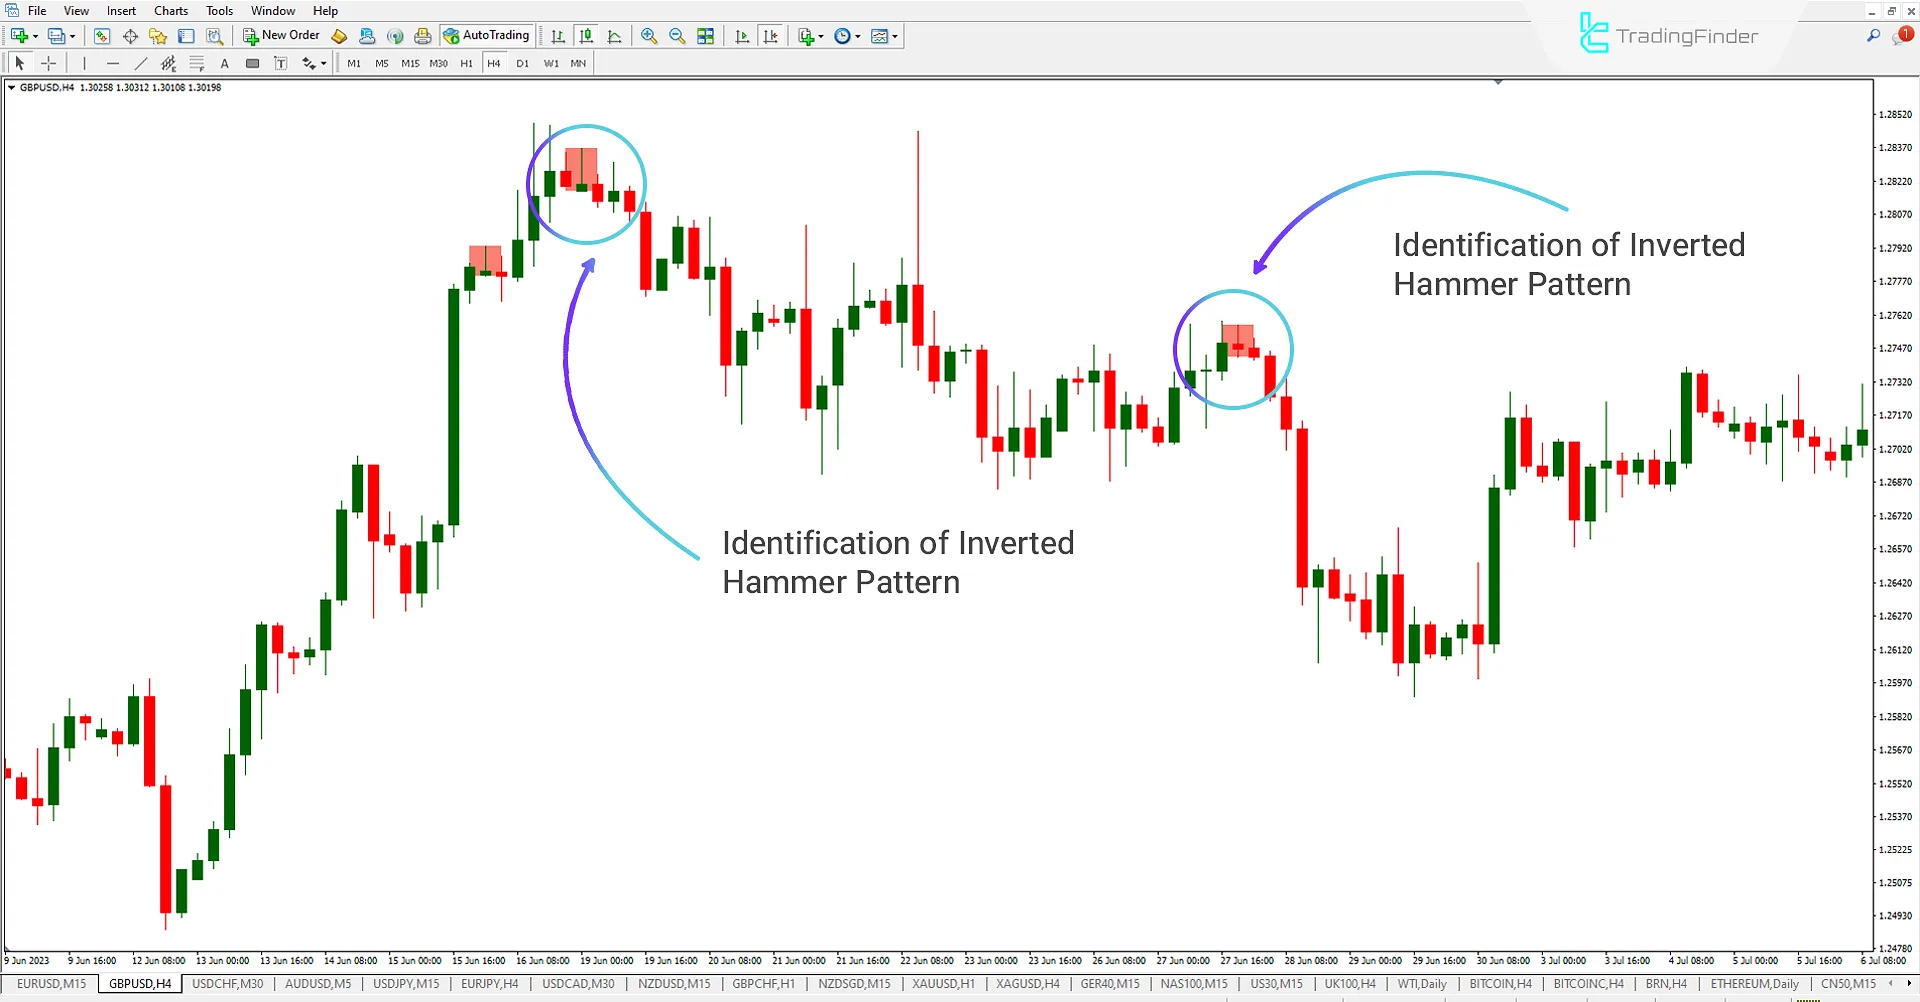
In the 4-hour GBP/USD chart, during an uptrend, the Hammer Pattern indicator detects an inverted Hammer pattern and highlights it by drawing a red rectangle on the chart. This helps traders recognize potential reversal points and plan their trades accordingly.
Hammer Indicator Settings

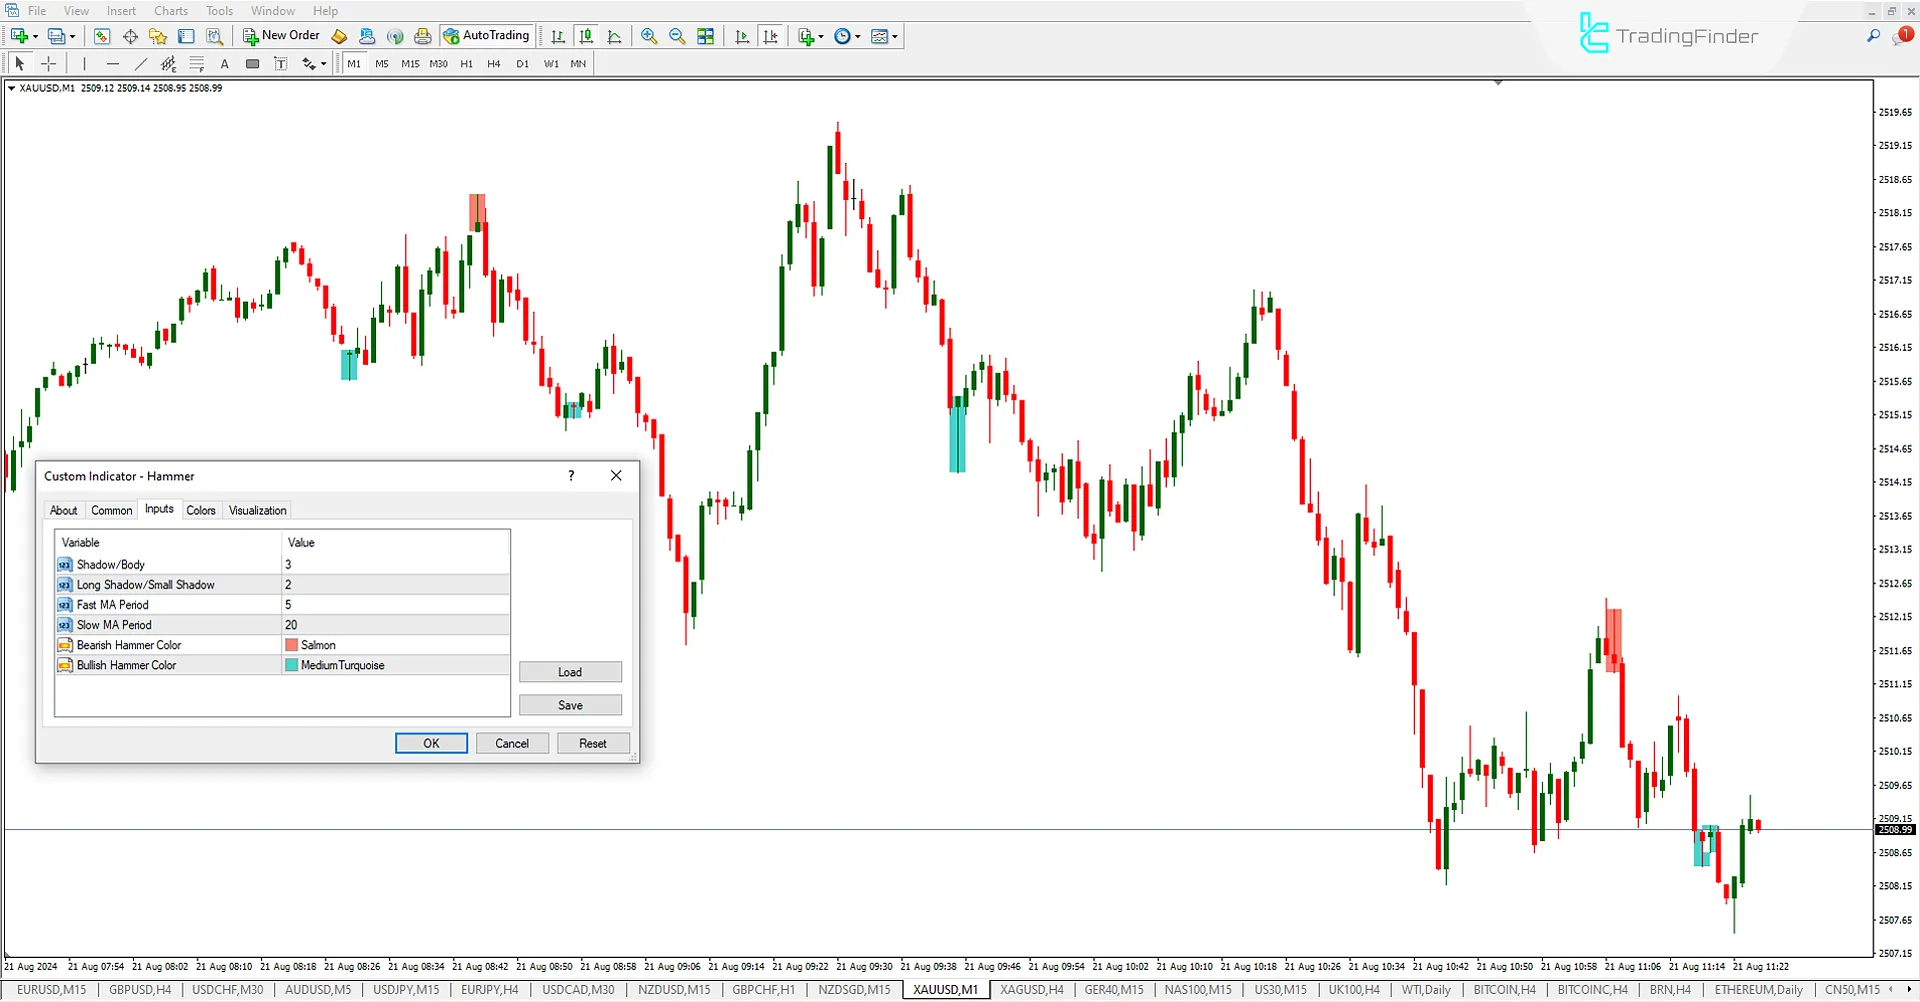
- Shadow/Body: Ratio of shadow to candle body
- Long Shadow/Small Shadow: Ratio of a long shadow to a small shadow
- Fast MA Period: Fast Moving Average period
- Slow MA Period: Slow Moving Average period
- Bearish Hammer Color: Color for bearish Hammer candle
- Bullish Hammer Color: Color for bullish Hammer candle
Conclusion
The Hammer Pattern Indicator is a tool designed for beginner to intermediate traders to detect Classic and Chart Pattern indicators. By identifying the Hammer and Inverted Hammer patterns and displaying them on the chart, this trading tool helps traders make more informed decisions by highlighting potential reversal points in the market.
Hammer Pattern indicator MT4 PDF
Hammer Pattern indicator MT4 PDF
Click to download Hammer Pattern indicator MT4 PDFWhat is the Hammer Pattern Indicator?
The Hammer Pattern Indicator is a tool designed to detect the Hammer and inverted Hammer patterns on the price chart. It marks price reversal points and draws colored rectangles (blue for Hammer and red for inverted Hammer) to help traders easily recognize these patterns.
What causes the Hammer and inverted Hammer patterns?
The Hammer pattern typically appears at the end of a downtrend, indicating a possible reversal to an uptrend. It has a small body at the top of the price bar and a long shadow below. The inverted Hammer pattern appears at the end of an uptrend, usually signaling a reversal to a downtrend, with a small body at the bottom of the price bar and a long shadow above.


