![Head and Shoulders Visual Indicator for MetaTrader 4 Download - [TradingFinder]](https://cdn.tradingfinder.com/image/309690/2-44-en-head-shoulders-visual-mt4-1.webp)
![Head and Shoulders Visual Indicator for MetaTrader 4 Download - [TradingFinder] 0](https://cdn.tradingfinder.com/image/309690/2-44-en-head-shoulders-visual-mt4-1.webp)
![Head and Shoulders Visual Indicator for MetaTrader 4 Download - [TradingFinder] 1](https://cdn.tradingfinder.com/image/309691/2-44-en-head-shoulders-visual-mt4-2.webp)
![Head and Shoulders Visual Indicator for MetaTrader 4 Download - [TradingFinder] 2](https://cdn.tradingfinder.com/image/309687/2-44-en-head-shoulders-visual-mt4-3png.webp)
![Head and Shoulders Visual Indicator for MetaTrader 4 Download - [TradingFinder] 3](https://cdn.tradingfinder.com/image/309680/2-44-en-head-shoulders-visual-mt4-4.webp)
The Head and Shoulders Indicator for MetaTrader 4 predicts market trend reversals. Designed based on Technical analysis indicator, it is divided into two types: Head and Shoulders Top (Bearish), Inverse Head and Shoulders (Bullish).
Head and Shoulders Visual Specifications Table
Below is a table displaying the specifications of the Head and Shoulders Visual Indicator for MT4:
Indicator Categories: | Price Action MT4 Indicators Chart & Classic MT4 Indicators Harmonic MT4 Indicators |
Platforms: | MetaTrader 4 Indicators |
Trading Skills: | Intermediate |
Indicator Types: | Range MT4 Indicators Breakout MT4 Indicators |
Timeframe: | Multi-Timeframe MT4 Indicators |
Trading Style: | Intraday MT4 Indicators |
Trading Instruments: | Share Stocks MT4 Indicators Cryptocurrency MT4 Indicators Forex MT4 Indicators |
Indicator Overview
The Head and Shoulders Indicator automatically detects Head and Shoulders Top (Bearish) or Inverse Head and Shoulders (Bullish) patterns in the chart.
It provides entry and exit signals by identifying key points such as the left shoulder, head, right shoulder, and neckline. A neckline breakout in the new trend's direction confirms a trend reversal.
Uptrend Conditions
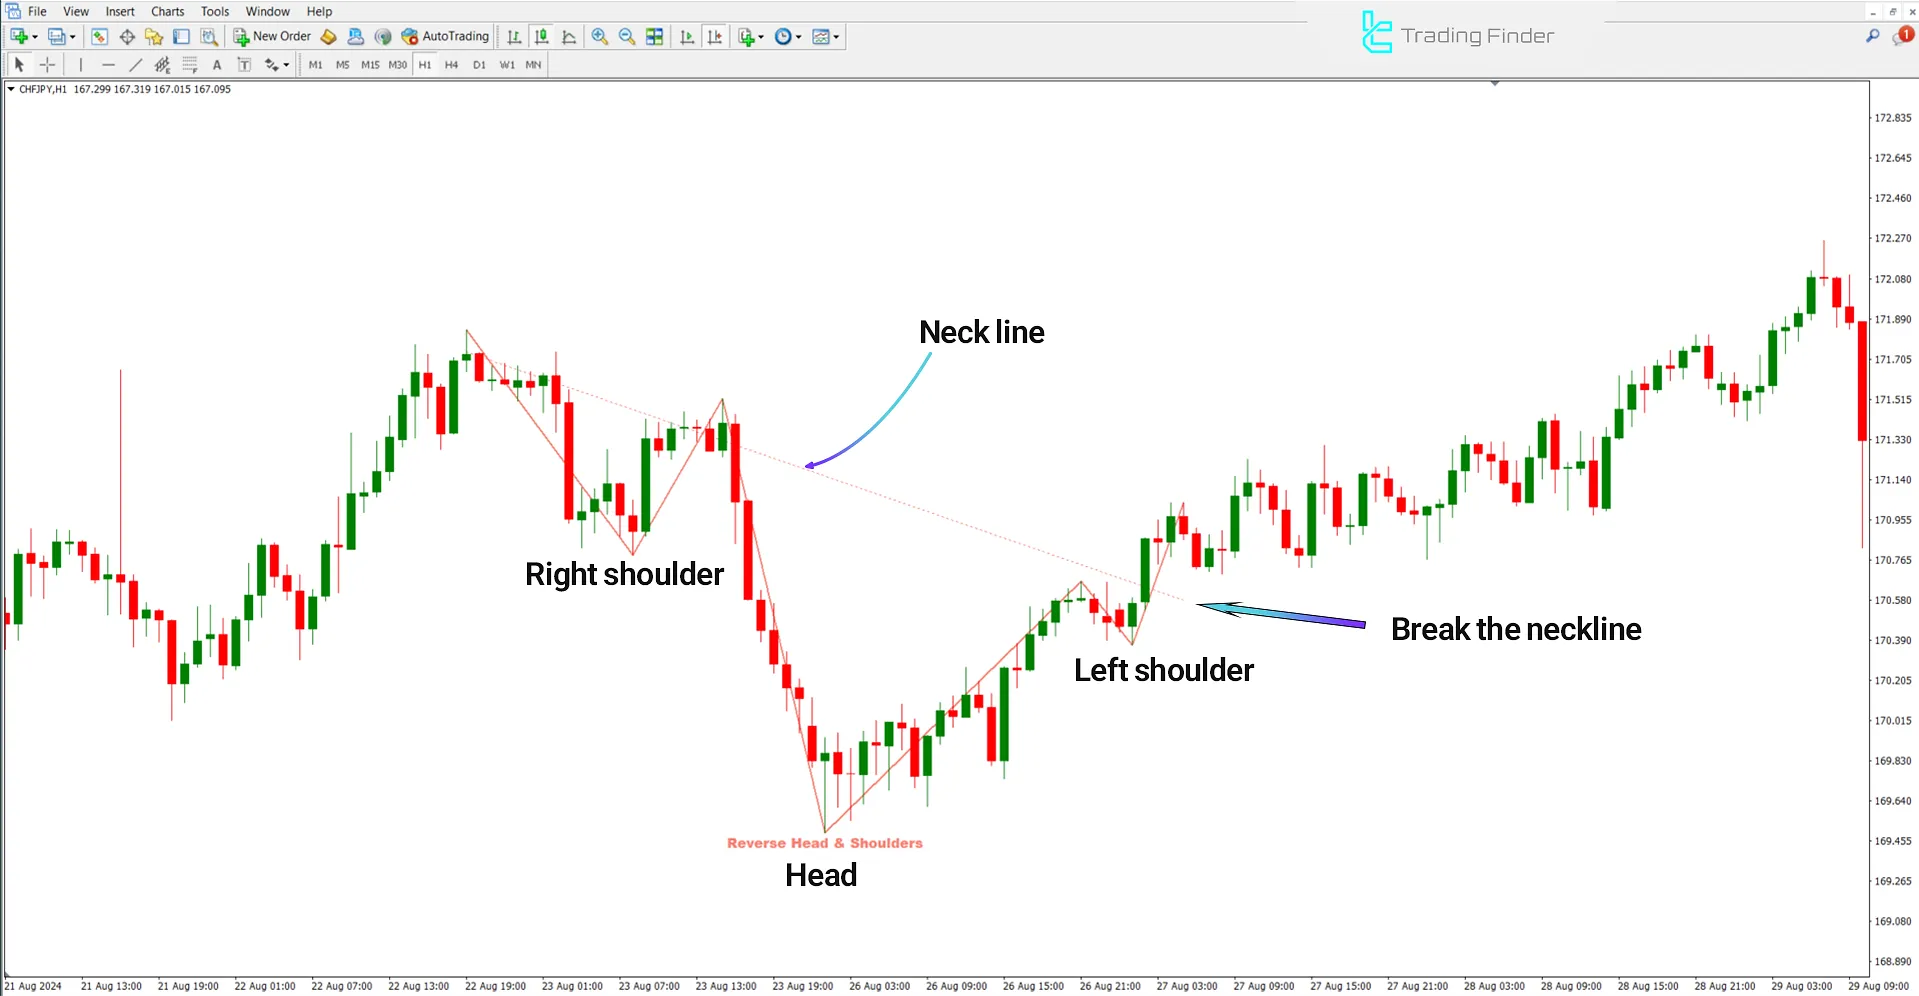
The price chart displays the Swiss Franc against the Japanese Yen (CHF/JPY) in the 1-hour timeframe.
The Inverse Head and Shoulders pattern indicates a trend reversal from bearish to bullish, typically forming at the end of a downtrend.
A breakout above the neckline generates a buy signal (Buy).

Downtrend Conditions
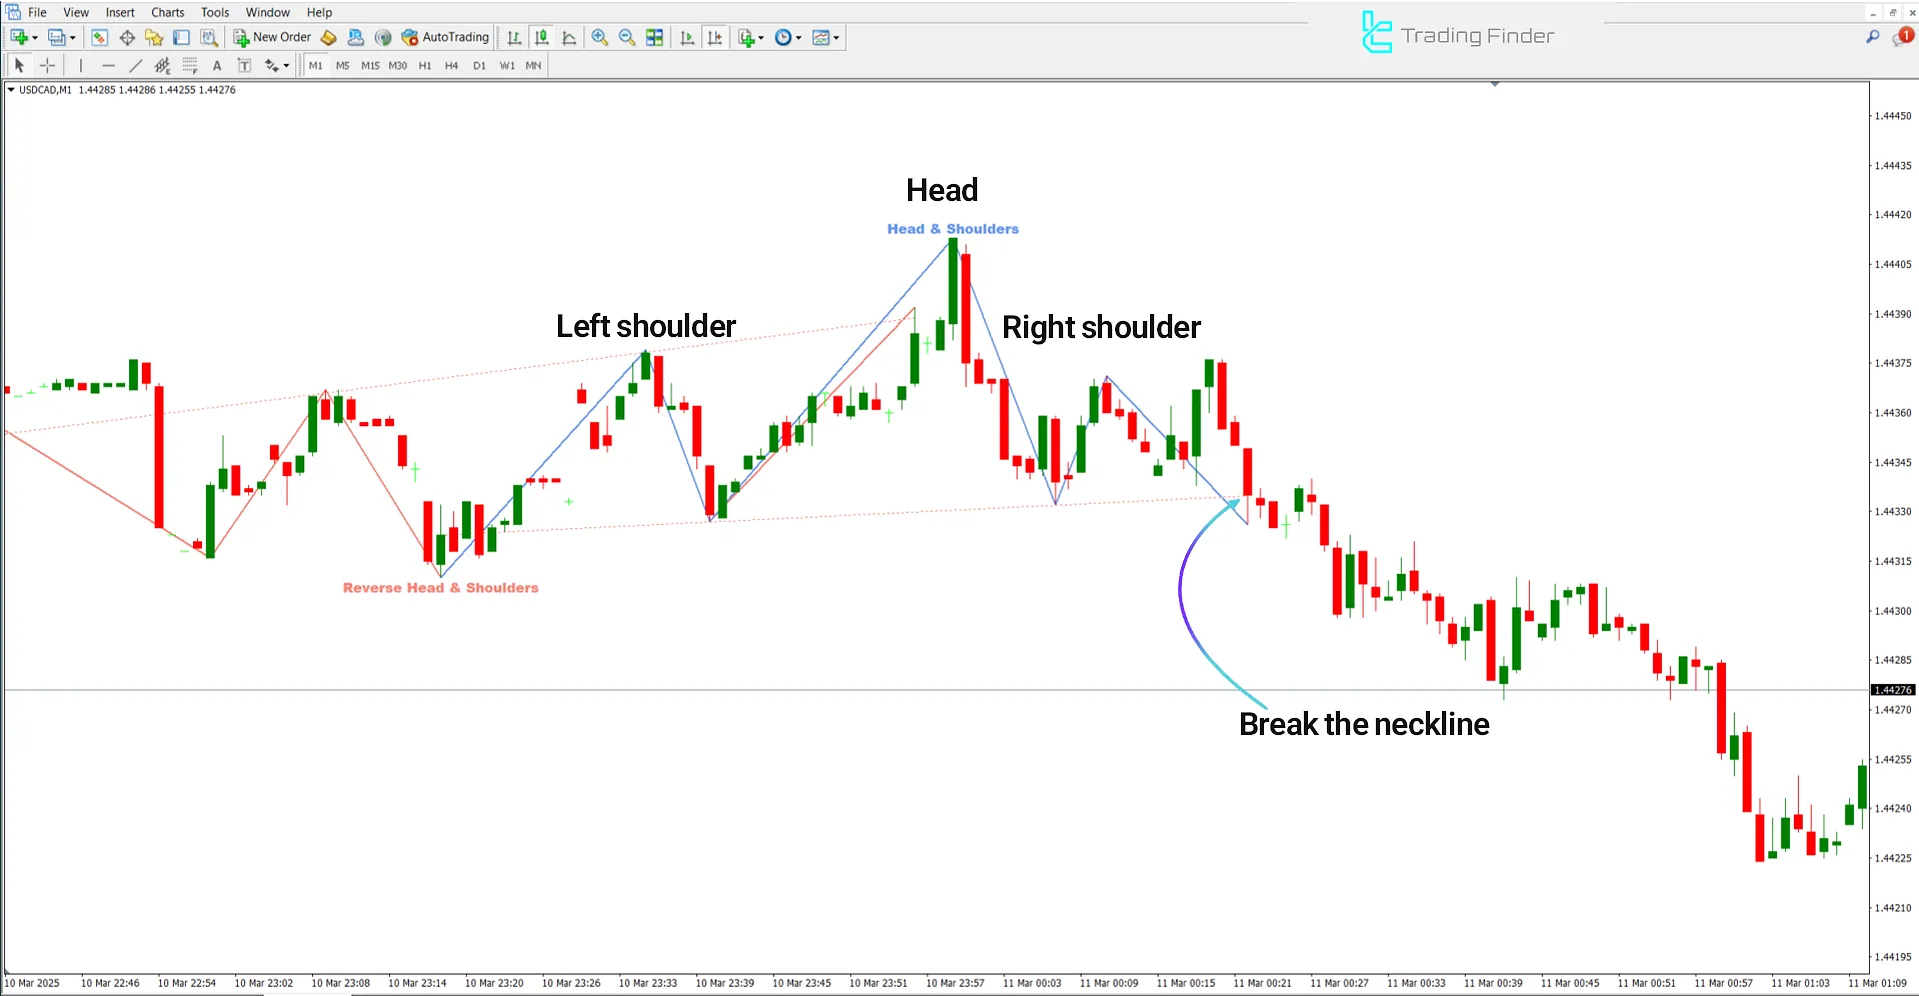
The following chart shows the USD/CAD currency pair in a 1-minute timeframe.
This chart shows the Head and Shoulders pattern, which indicates a trend reversal from bullish to bearish.
This harmonic pattern typically forms after an uptrend and generates a sell entry signal upon a neckline breakout.

Indicator Settings
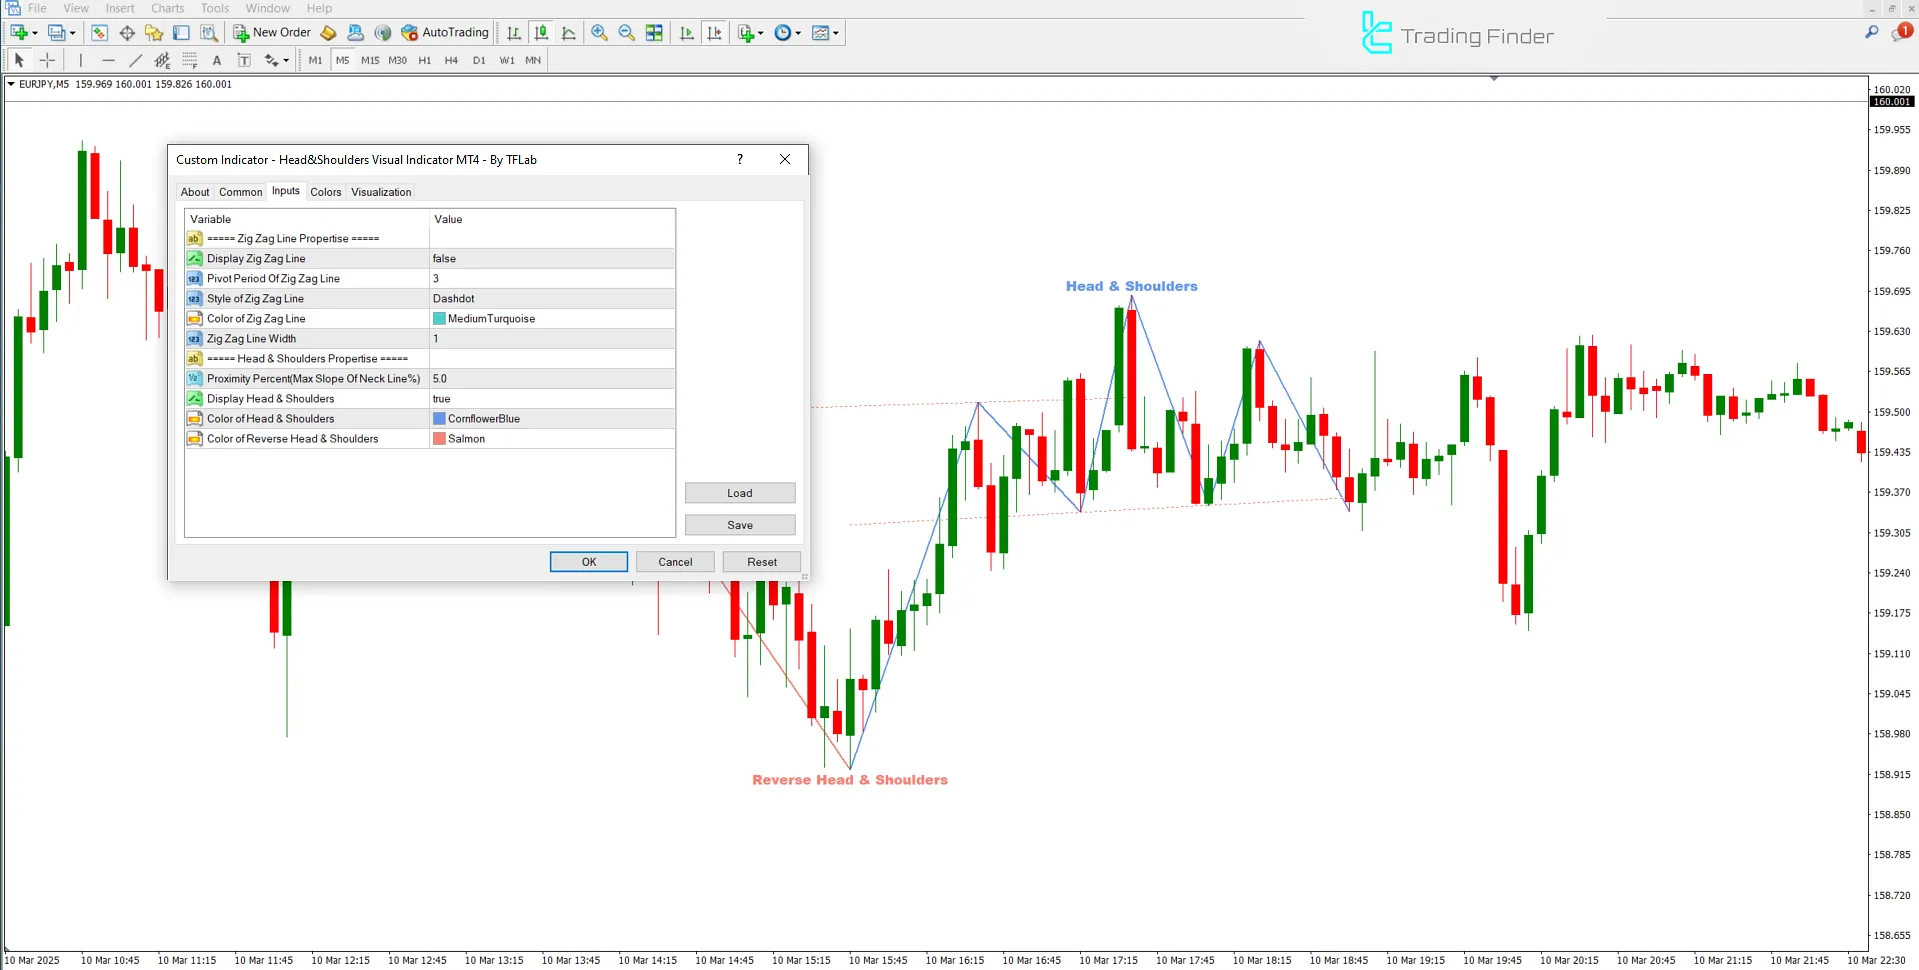
The indicator settings panel is shown in the image below:

- Display Zig Zag Line: Show the Zig Zag line
- Pivot Period Of Zig Zag Line: Set the pivot period of the Zig Zag line
- Style of Zig Zag Line: Define the style of the Zig Zag line
- Color of Zig Zag Line: Set the color of the Zig Zag line
- Zig Zag Line Width: Adjust the thickness of the Zig Zag line
- Proximity Percent (Max Slope Of Neck Line %): Set the maximum slope percentage for the neckline
- Display Head & Shoulders: Enable or disable the Head and Shoulders pattern display
- Color of Head & Shoulders: Choose the color of the Head and Shoulders pattern
- Color of Reverse Head & Shoulders: Choose the Inverse Head and Shoulders pattern color
Conclusion
The Head and Shoulders Visual Indicator in MetaTrader 4 is a trading tools for automatically identifying Head-and-Shoulders Top (Bearish) and inverted head-and-shoulders (Bullish) patterns.
This MT4 indicator detects key points, including the left shoulder, head, right shoulder, and neckline, providing entry and exit zones.
Head Shoulders Visual MT4 PDF
Head Shoulders Visual MT4 PDF
Click to download Head Shoulders Visual MT4 PDFWhat is the suitable timeframe for using this indicator?
This indicator supports multiple timeframes and applies to all timeframes.
Does the Head and Shoulders Indicator provide entry and exit signals?
No, this indicator identifies the entry range based on the neckline breakout and candlestick movement following the pattern.


