![Hidden Gap WRB Indicator for MT4 Download – Free – [TradingFinder]](https://cdn.tradingfinder.com/image/398581/13-132-en-hidden-gap-wrb-mt4-01.webp)
![Hidden Gap WRB Indicator for MT4 Download – Free – [TradingFinder] 0](https://cdn.tradingfinder.com/image/398581/13-132-en-hidden-gap-wrb-mt4-01.webp)
![Hidden Gap WRB Indicator for MT4 Download – Free – [TradingFinder] 1](https://cdn.tradingfinder.com/image/398579/13-132-en-hidden-gap-wrb-mt4-02.webp)
![Hidden Gap WRB Indicator for MT4 Download – Free – [TradingFinder] 2](https://cdn.tradingfinder.com/image/398580/13-132-en-hidden-gap-wrb-mt4-03.webp)
![Hidden Gap WRB Indicator for MT4 Download – Free – [TradingFinder] 3](https://cdn.tradingfinder.com/image/398582/13-132-en-hidden-gap-wrb-mt4-04.webp)
The Hidden Gap WRB Indicator is designed to identify hidden supply and demand zones on the MT4 platform.
This trading tool is based on the concept of Wide Range Bars (WRB) and uses colored boxes to mark hidden gaps directly on the chart.
Hidden Gap WRB Indicator Specification Table
The specifications of the WRB Hidden Gaps Indicator are presented in the table below.
Indicator Categories: | Price Action MT4 Indicators Support & Resistance MT4 Indicators Supply & Demand MT4 Indicators |
Platforms: | MetaTrader 4 Indicators |
Trading Skills: | Intermediate |
Indicator Types: | Reversal MT4 Indicators |
Timeframe: | Multi-Timeframe MT4 Indicators |
Trading Style: | Day Trading MT4 Indicators Scalper MT4 Indicators Swing Trading MT4 Indicators |
Trading Instruments: | Forward Market MT4 Indicators Stock Market MT4 Indicators Cryptocurrency MT4 Indicators Forex MT4 Indicators |
Hidden Gap WRB at a Glance
These hidden gaps can act as concealed support or resistance zones in technical analysis.
When the price enters or exits these areas, it may indicate high probability trade opportunities. This indicator can assist traders in making precise entry decisions.
Bullish Trend Analysis
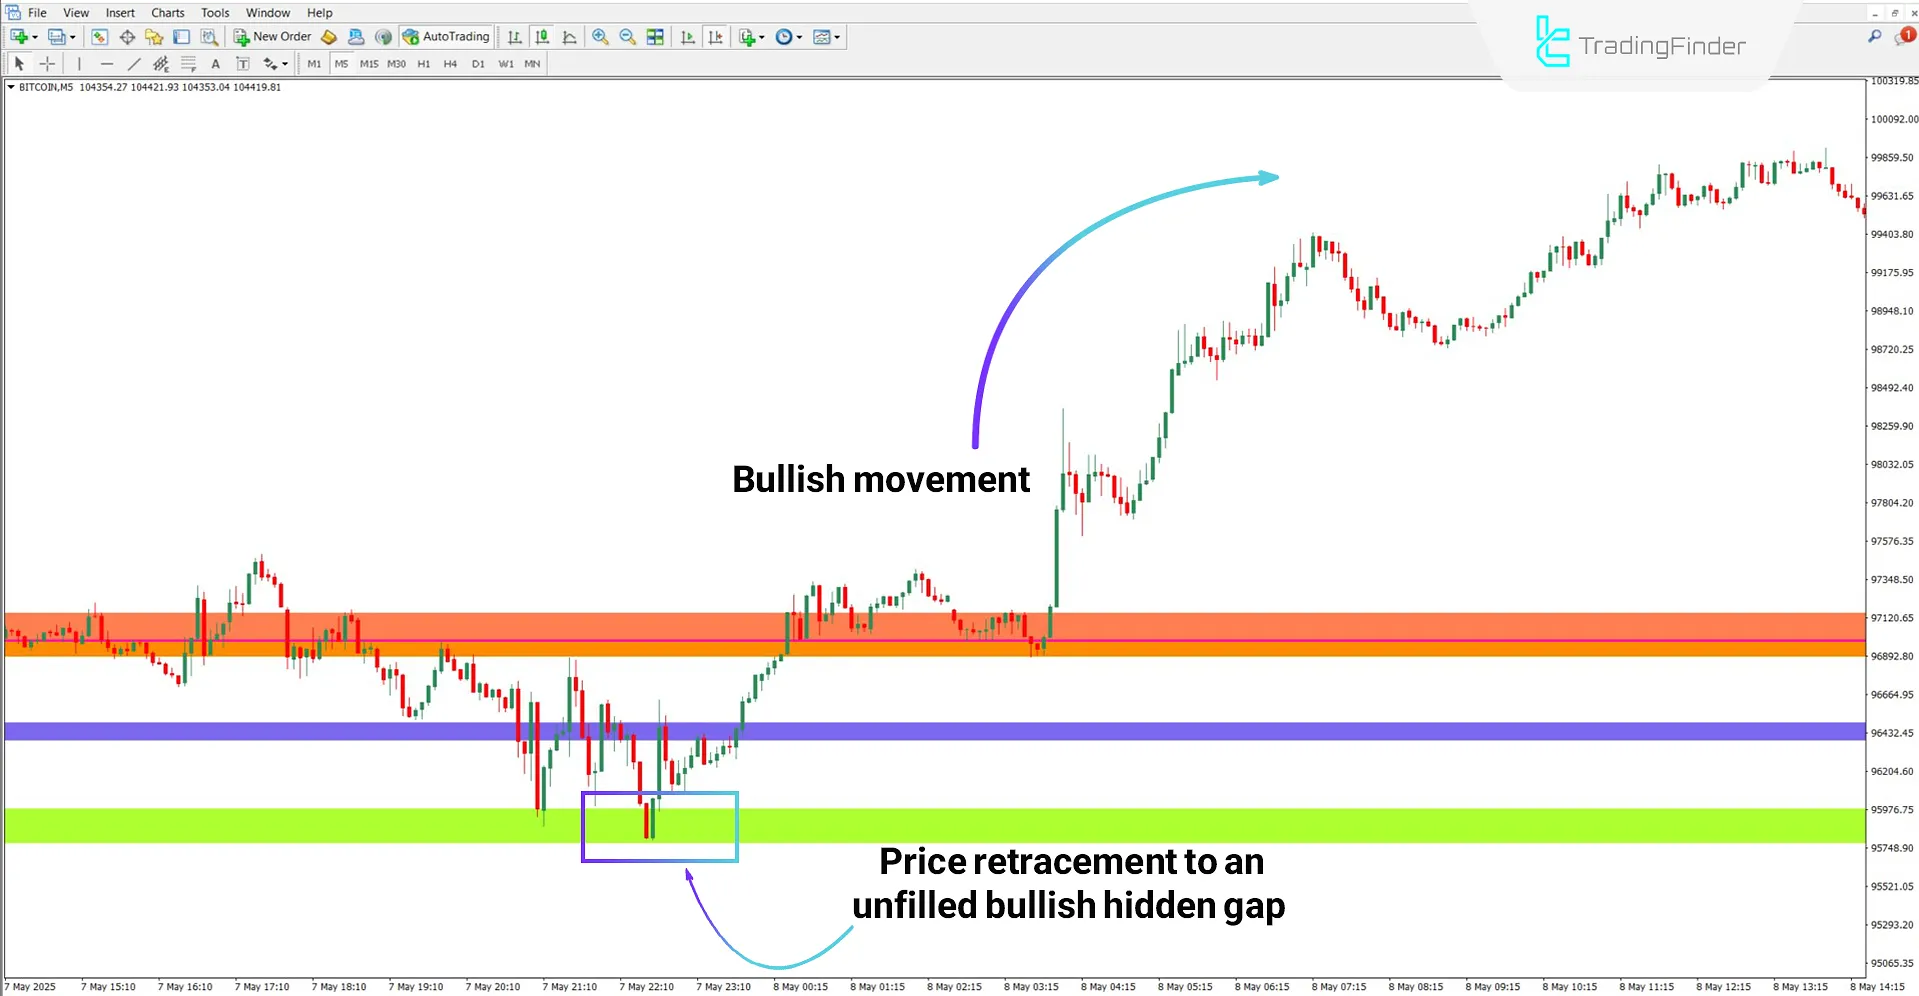
Based on the 5-minute Bitcoin (BTC) chart, the price experiences a downward correction, touches an unfilled bullish hidden gap, and reverses upward. Such reaction zones can be ideal for long trade entries.

Bearish Trend Analysis
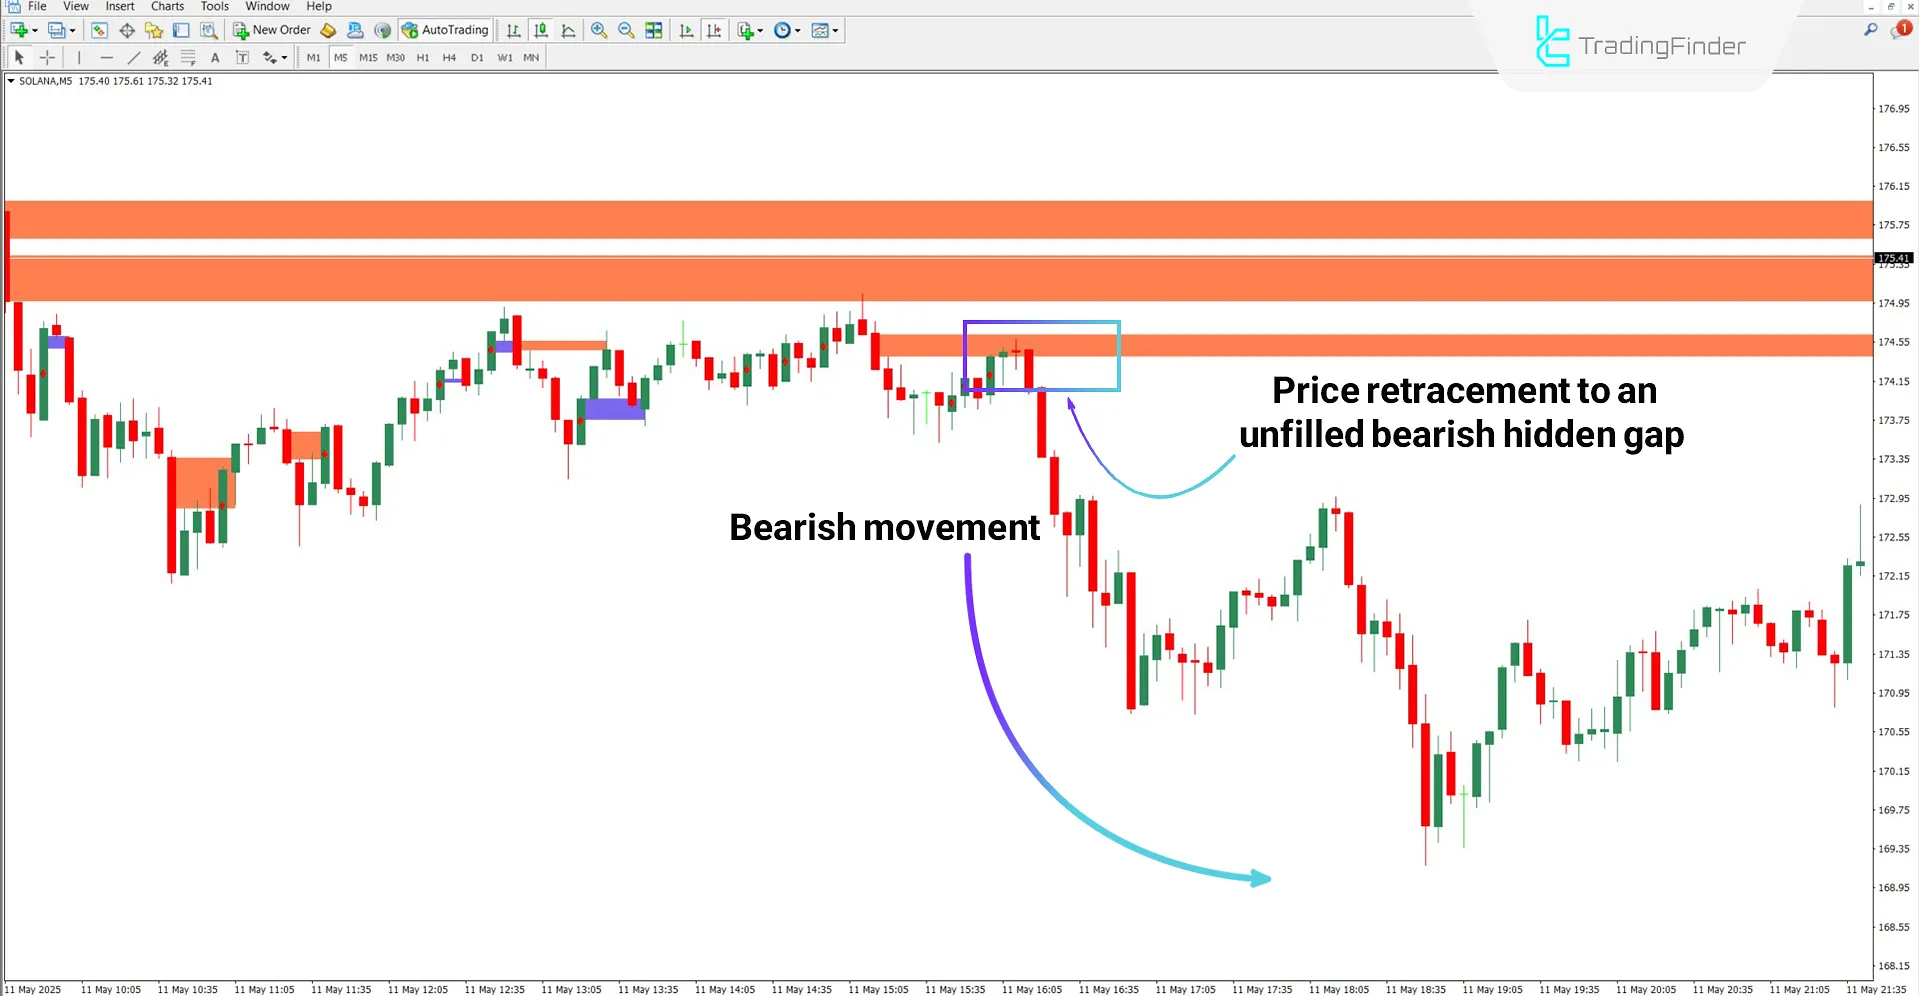
According to the 5 minute Solana (SOLANA) chart, the price hits a new hidden gap and begins a strong downtrend. These bearish hidden gaps act as resistance zones. Price interaction with these areas may offer short term trade entry signals.

Hidden Gap WRB Indicator Settings
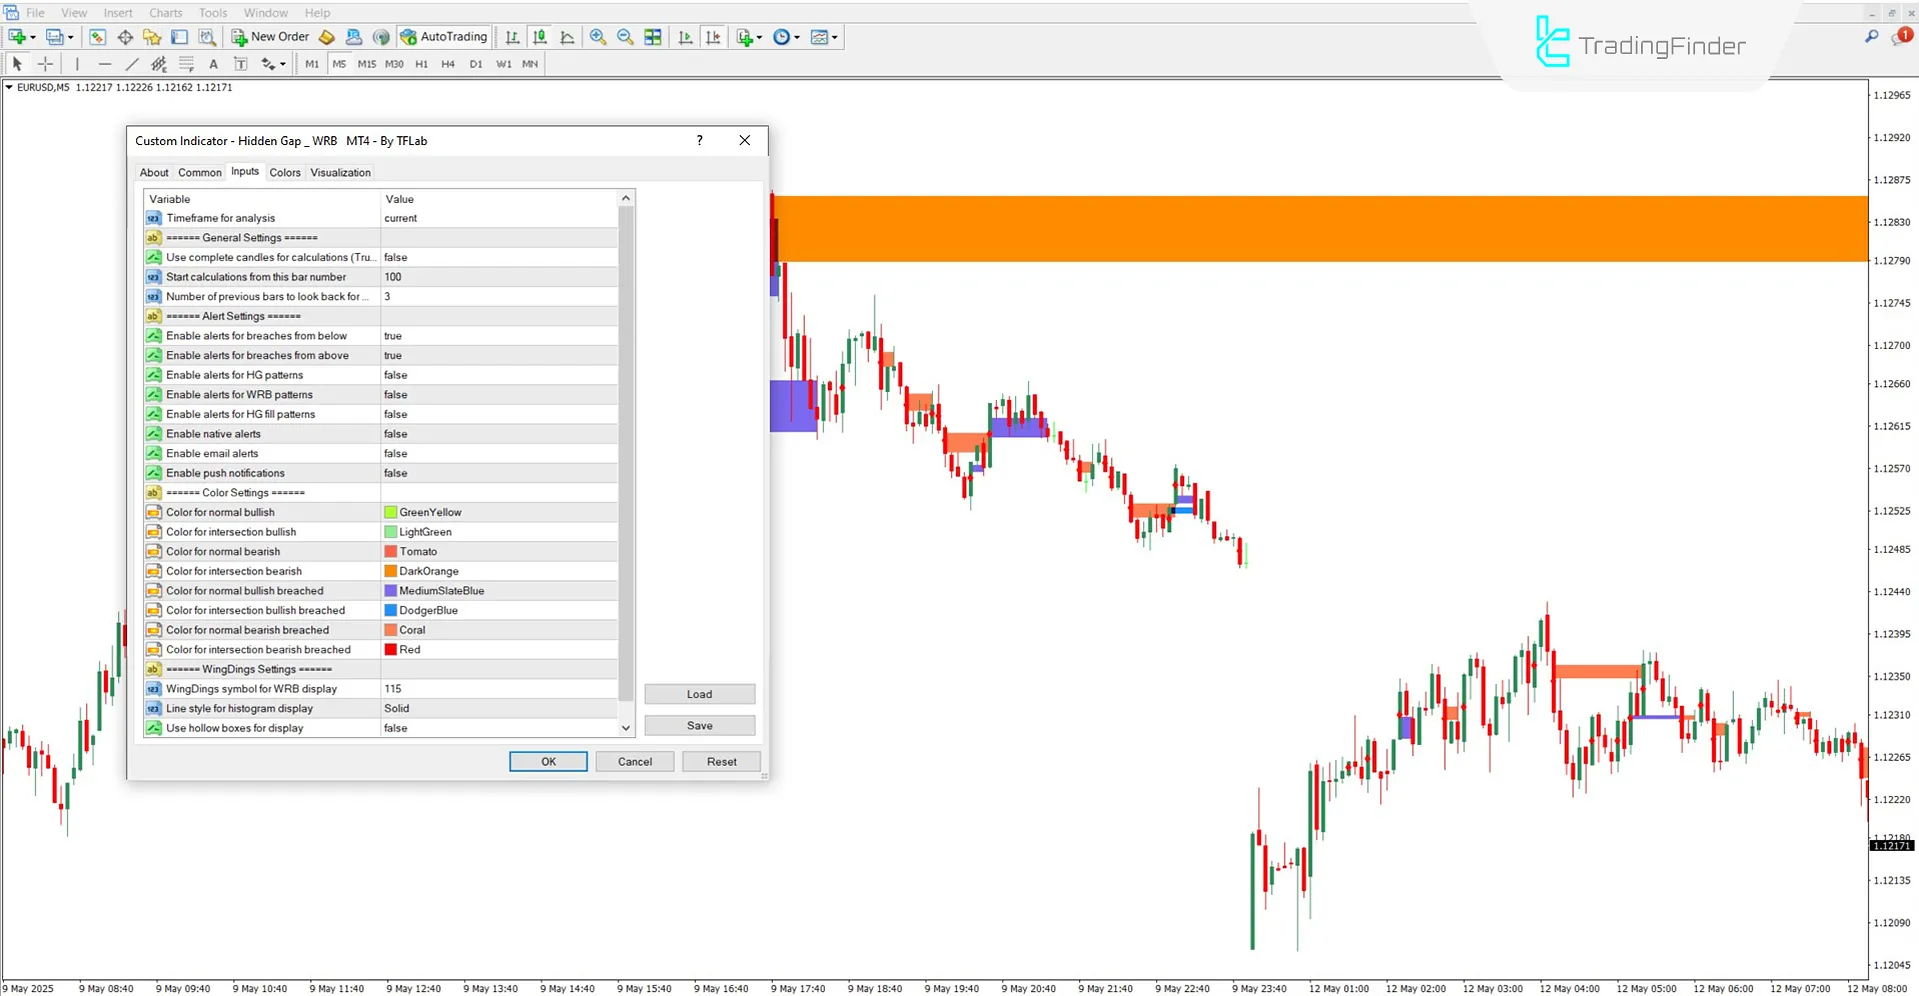
The image below displays the configurable settings of the WRB Hidden Gaps Indicator:

General Setting
- Timeframe for analysis: Define the timeframe for detecting WRB elements
- Use complete candles for calculations: Choose to use a full candle (body + wick)
- Start calculations from this bar number: Set the bar index to begin calculations
- Number of previous bars to look back for WRB comparison: Number of bars to use in WRB comparison logic
Alert Setting
- Enable sound alerts: Turn on sound notifications
- Enable alerts for breaches from below: Alert when the price enters a hidden gap from below
- Enable alerts for breaches from above: Alert when the price enters a hidden gap from above
- Enable alerts for HG patterns: Notify when a new hidden gap is formed
- Enable alerts for WRB patterns: Notify when a new WRB is formed
- Enable alerts for HG fill patterns: Alert when a previously detected hidden gap is filled
- Enable native alerts: Use MetaTrader’s native alert system
- Enable email alerts: Send alerts via email
- Enable push notifications: Push alert notifications to your device
Color Setting
- Color for normal bullish: Color for unfilled bullish hidden gaps
- Color for intersection bullish: Color for unfilled bullish gaps that overlap with previous ones
- Color for normal bearish: Color for unfilled bearish hidden gaps
- Color for intersection bearish: Color for unfilled bearish gaps with overlaps
- Color for normal bullish breached: Color for filled bullish gaps with no overlaps
- Color for the intersection bullish breached: Color for filled bullish gaps with overlaps
- Color for normal bearish breached: Color for filled bearish gaps without overlaps
- Color for intersection bearish breached: Color for filled bearish gaps with overlaps
Wing Dings Setting
- WingDings symbol for WRB display: Symbol code for displaying WRBs as graphic icons
- Line style for histogram display: Style of line for drawing HG boxes
- Use hollow boxes for display: Display boxes as hollow rectangles
Conclusion
The Hidden Gap WRB Indicator is designed to identify hidden supply and demand zones and draw key support and resistance levels.
By detecting Wide Range Bars and analyzing gaps formed between them, this tool highlights hidden gaps directly on the chart. These graphical elements serve as key price reaction zones.
Hidden Gap WRB MT4 PDF
Hidden Gap WRB MT4 PDF
Click to download Hidden Gap WRB MT4 PDFWhat does WRB stand for?
WRB stands for Wide Range Bar, a candlestick whose range is significantly larger than preceding bars.
What is the main use of the Hidden Gap WRB Indicator?
The main function of this indicator is to identify hidden gaps and visually mark potential supply and demand zones.


