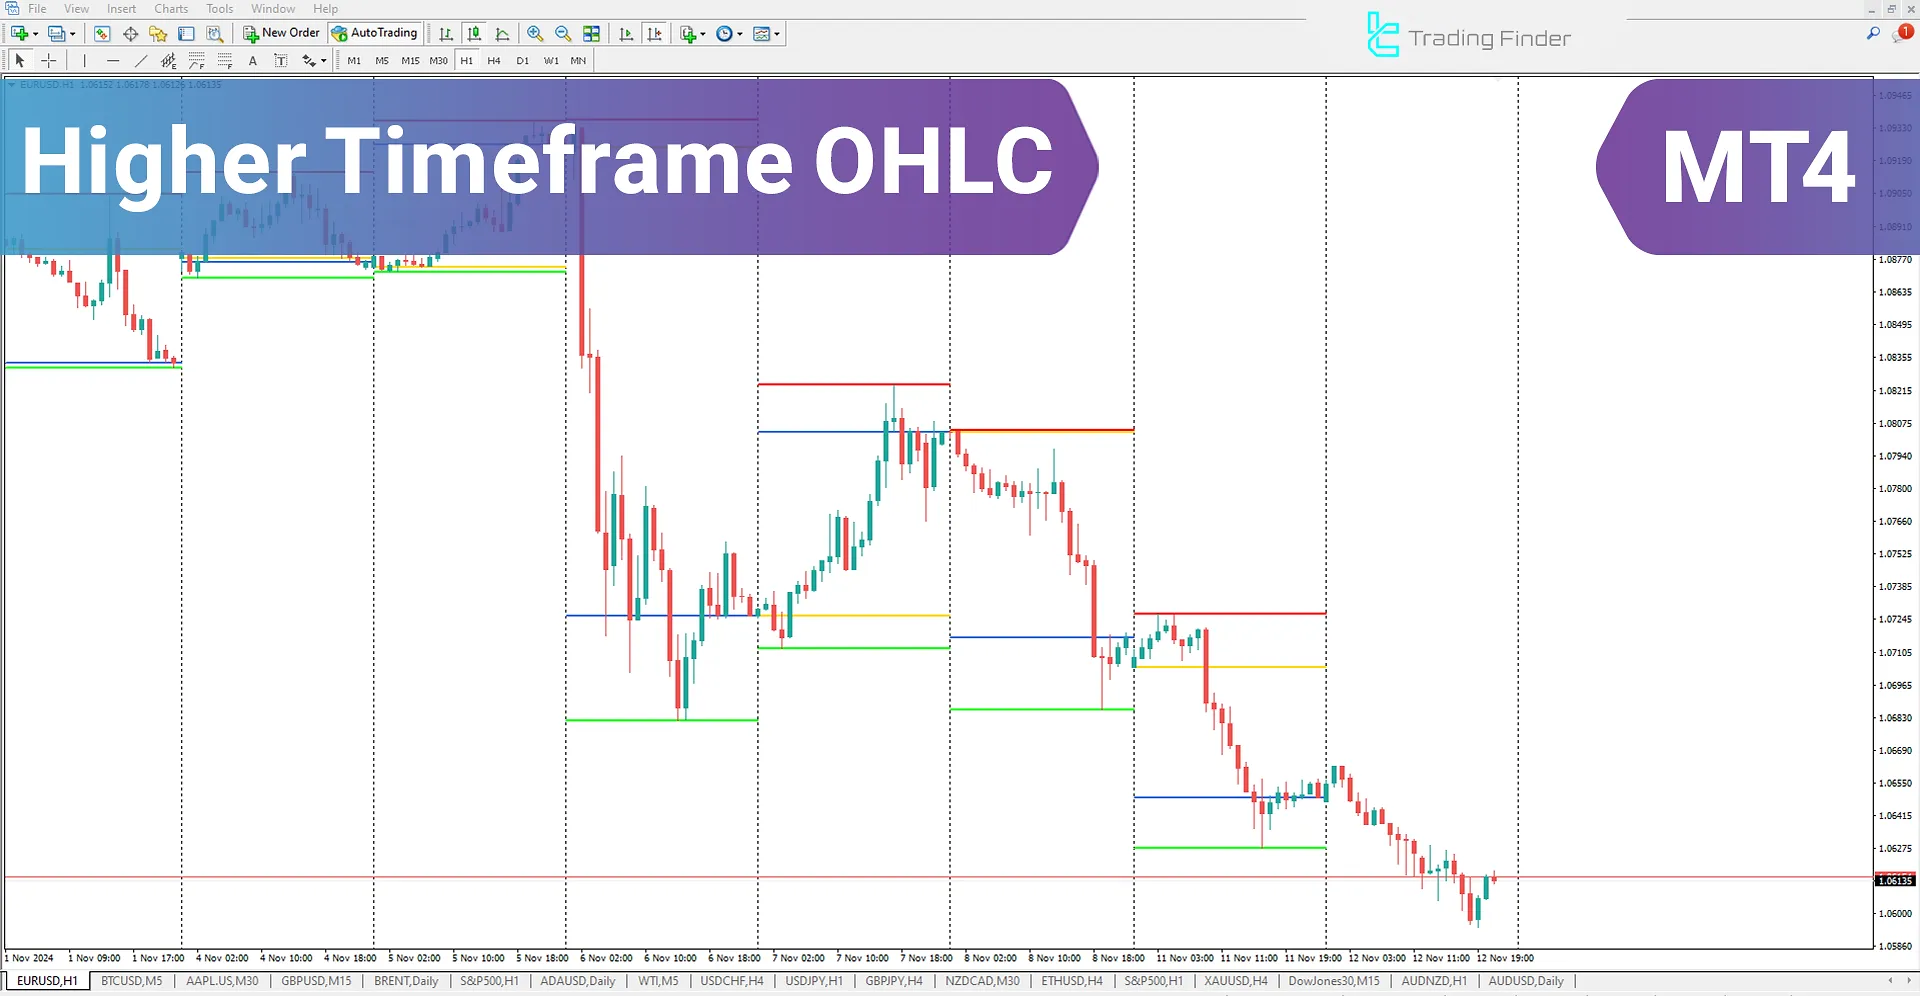


The Higher Timeframe OHLC indicator is valuable for analyzing the current and previous candles. Developed for the MetaTrader 4 (MT4) platform, it allows traders to view the status of candles from a higher timeframe within their current timeframe.
With these Trading Tools, traders can easily see the open, high, low, and close prices of higher timeframe candles on the current chart, enabling more comprehensive analysis and better decision-making.
Indicator Table
Indicator Categories: | Trading Assist MT4 Indicators Candle Sticks MT4 Indicators Levels MT4 Indicators |
Platforms: | MetaTrader 4 Indicators |
Trading Skills: | Elementary |
Indicator Types: | Leading MT4 Indicators Entry and Exit MT4 Indicators Non-Repainting MT4 Indicators |
Timeframe: | Multi-Timeframe MT4 Indicators |
Trading Style: | Day Trading MT4 Indicators Intraday MT4 Indicators Scalper MT4 Indicators |
Trading Instruments: | Indices Market MT4 Indicators Cryptocurrency MT4 Indicators Forex MT4 Indicators |
Indicator at a Glance
The Higher Timeframe OHLC Indicator is a practical tool for traders who wish to analyze multiple timeframes.
This tool displays the status of candles within the current timeframe, helping traders better understand the market by identifying the candles in the higher timeframes: open, closed, high, and low prices.
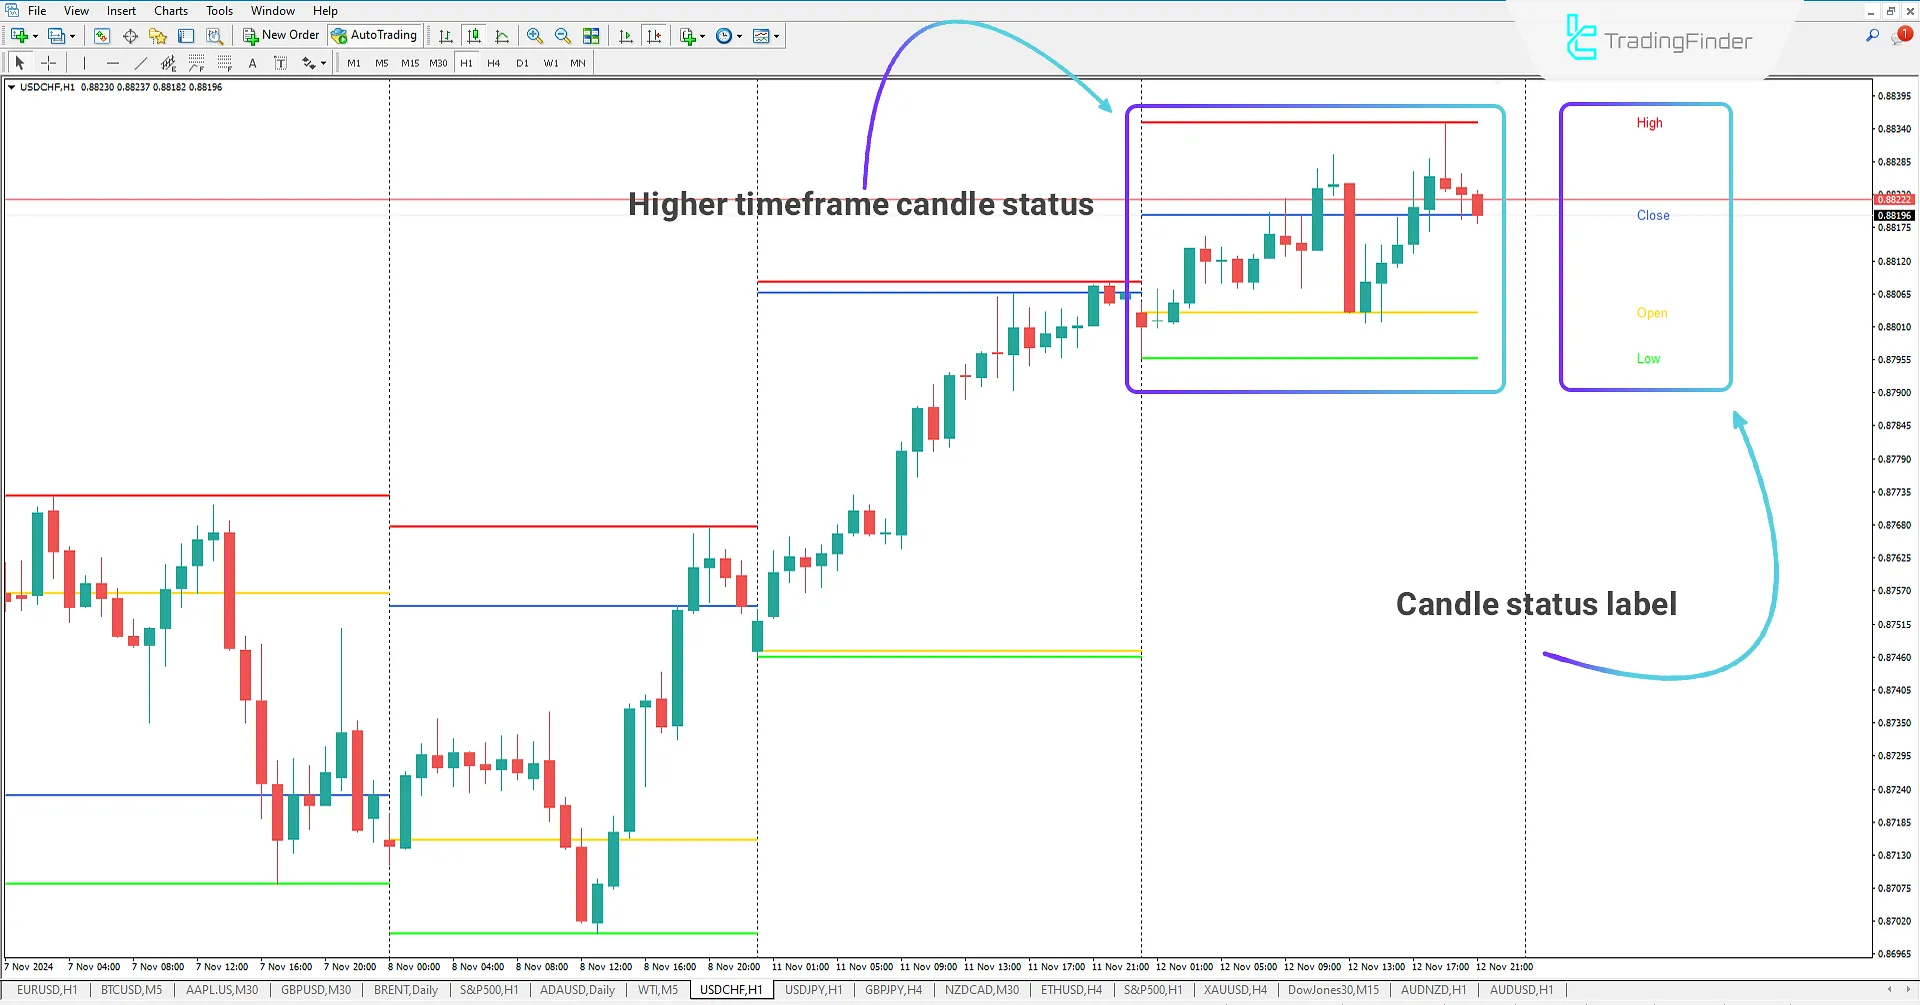
Bullish Candle in Indicator

The price is in an uptrend in the USD/CHF 1-hour chart. The Higher Timeframe OHLC indicator displays four lines on the chart, showing the critical levels of the higher timeframe candle, including the open, high, low, and close prices.
These lines help traders identify necessary support and resistance levels from the higher timeframe on the current chart, allowing them to analyze trends and key points with greater precision.
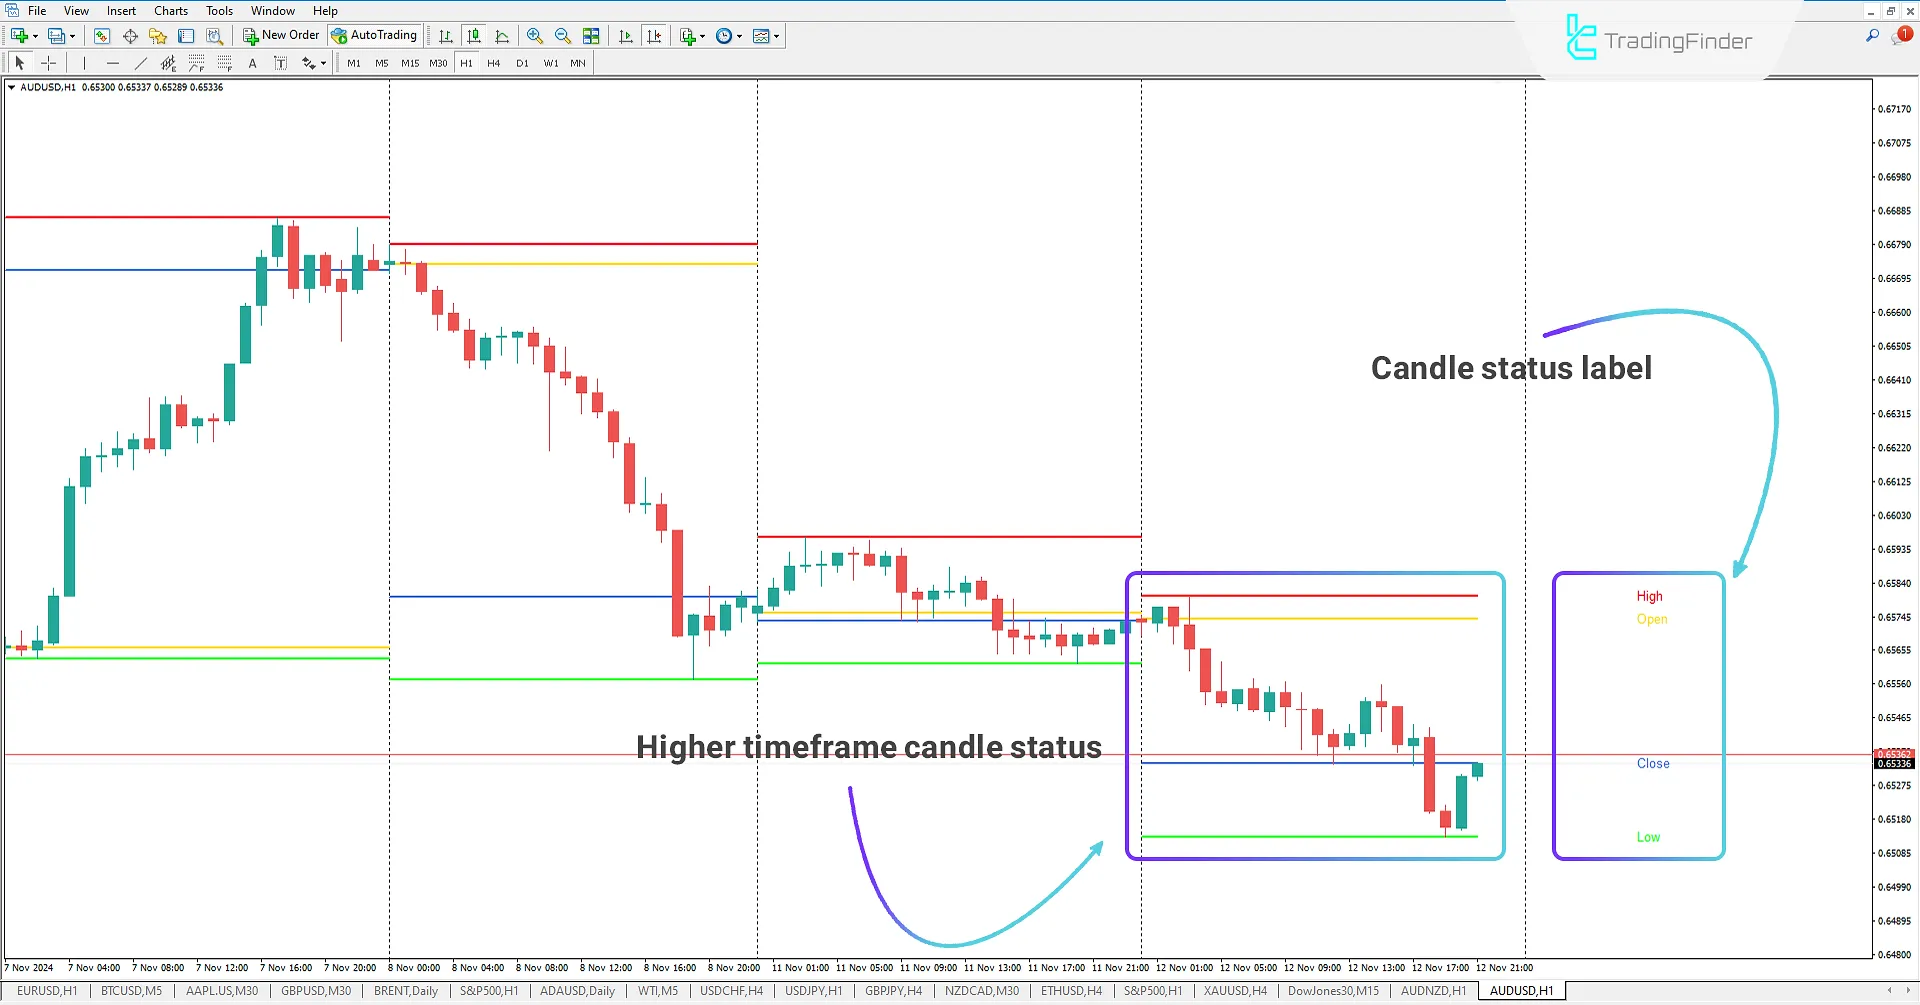
Bearish Candle in Indicator

In the AUD/USD 1-hour chart, the Higher Timeframe OHLC indicator displays four lines representing the higher timeframe candle's open, high, low, and close prices, helping traders identify key price levels and make better trading decisions.
The indicator uses labels to specify these lines, which is beneficial for more accurate analysis and determination of significant support and resistance levels.
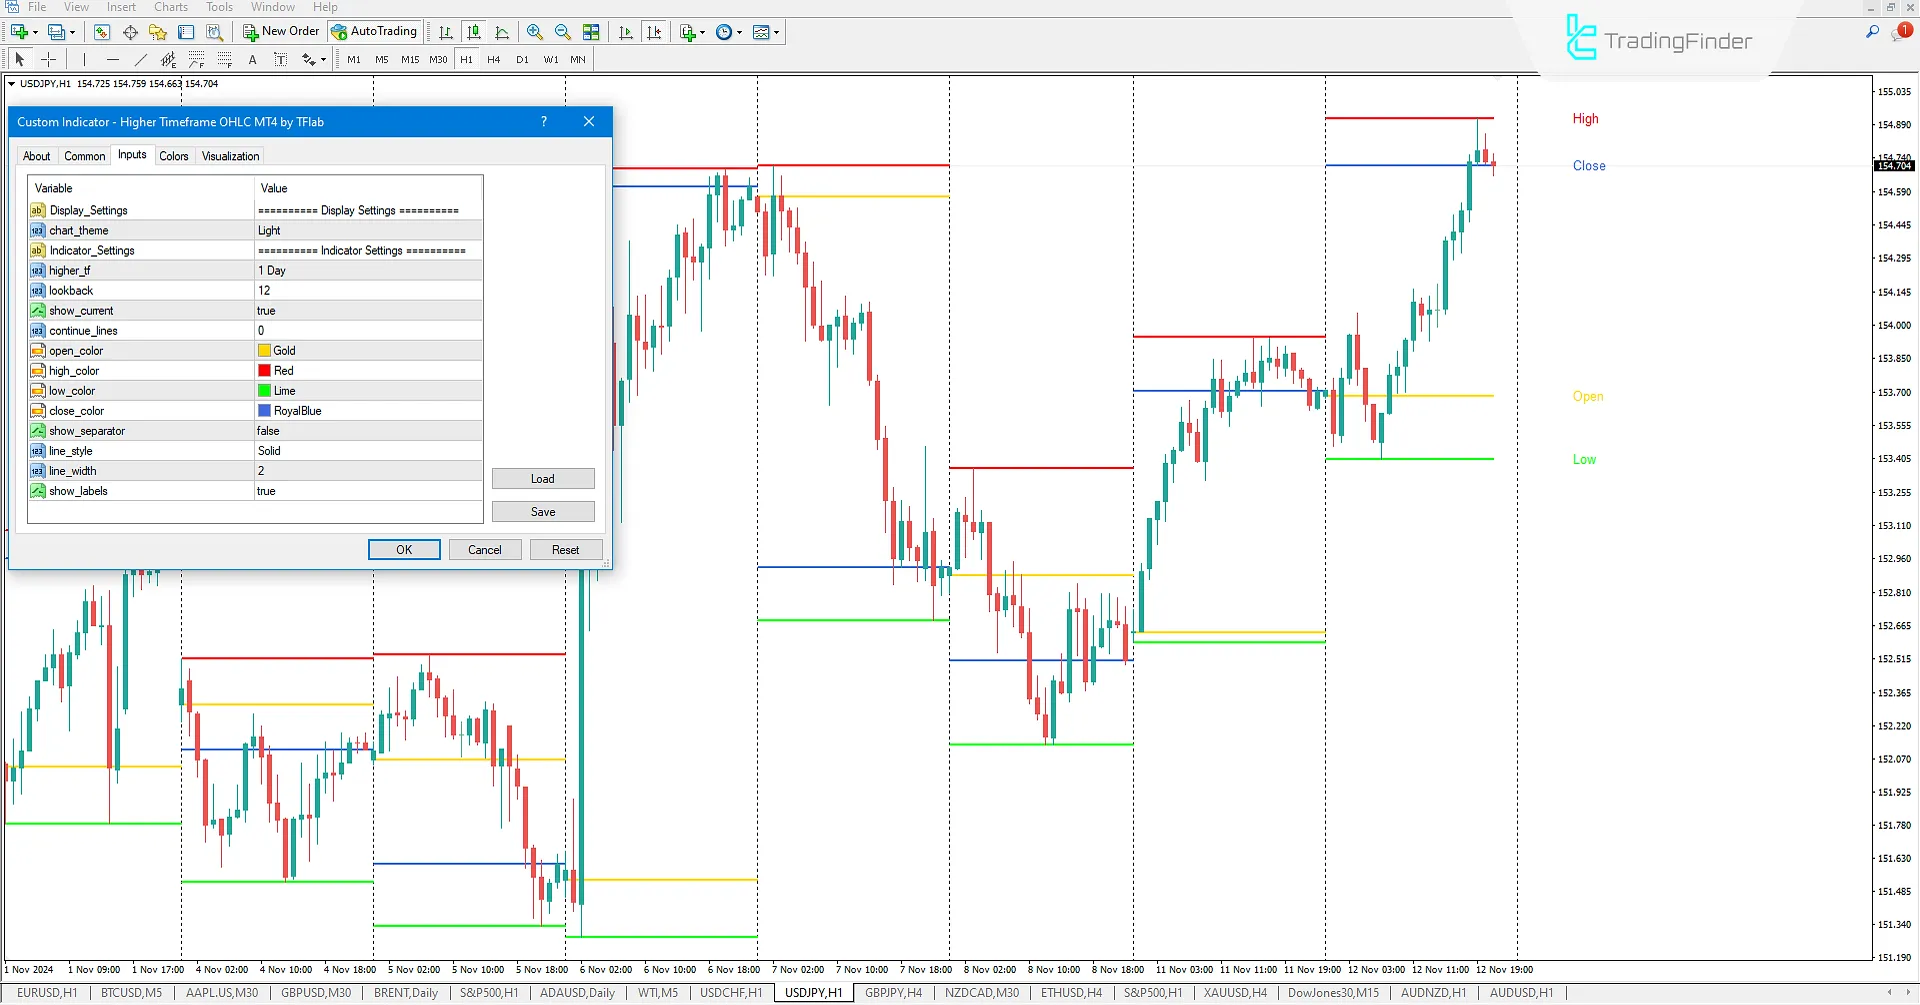
Indicator Settings

Display_Settings
- Chart_theme: Select a custom theme for the indicator;
Indicator_Settings
- Higher_tf: Choose The Higher Timeframe;
- Lookback: Display The Number Of Past Candles;
- Show_current: Show The Current Candle;
- Continue_lines: Draw Lines Forward From The Current Candle (Based On The Candle);
- Open_color: Set Open Price Line Color;
- High_color: Set High Price Line Color;
- Low_color: Set Low Price Line Color;
- Close_color: Set Close Price Line Color;
- Show_separator: Toggle Separator Between Each Candle;
- Line_style: Choose Line Style;
- Line_width: Set Line Width;
- Show_labels: Toggle Labels Display.
Conclusion
The Higher Timeframe OHLC indicator is a practical tool for multi-timeframe analysis, allowing traders to view the open, high, low, and close prices of higher timeframe candles on the current timeframe.
This MetaTrader 4 indicator draws four main lines to clearly show the critical levels of the higher timeframe candle, aiding traders in making more accurate decisions and analyzing price trends effectively.
Higher Timeframe OHLC MT4 PDF
Higher Timeframe OHLC MT4 PDF
Click to download Higher Timeframe OHLC MT4 PDFWhat is the Higher Timeframe OHLC indicator?
The Higher Timeframe OHLC indicator displays the open, high, low, and close prices of candles from higher timeframes within the current timeframe without needing to switch timeframes, helping traders gain a comprehensive view of the overall market trend.
Who is the Higher Timeframe OHLC indicator suitable for?
This indicator is especially ideal for traders who use fractal and multi-timeframe analyses. It enables traders to understand market trends better and perform more precise analyses.


