![HighLow Custom Indicator for MetaTrader 4 – Free Download [TradingFinder]](https://cdn.tradingfinder.com/image/543929/2-146-en-high-low-custom-mt4-1.webp)
![HighLow Custom Indicator for MetaTrader 4 – Free Download [TradingFinder] 0](https://cdn.tradingfinder.com/image/543929/2-146-en-high-low-custom-mt4-1.webp)
![HighLow Custom Indicator for MetaTrader 4 – Free Download [TradingFinder] 1](https://cdn.tradingfinder.com/image/543930/2-146-en-high-low-custom-mt4-2.webp)
![HighLow Custom Indicator for MetaTrader 4 – Free Download [TradingFinder] 2](https://cdn.tradingfinder.com/image/543935/2-146-en-high-low-custom-mt4-3.webp)
![HighLow Custom Indicator for MetaTrader 4 – Free Download [TradingFinder] 3](https://cdn.tradingfinder.com/image/543934/2-146-en-high-low-custom-mt4-4.webp)
The HighLow Custom Indicator is a technical analysis tool based on price highs and lows, allowing traders to closely examine market behavior at key levels.
This indicator focuses on identifying reversal zones and breakout points, using three analytical bands to achieve this.
HighLow Custom Indicator Table
The general features of the HighLow Custom Indicator are presented in the table below.
Indicator Categories: | Support & Resistance MT4 Indicators Trading Assist MT4 Indicators Bands & Channels MT4 Indicators |
Platforms: | MetaTrader 4 Indicators |
Trading Skills: | Elementary |
Indicator Types: | Breakout MT4 Indicators Reversal MT4 Indicators |
Timeframe: | Multi-Timeframe MT4 Indicators |
Trading Style: | Intraday MT4 Indicators |
Trading Instruments: | Stock Market MT4 Indicators Cryptocurrency MT4 Indicators Forex MT4 Indicators |
HighLow Custom Indicator at a Glance
The HighLow Custom Indicator is composed of three main bands, each playing a specific role in analyzing price behavior:
- Upper Band: Connecting market highs, acting as dynamic resistance, and showing selling pressure in the ceiling zone;
- Lower Band: Connecting market lows, acting as dynamic support, reflecting demand strength and buyers’ presence at market lows;
- Middle Band: The average of price highs and lows, defining the market’s equilibrium level.
Indicator in an Uptrend
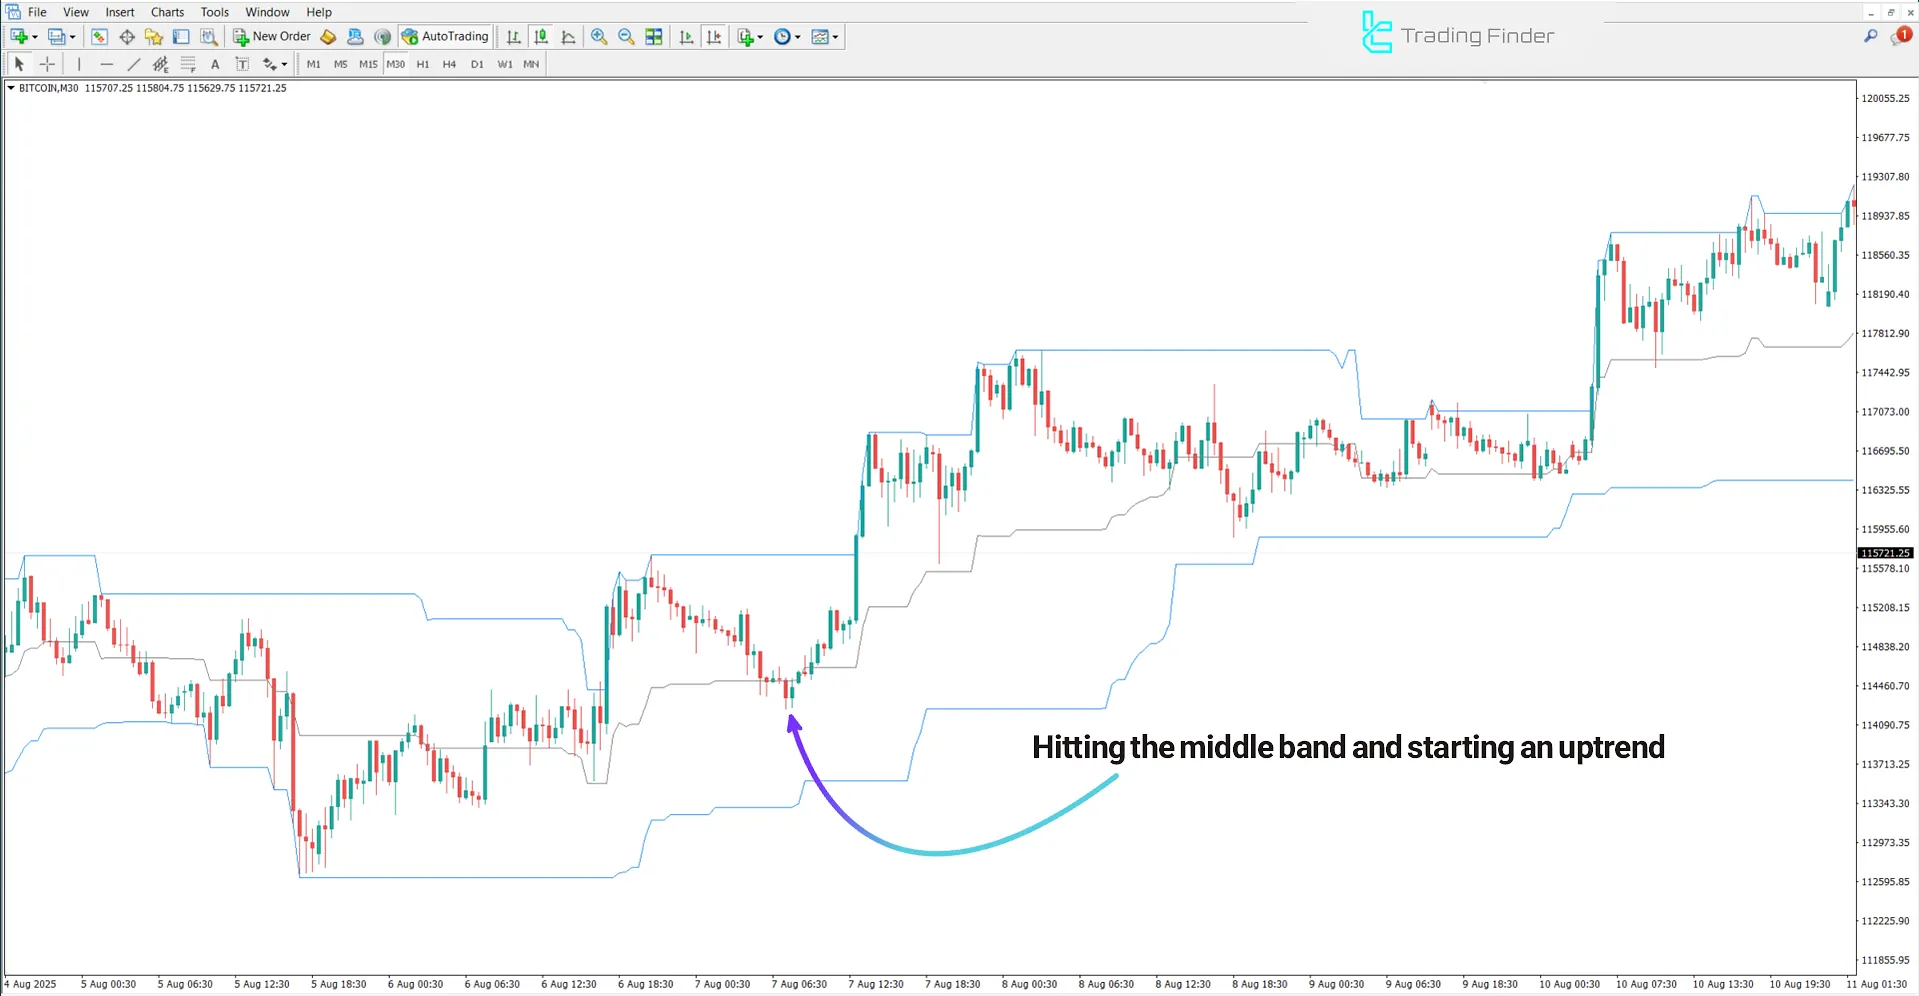
The chart below shows the Bitcoin index (BTC/USD) in the 30-minute timeframe. In this trading tool, the positive price reaction to the lower band and its stabilization above the middle band indicates strengthening buying power and defines a suitable area for entering buy trades.

Indicator in a Downtrend
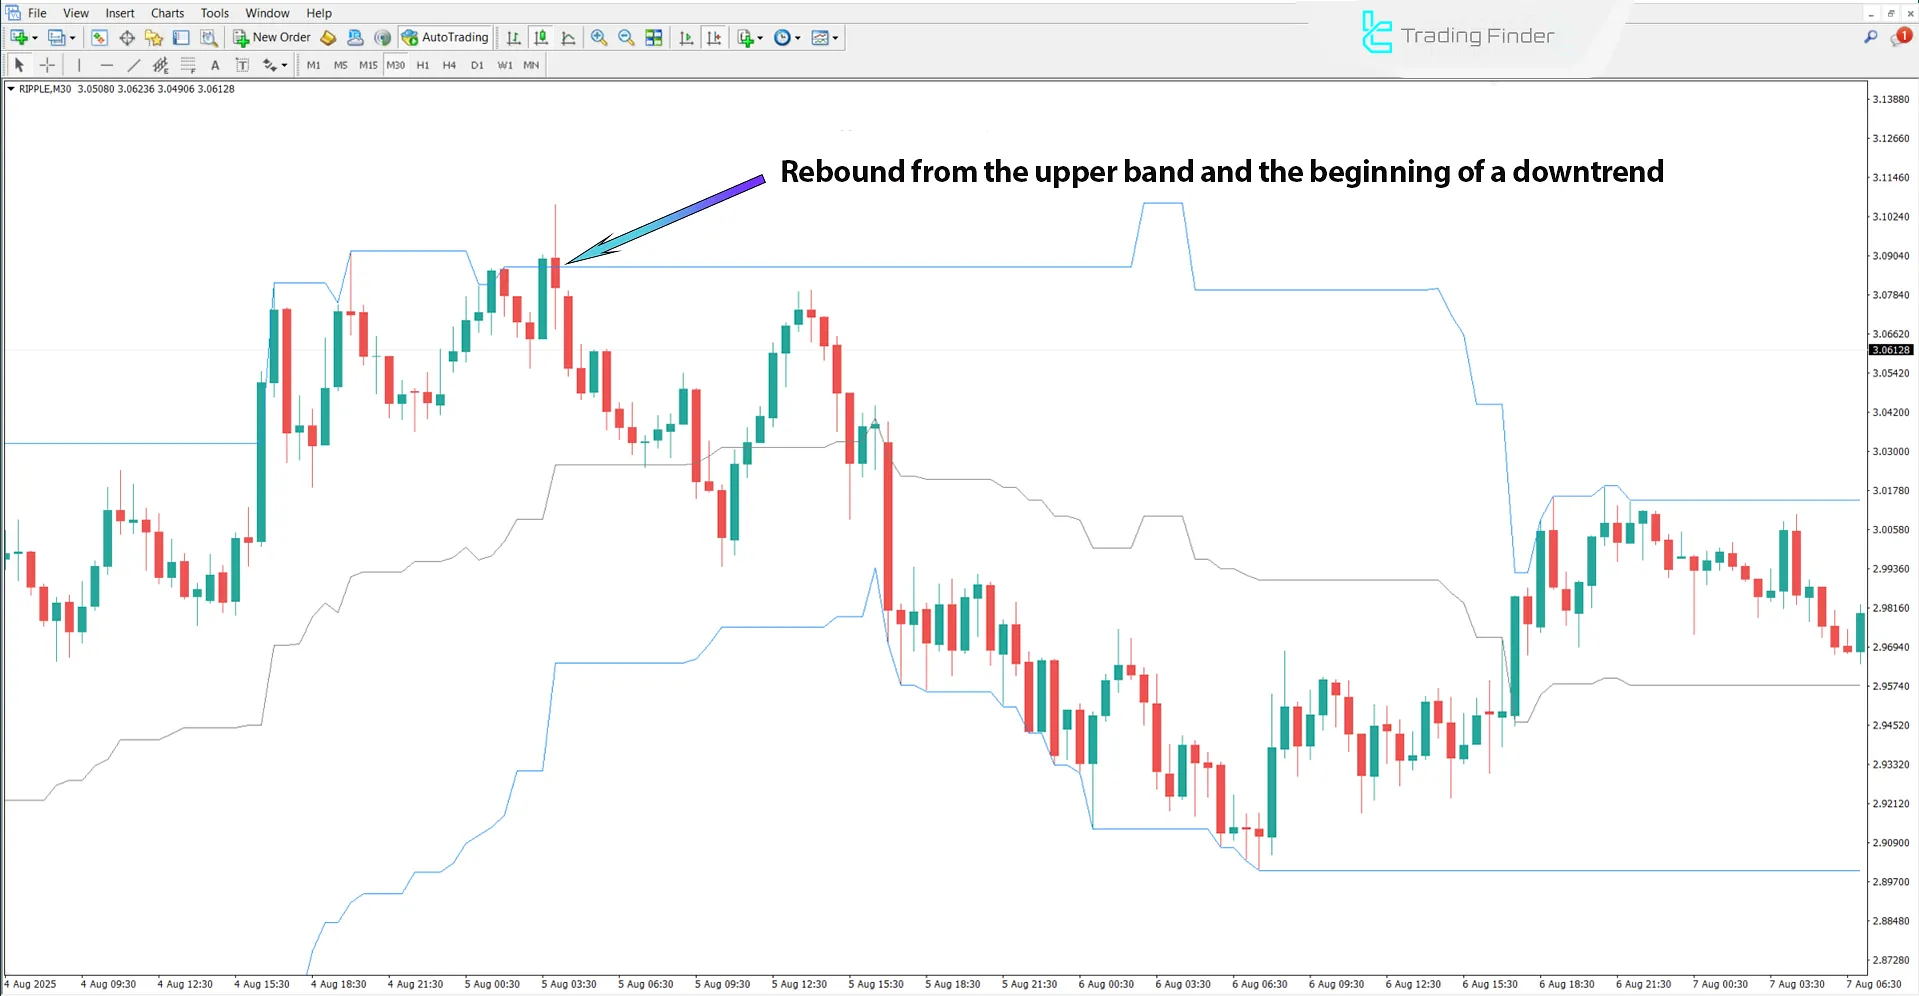
The chart below shows the Ripple index in the 30-minute timeframe. In a downtrend, when price touches the upper band, it is usually accompanied by selling pressure, preventing further upward movement.
The price crossing and stabilizing below the middle band is considered a sign of sellers’ dominance and confirmation of the continuation of the downtrend.

HighLow Custom Indicator Settings
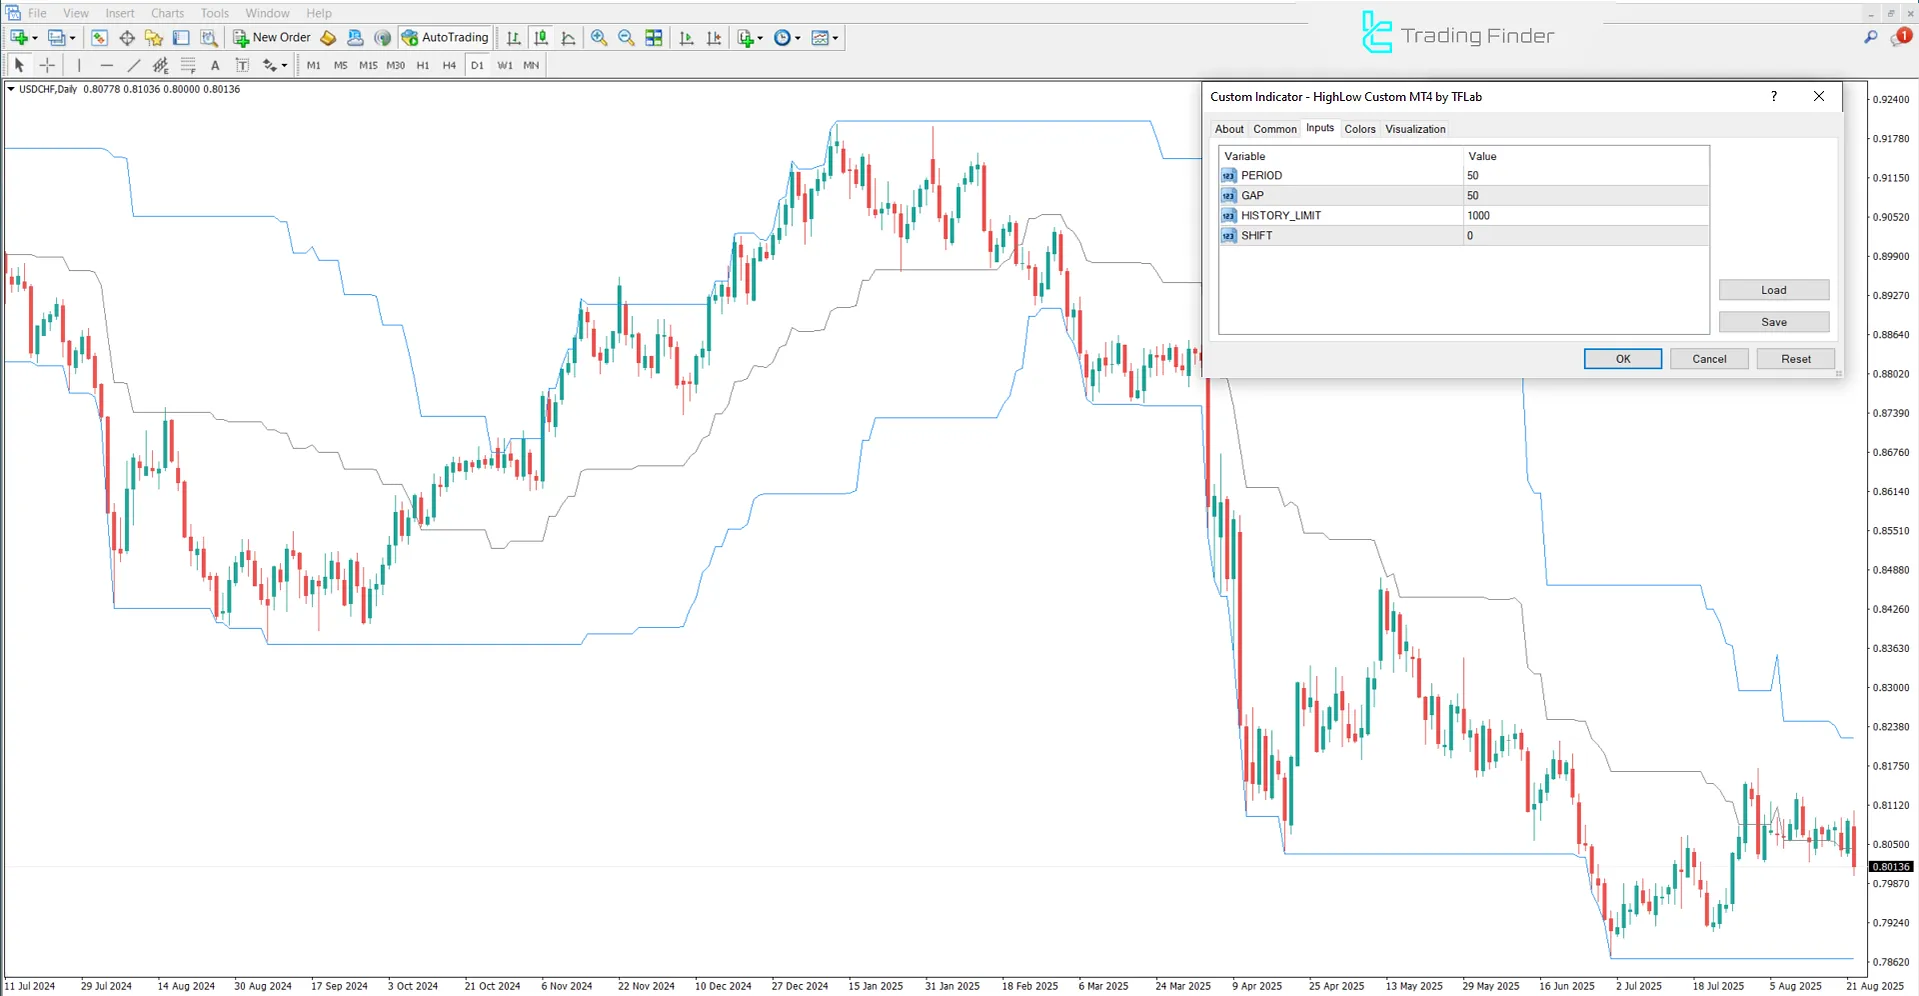
The image below shows the settings panel of the HighLow Custom Indicator in the MetaTrader 4 platform:

- PERIOD: Calculation period value
- GAP: Adjustable distance or gap between bands
- HISTORY_LIMIT: Maximum number of candles to analyze past data
- SHIFT: Amount of shift
Conclusion
The HighLow Custom Indicator is one of the important tools in technical analysis, designed to identify dynamic support and resistance zones, evaluate price movements, and analyze trend structure.
By connecting recent market highs and lows, this indicator provides a precise framework for understanding price behavior.
HighLow Custom Indicator MetaTrader 4 PDF
HighLow Custom Indicator MetaTrader 4 PDF
Click to download HighLow Custom Indicator MetaTrader 4 PDFWhat is the purpose of the HighLow Custom Indicator?
This indicator is designed to identify dynamic support and resistance based on highs and lows, allowing analysis of bullish, bearish, and ranging trends.
What is the role of the middle band in the HighLow Custom Indicator?
In this trading tool, the middle band represents the average of highs and lows and acts as the price equilibrium level. Price crossing above it indicates buyer strength, while crossing below indicates seller strength.


