


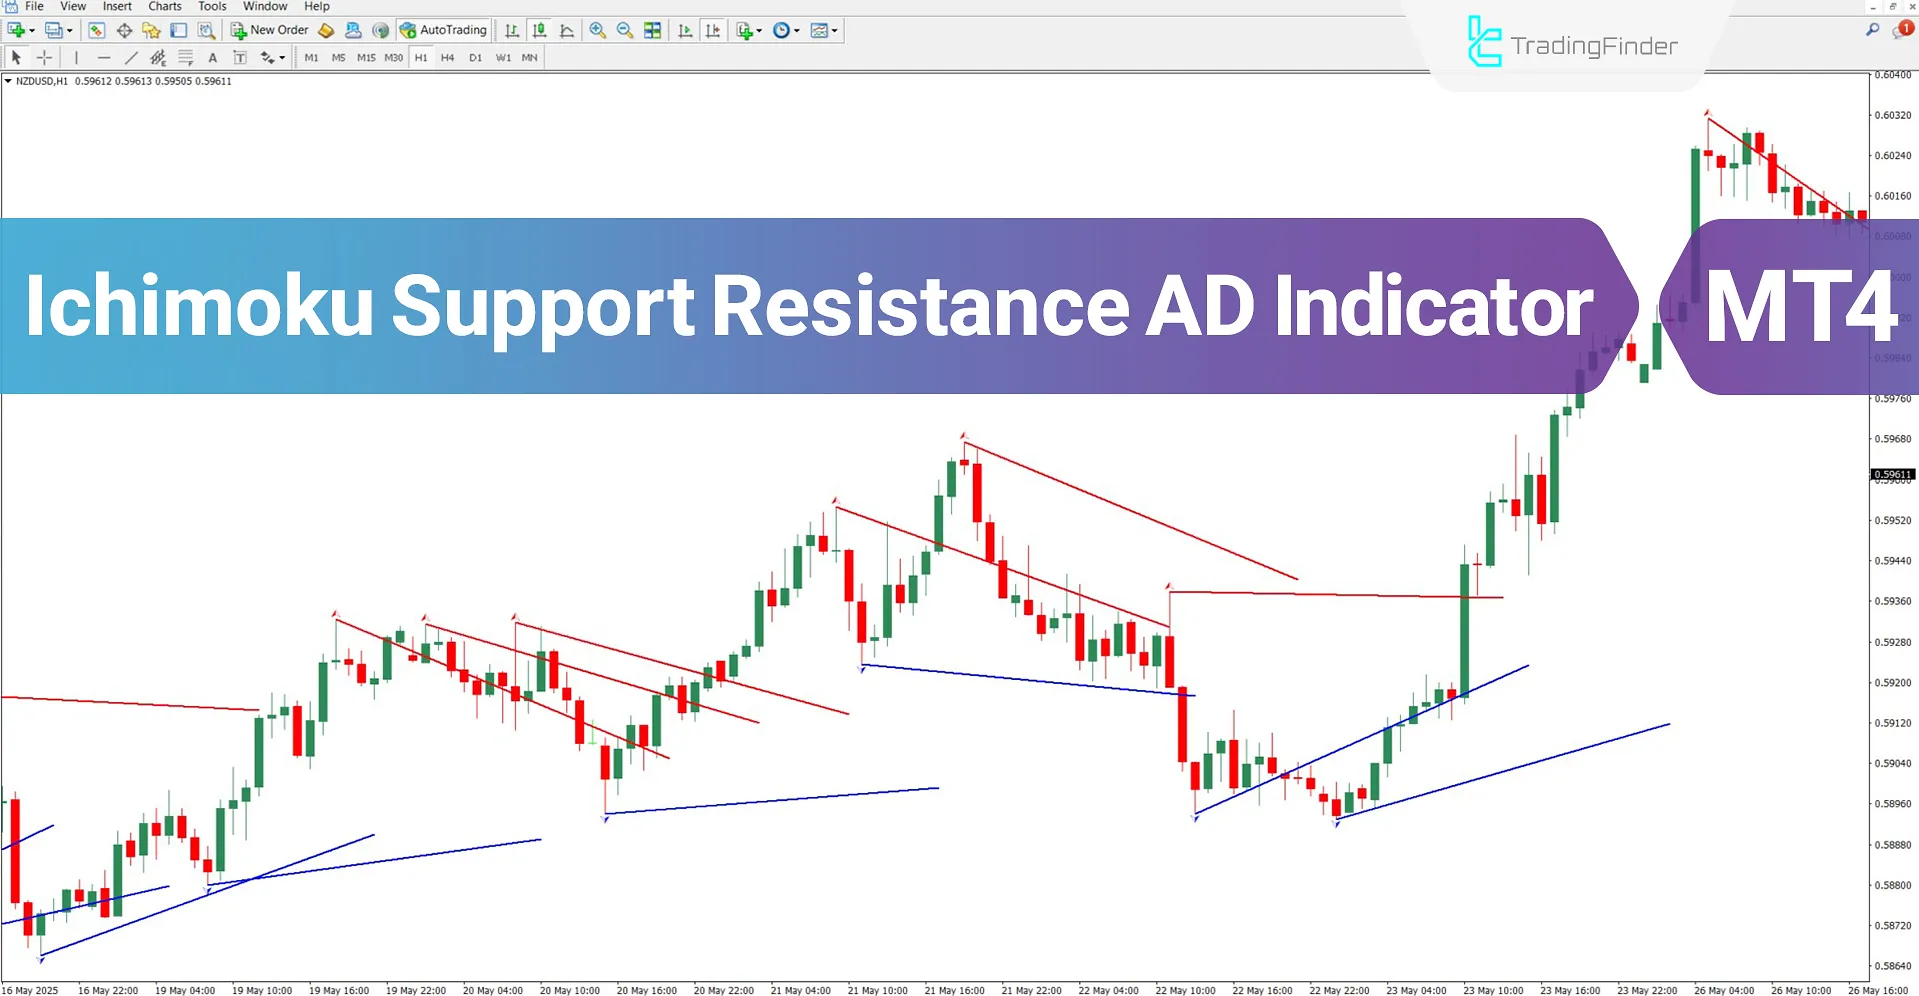
The Ichimoku Support Resistance AD Indicator combines two powerful technical analysis concepts the Ichimoku system and fractals to accurately identify support and resistance levels.
This trading tool automatically plots support levels in blue and resistance levels in red on the chart. One of its key features is the ability to visually display fractal points using on-chart markers.
Ichimoku Support Resistance AD Indicator Specifications Table
The specifications of theIchimoku Support Resistance AD Indicator are listed in the table below:
Indicator Categories: | Support & Resistance MT4 Indicators Trading Assist MT4 Indicators Levels MT4 Indicators |
Platforms: | MetaTrader 4 Indicators |
Trading Skills: | Elementary |
Indicator Types: | Reversal MT4 Indicators |
Timeframe: | Multi-Timeframe MT4 Indicators |
Trading Style: | Day Trading MT4 Indicators Scalper MT4 Indicators Swing Trading MT4 Indicators |
Trading Instruments: | Share Stocks MT4 Indicators Indices Market MT4 Indicators Commodity Market MT4 Indicators Stock Market MT4 Indicators Cryptocurrency MT4 Indicators Forex MT4 Indicators |
Ichimoku Support Resistance AD at a Glance
The Ichimoku Support Resistance AD Indicator uses Ichimoku to detect the overall trend direction and fractals to identify potential pricereversalzones, giving traders a well-rounded view of the market.
When support or resistance levels break in the direction of the prevailing trend, this presents potential trade entry opportunities.
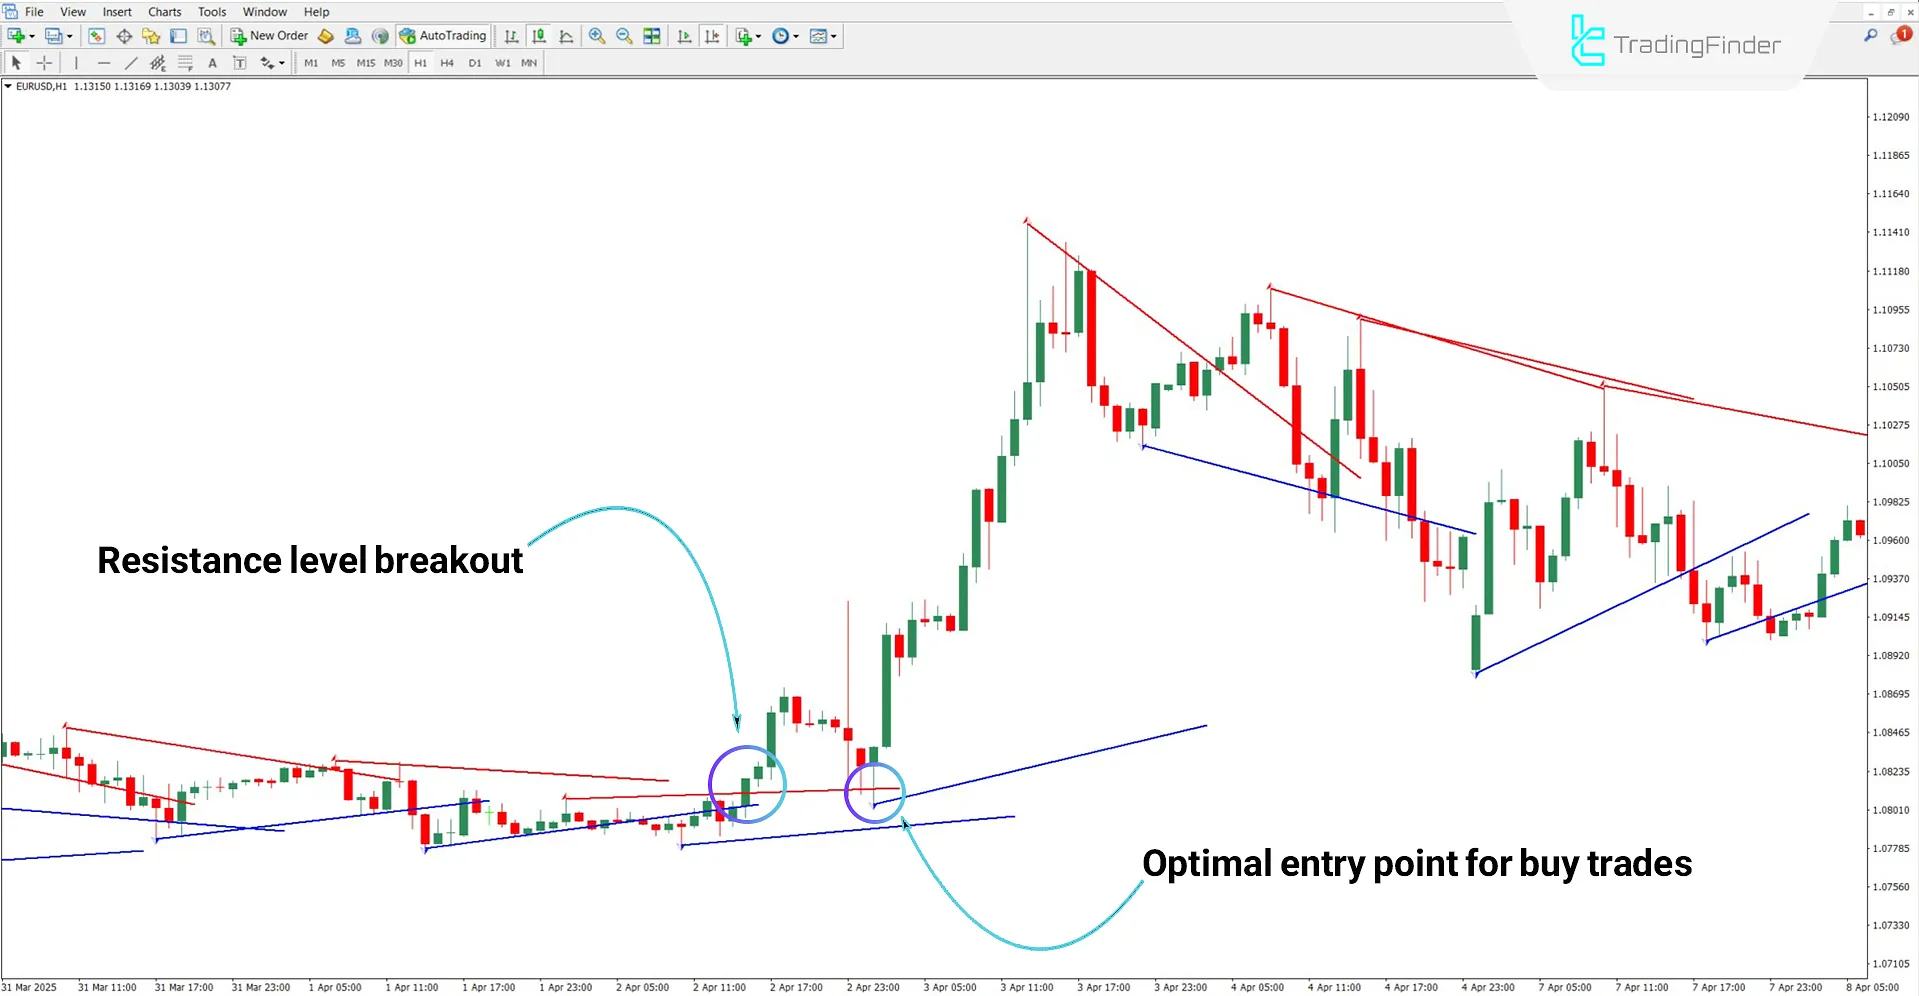
Bullish Trend Analysis
According to the EUR/USD 1-hour chart analysis, the bullish trend starts after the resistance zone (red line) is broken.
The area highlighted by a blue circle marks a price pullbackzone, representing a suitable entry point for buy trades.
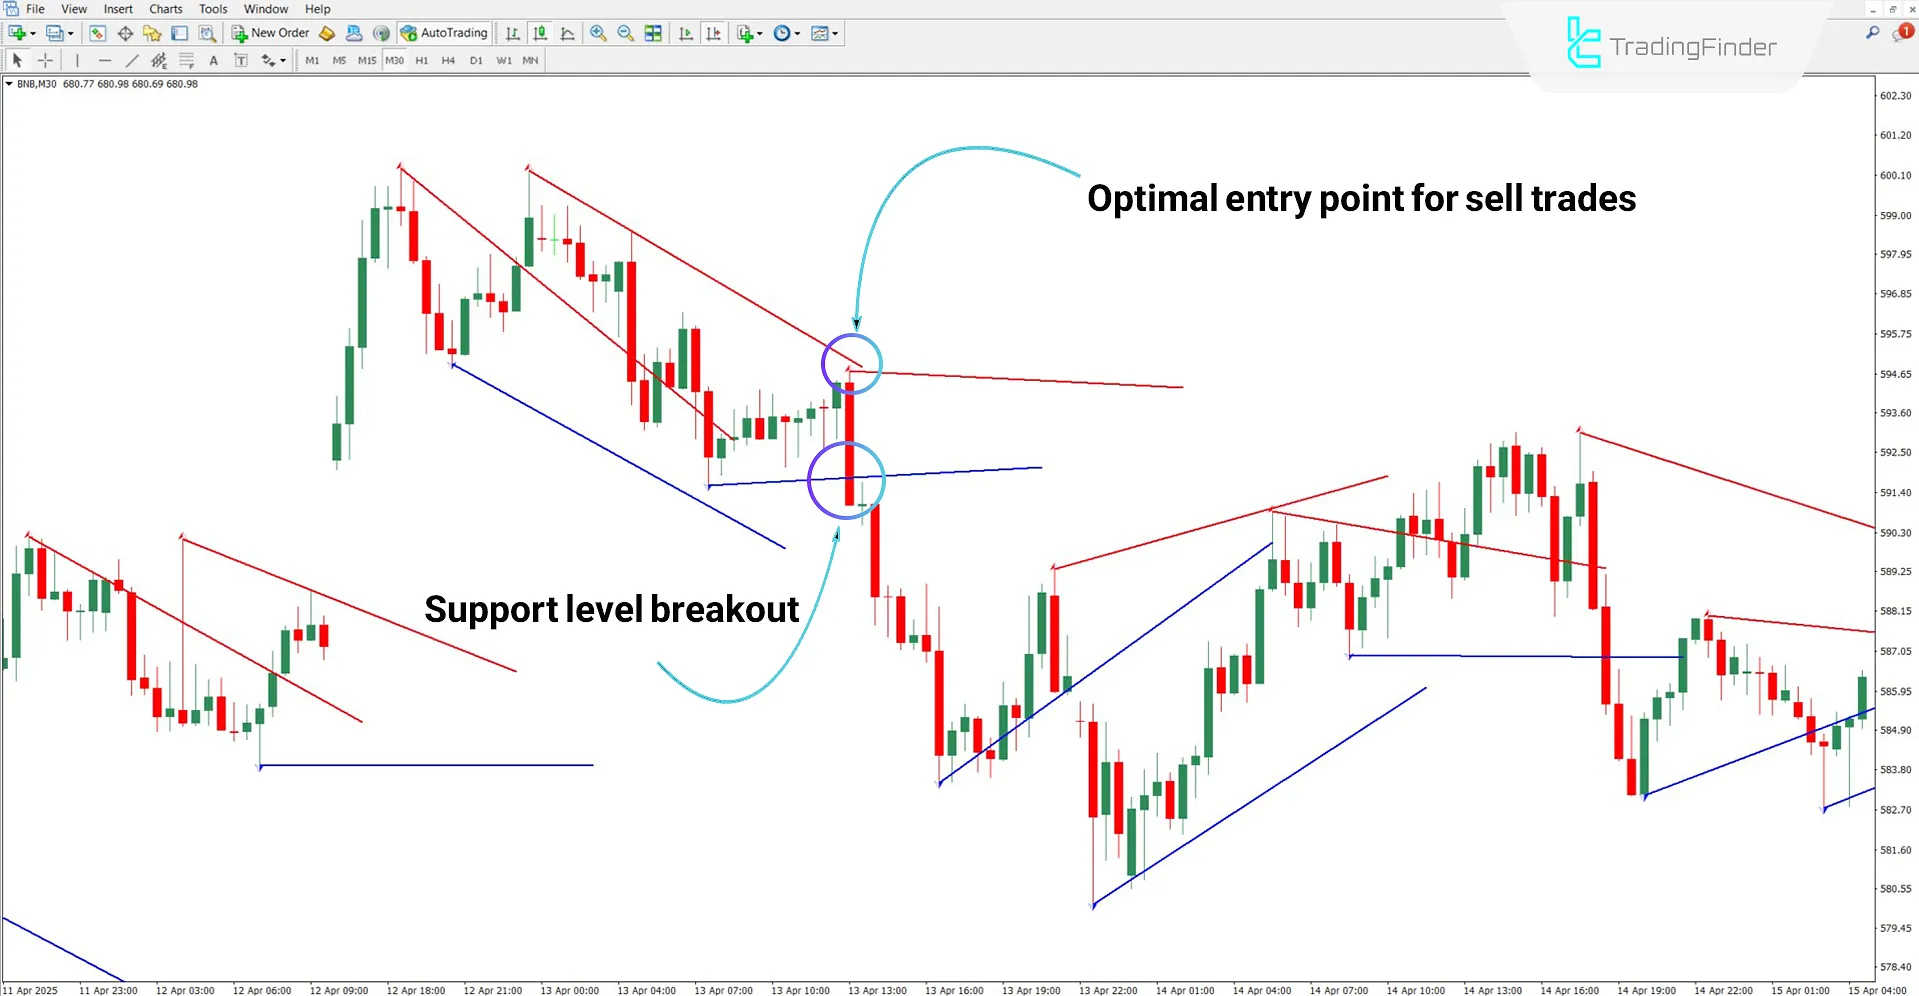
Bearish Trend Analysis
Based on the30-minute BNB (Binance Coin) chart, the price breaks the support level directly with momentum and continues in a downward trend without a pullback.
Such strong breakouts, accompanied by large bearish candles and high selling volume, may serve as reliable signals for entering short trades.
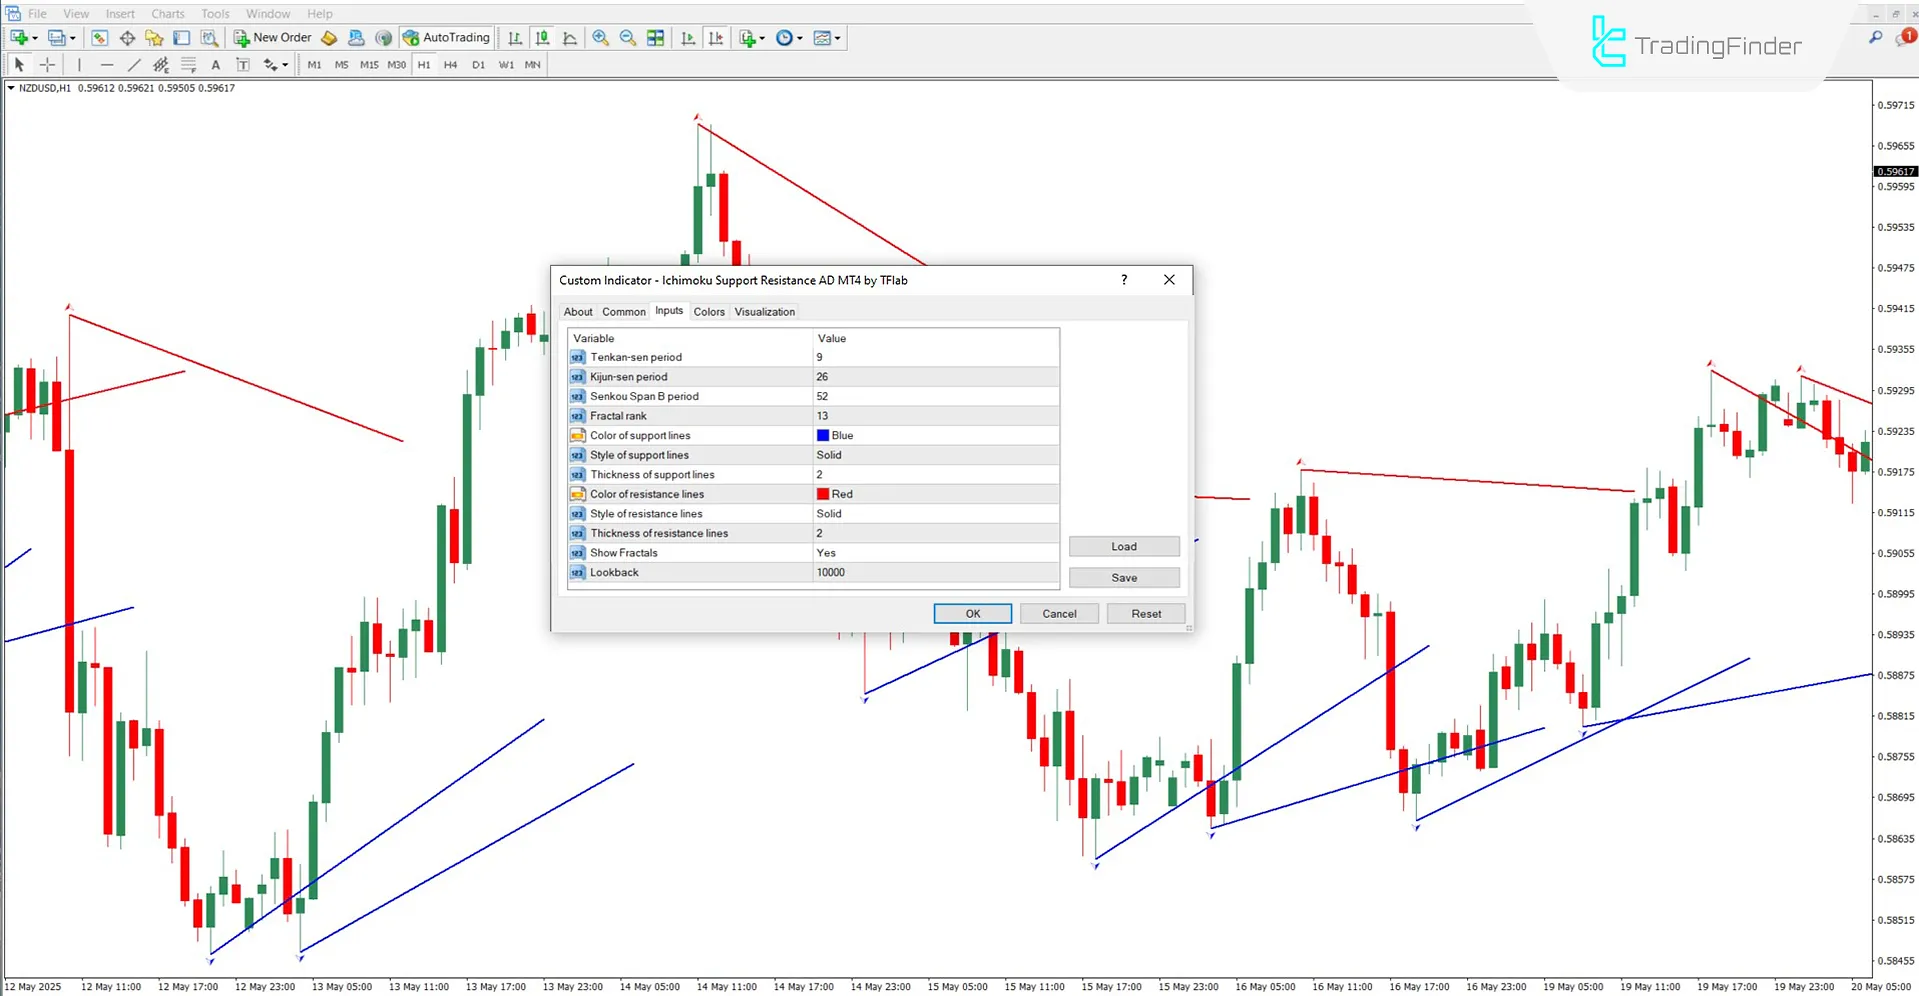
Ichimoku Support Resistance AD Indicator Settings
The following are the adjustable parameters of the Ichimoku Support Resistance AD Indicator:
- Tenkan-sen period: Calculation period for the Tenkan-sen line
- Kijun-sen period: Calculation period for the Kijun-sen line
- Senkou Span B period: Calculation period for the Senkou Span B line
- Fractal rank: Sensitivity level for fractal detection
- Color of support lines: Color for support levels on the chart
- Style of support lines: Line style for support
- Thickness of support lines: Thickness of support lines
- Color of resistance lines: Color for resistance levels on the chart
- Style of resistance lines: Line style for resistance
- Thickness of resistance lines: Thickness of resistance lines
- Show Fractals: Enable or disable fractal display
- Lookback: Number of previous candles used for calculation
Conclusion
TheIchimoku Support Resistance AD Indicator combines the Ichimoku system with fractal logic to precisely draw support and resistance levels directly on the chart.
In trending conditions, this trading toolenables the identification of optimal entry points for traders, making it especially useful for day trading and scalping.
Its flexible settings make it adaptable to a variety of trading strategies.
Ichimoku Support Resistance AD MT4 PDF
Ichimoku Support Resistance AD MT4 PDF
Click to download Ichimoku Support Resistance AD MT4 PDFWhich markets is this indicator suitable for?
This indicator is compatible with all markets.
Does the Ichimoku Support Resistance AD Indicator generate buy/sell signals?
No, this indicator does not generate any direct trade signals.


