![ICT 2022 Mentorship Trading Model Indicator MT4 Download – Free – [TFlab]](https://cdn.tradingfinder.com/image/461827/13-167-en-ict-2022-mentorship-trading-model-mt4-01.webp)
![ICT 2022 Mentorship Trading Model Indicator MT4 Download – Free – [TFlab] 0](https://cdn.tradingfinder.com/image/461827/13-167-en-ict-2022-mentorship-trading-model-mt4-01.webp)
![ICT 2022 Mentorship Trading Model Indicator MT4 Download – Free – [TFlab] 1](https://cdn.tradingfinder.com/image/461826/13-167-en-ict-2022-mentorship-trading-model-mt4-02.webp)
![ICT 2022 Mentorship Trading Model Indicator MT4 Download – Free – [TFlab] 2](https://cdn.tradingfinder.com/image/461824/13-167-en-ict-2022-mentorship-trading-model-mt4-03.webp)
![ICT 2022 Mentorship Trading Model Indicator MT4 Download – Free – [TFlab] 3](https://cdn.tradingfinder.com/image/461825/13-167-en-ict-2022-mentorship-trading-model-mt4-04.webp)
The ICT 2022 Mentorship Trading Model Indicator is designed based on the ICT trading style and is specifically useful for technical analysis. This trading tool identifies market structure, liquidity, trade opportunities through displacement, and fair value gaps (FVG).
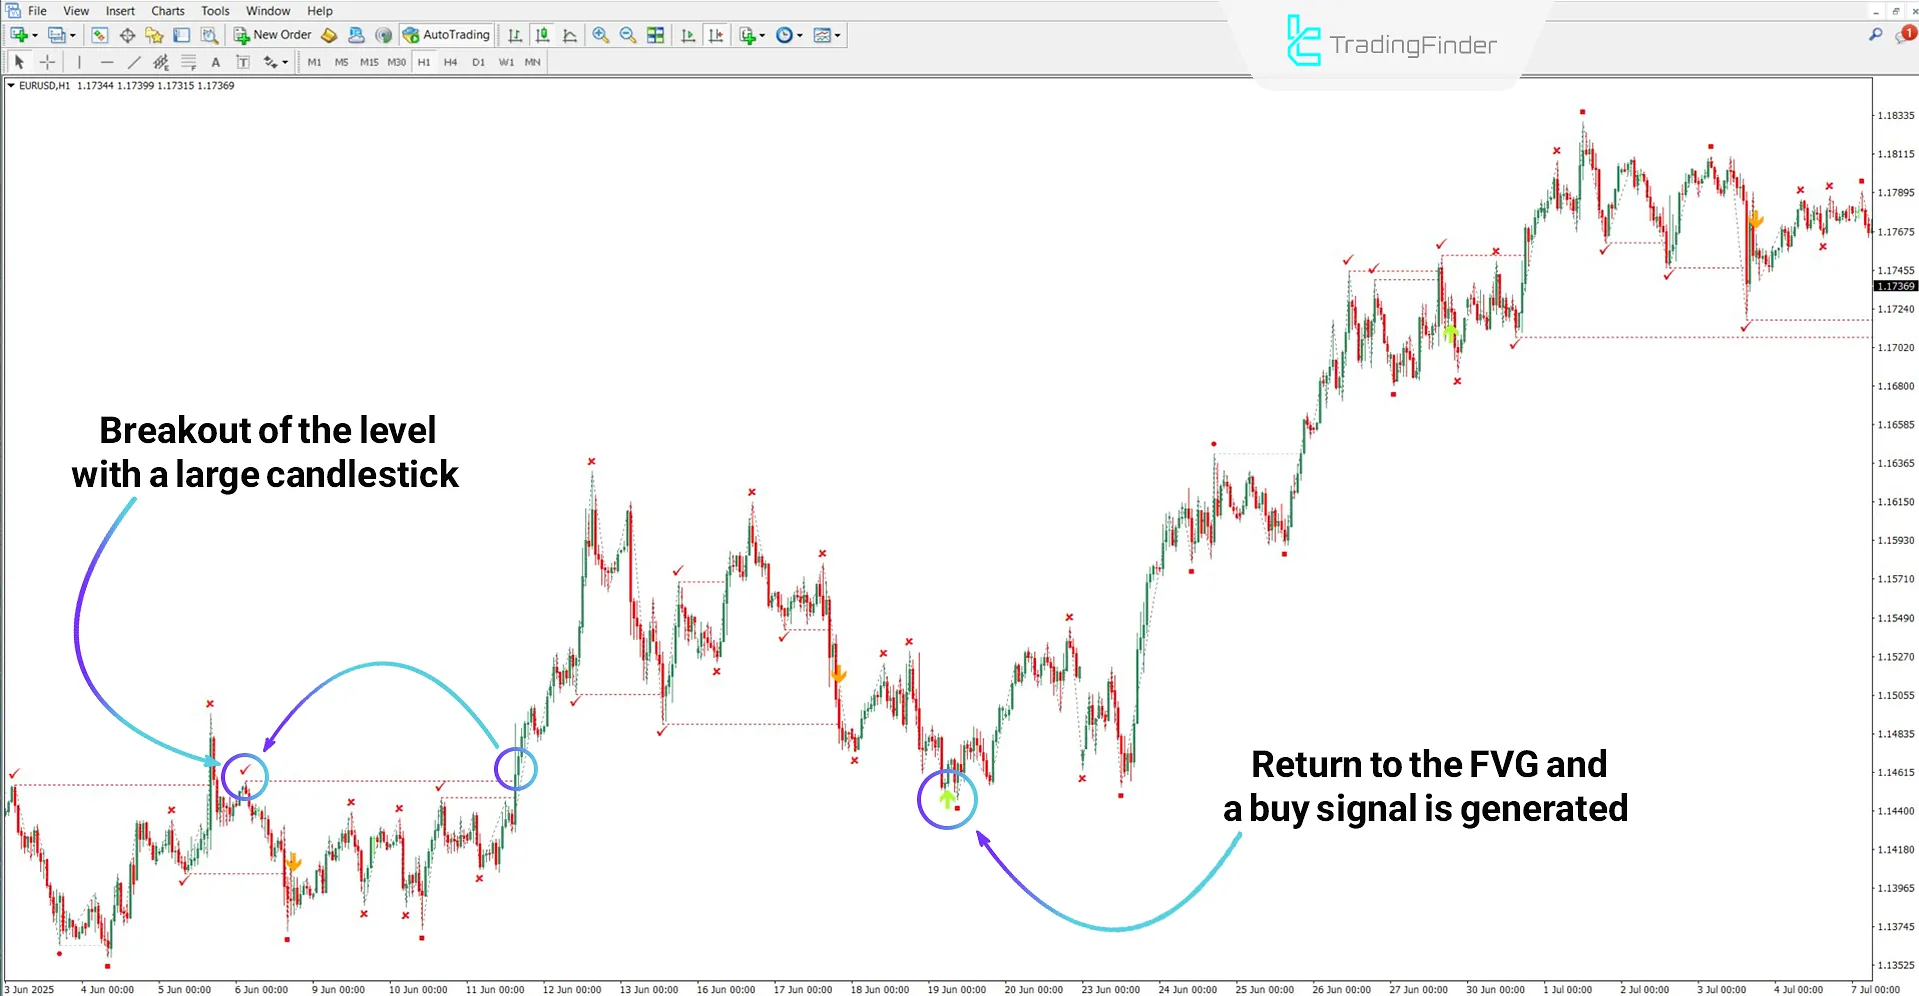
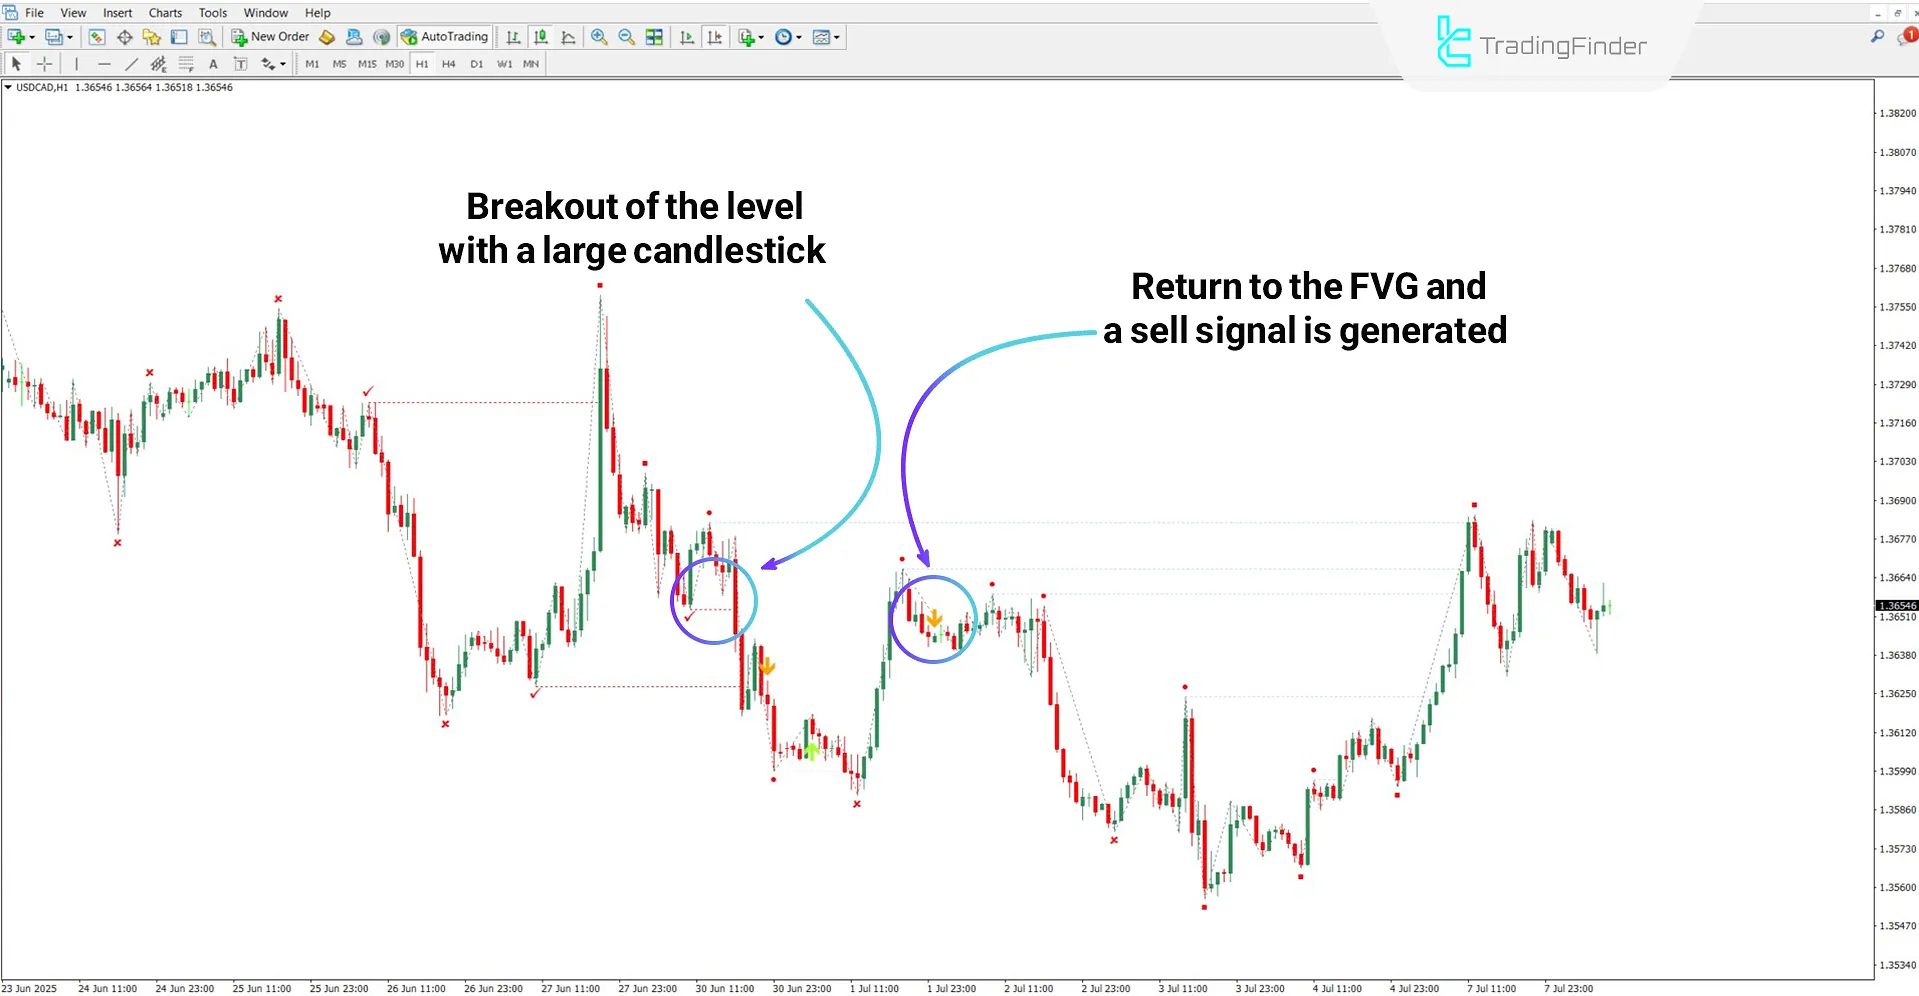
Moreover, when a level is broken by a strong candle and the price returns to the FVG, the indicator generates an entry signal using directional arrows.
ICT 2022 Mentorship Trading Model Indicator Specifications Table
Below is the table showing the key features of the ICT 2022 Mentorship Trading Model Indicator.
Indicator Categories: | ICT MT4 Indicators Signal & Forecast MT4 Indicators Liquidity MT4 Indicators |
Platforms: | MetaTrader 4 Indicators |
Trading Skills: | Advanced |
Indicator Types: | Breakout MT4 Indicators Reversal MT4 Indicators |
Timeframe: | Multi-Timeframe MT4 Indicators |
Trading Style: | Day Trading MT4 Indicators Scalper MT4 Indicators Swing Trading MT4 Indicators |
Trading Instruments: | Stock Market MT4 Indicators Cryptocurrency MT4 Indicators Forex MT4 Indicators |
Overview of the ICT 2022 Mentorship Trading Model Indicator
In this indicator, apart from signal arrows (green and orange), three other types of markers appear on the chart, each representing a specific type of high/low break:
- X mark: When the previous high/low is broken only by the wick (shadow) of a candle
- Circle mark: If the candle body breaks the high/low
- Tick mark: When the breakout occurs through a strong displacement candle
Buy Signal
According to the 1H chart of EUR/USD, a large candle breaks the resistance level with displacement, and a tick mark appears. As shown, the price later returns to the FVG zone, and the indicator generates a buy signal, indicated by a green arrow.

Sell Signal
Based on the 1H chart of USD/CAD, the high lighted area is broken. Then, the price returns to the FVG created within the breakout zone, and a sell signal is generated, indicated by an orange arrow.

ICT 2022 Mentorship Trading Model Indicator Settings
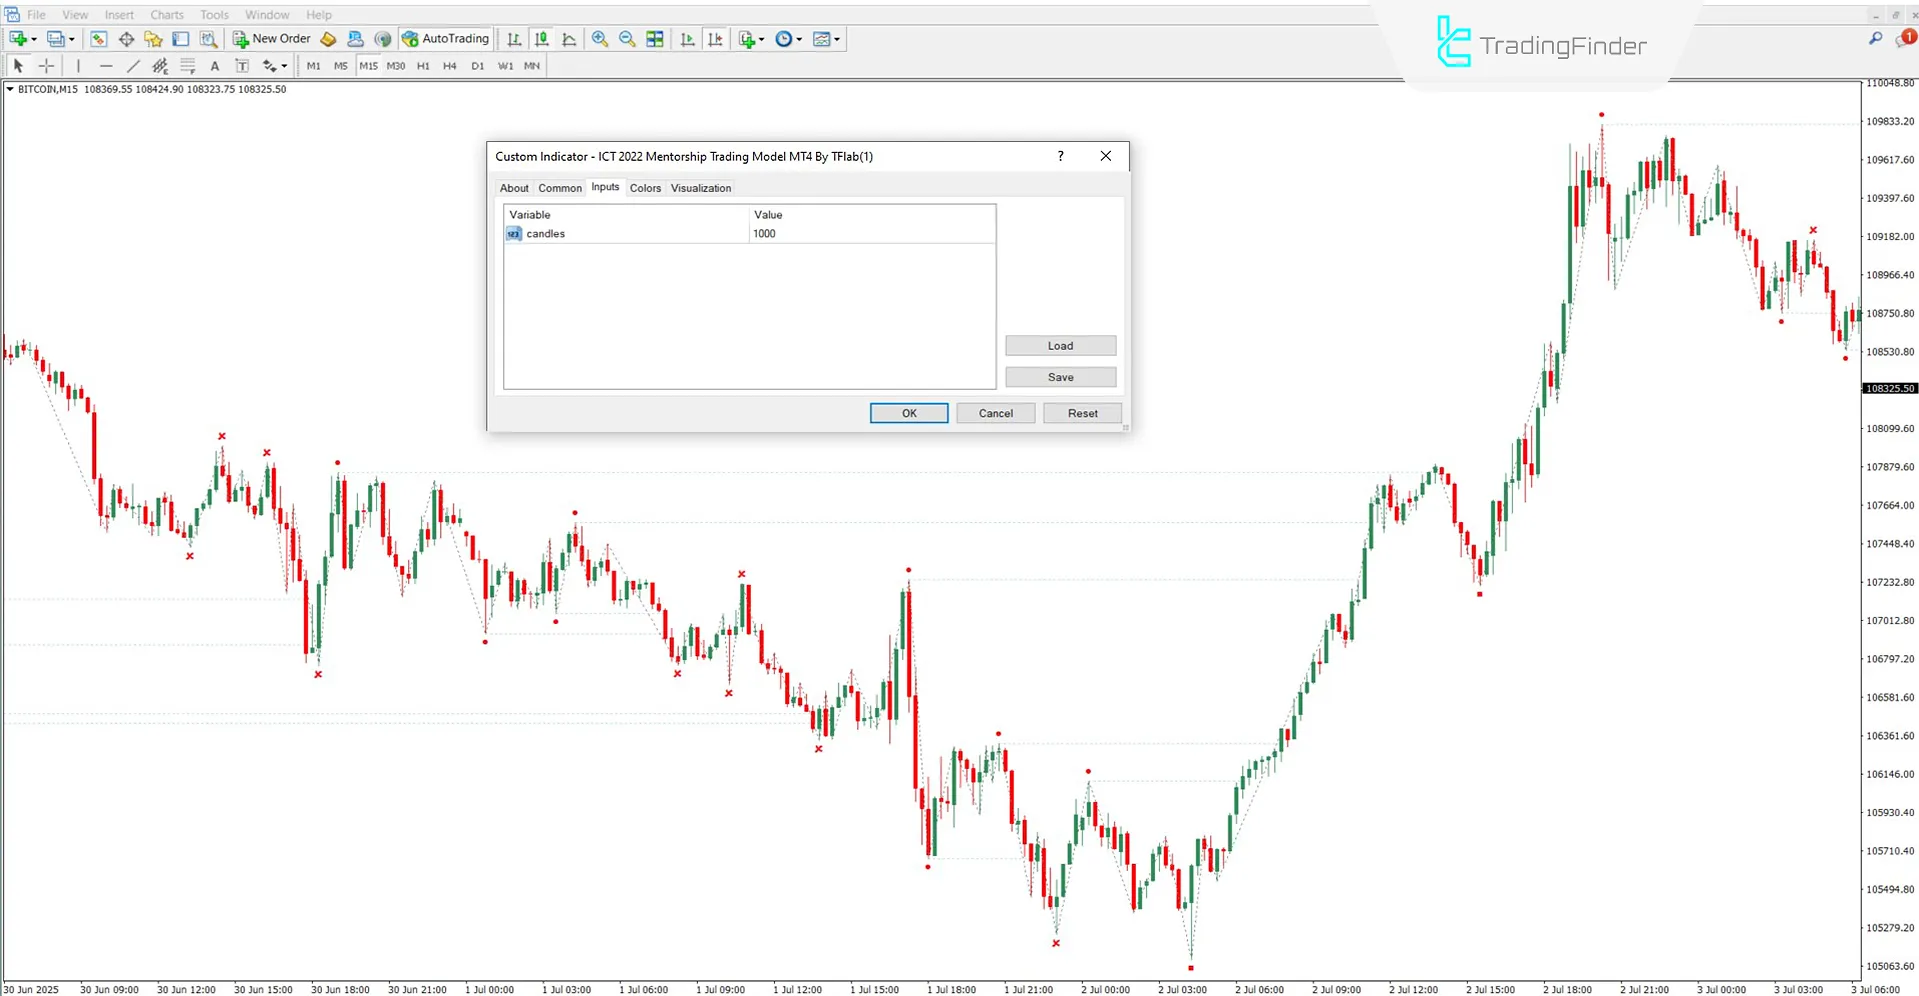
The settings section of the ICT 2022 Mentorship Trading Model Indicator includes the following items:

- Candles: Sets the number of candles used for indicator calculations
Conclusion
By using the ICT 2022 Mentorship Trading Model Indicator, one can more accurately identify key liquidity zones, valid structural breakouts, and price pullbacks into FVG zones.
This tool also clarifies the direction of price movement after valid breakouts, enabling traders to respond with higher precision to strategic pullbacks into FVG zones by generating reliable buy/sell signals.
ICT 2022 Mentorship Trading Model MT4 PDF
ICT 2022 Mentorship Trading Model MT4 PDF
Click to download ICT 2022 Mentorship Trading Model MT4 PDFWhat does the X mark mean in the ICT 2022 Mentorship Indicator?
It indicates that the wick broke highs and lows of upcoming candles.
When exactly is a trade entry signal generated?
When a strong candle breaks the level (a tick mark appears), the the price returns to the FVG area.
Always thanks for all your amazing work, always grateful to share your skills to help all of us, but this indicator doesn't work without license. Anyway thousand times thank you so much, all of you rock! Carmen
You can request a free trial license by first contacting us through the online chat and then sending a message via Telegram or WhatsApp to support.


