


On August 16, 2025, in the latest version, the Unicorn and Inducement modules were added to enable more precise liquidity flow analysis; To obtain a free license for this indicator, click on Online Support and reach out to us via Telegram or WhatsApp through the section “Connect with an Expert.
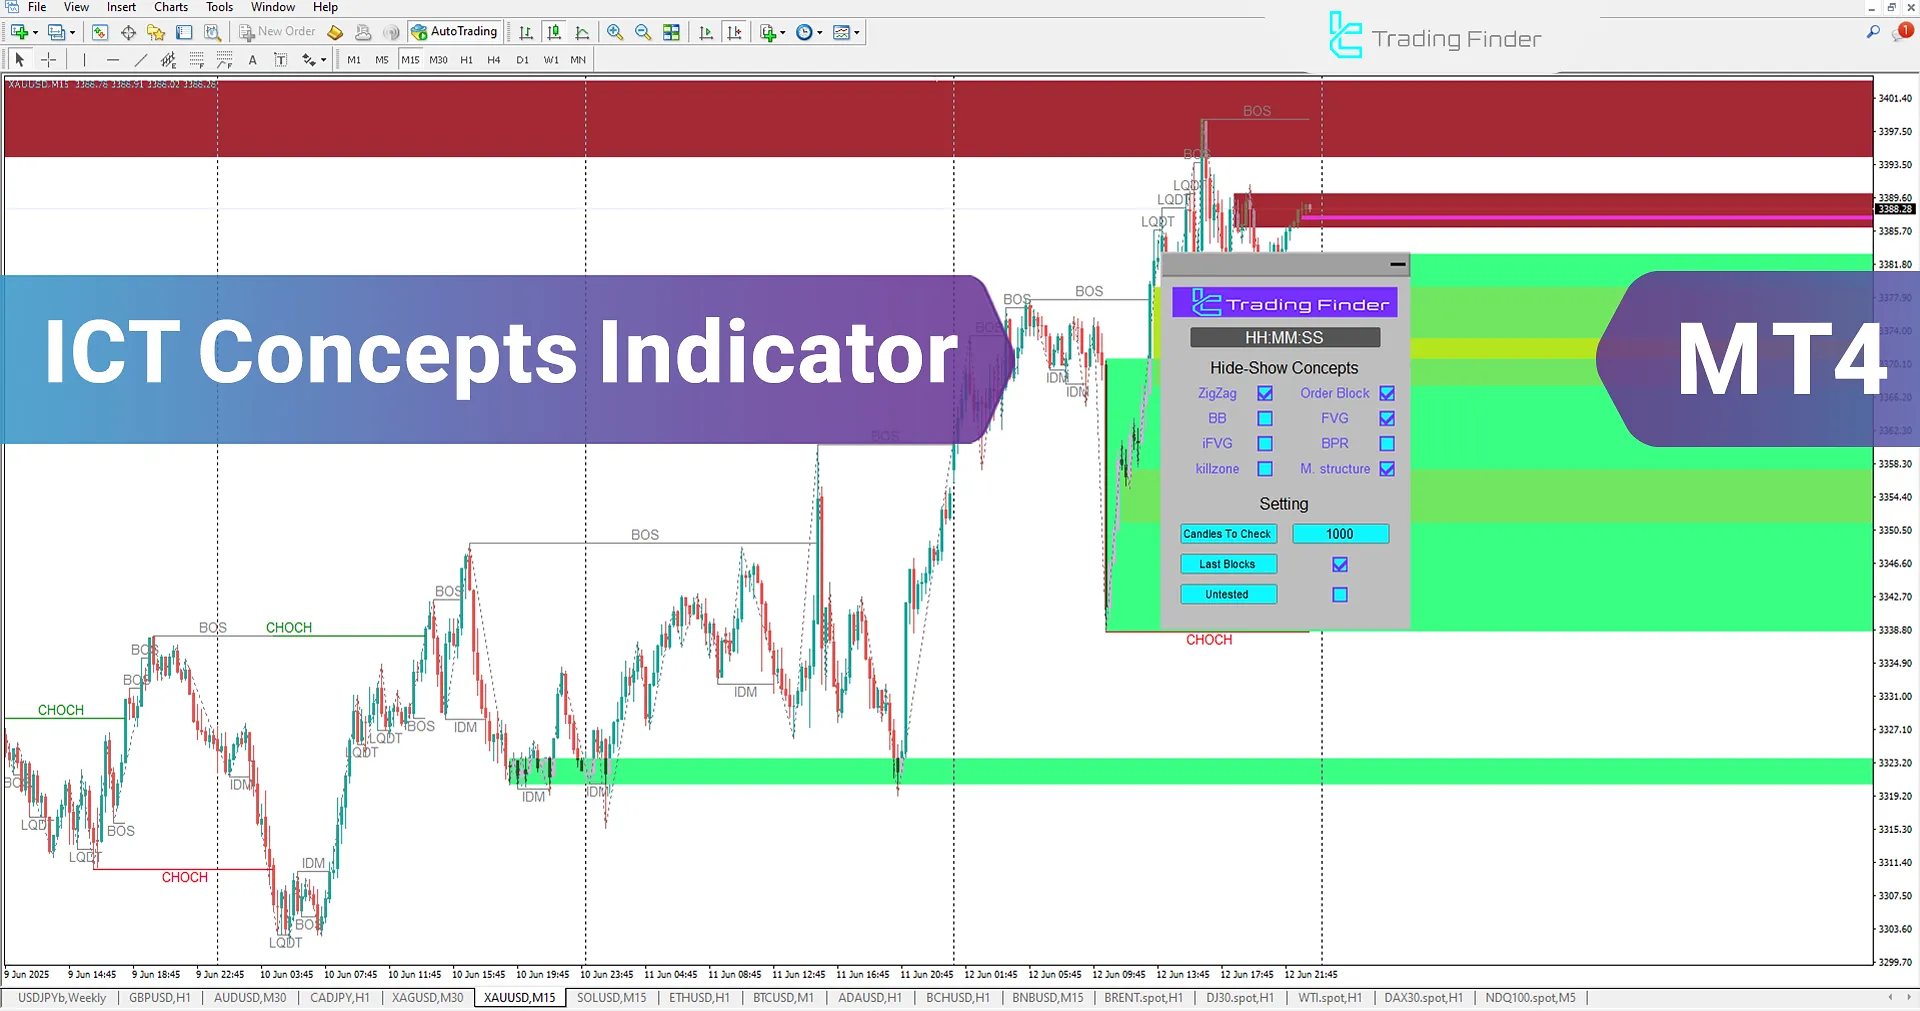
The ICT Concepts indicator is a specialized and advanced tool designed in the form of an expert, and it runs through the expert installation in MT4. This tool provides traders with a complete set of key ICT and Smart Money concepts through a user-friendly panel.
This indicator allows ICT-style traders to easily use concepts such as Order Blocks, Fair Value Gap (FVG), Breaker Block, Market Structure, and Kill Zones in their analysis.
The advanced settings panel offers practical customization for displaying each of these concepts.
ICT Concepts Indicator Table
Below is a general specification of the ICT Concepts Indicator:
Indicator Categories: | ICT MT4 Indicators Smart Money MT4 Indicators Session & KillZone MT4 Indicators |
Platforms: | MetaTrader 4 Indicators |
Trading Skills: | Advanced |
Indicator Types: | Leading MT4 Indicators Reversal MT4 Indicators Non-Repainting MT4 Indicators |
Timeframe: | Multi-Timeframe MT4 Indicators |
Trading Style: | Day Trading MT4 Indicators Intraday MT4 Indicators Scalper MT4 Indicators |
Trading Instruments: | Indices Market MT4 Indicators Stock Market MT4 Indicators Forex MT4 Indicators |
Overview of the ICT Concepts Indicator
The ICT Concepts Indicator provides various adjustable modes that allow traders to implement their analysis based on a customized ICT strategy plan directly on the chart.
Covering core ICT concepts, this indicator is a suitable tool for informed decision-making in financial markets. Users can enable or disable analytical elements such as order blocks, market structure, or fair value gaps based on their needs.
Expert Installation Guide
A step-by-step guide for installing and activating an Expert Advisor in MetaTrader 4 is thoroughly covered in a dedicated tutorial.
For detailed steps and related notes, refer to the specific guide for installing an Expert on the MT4 platform.
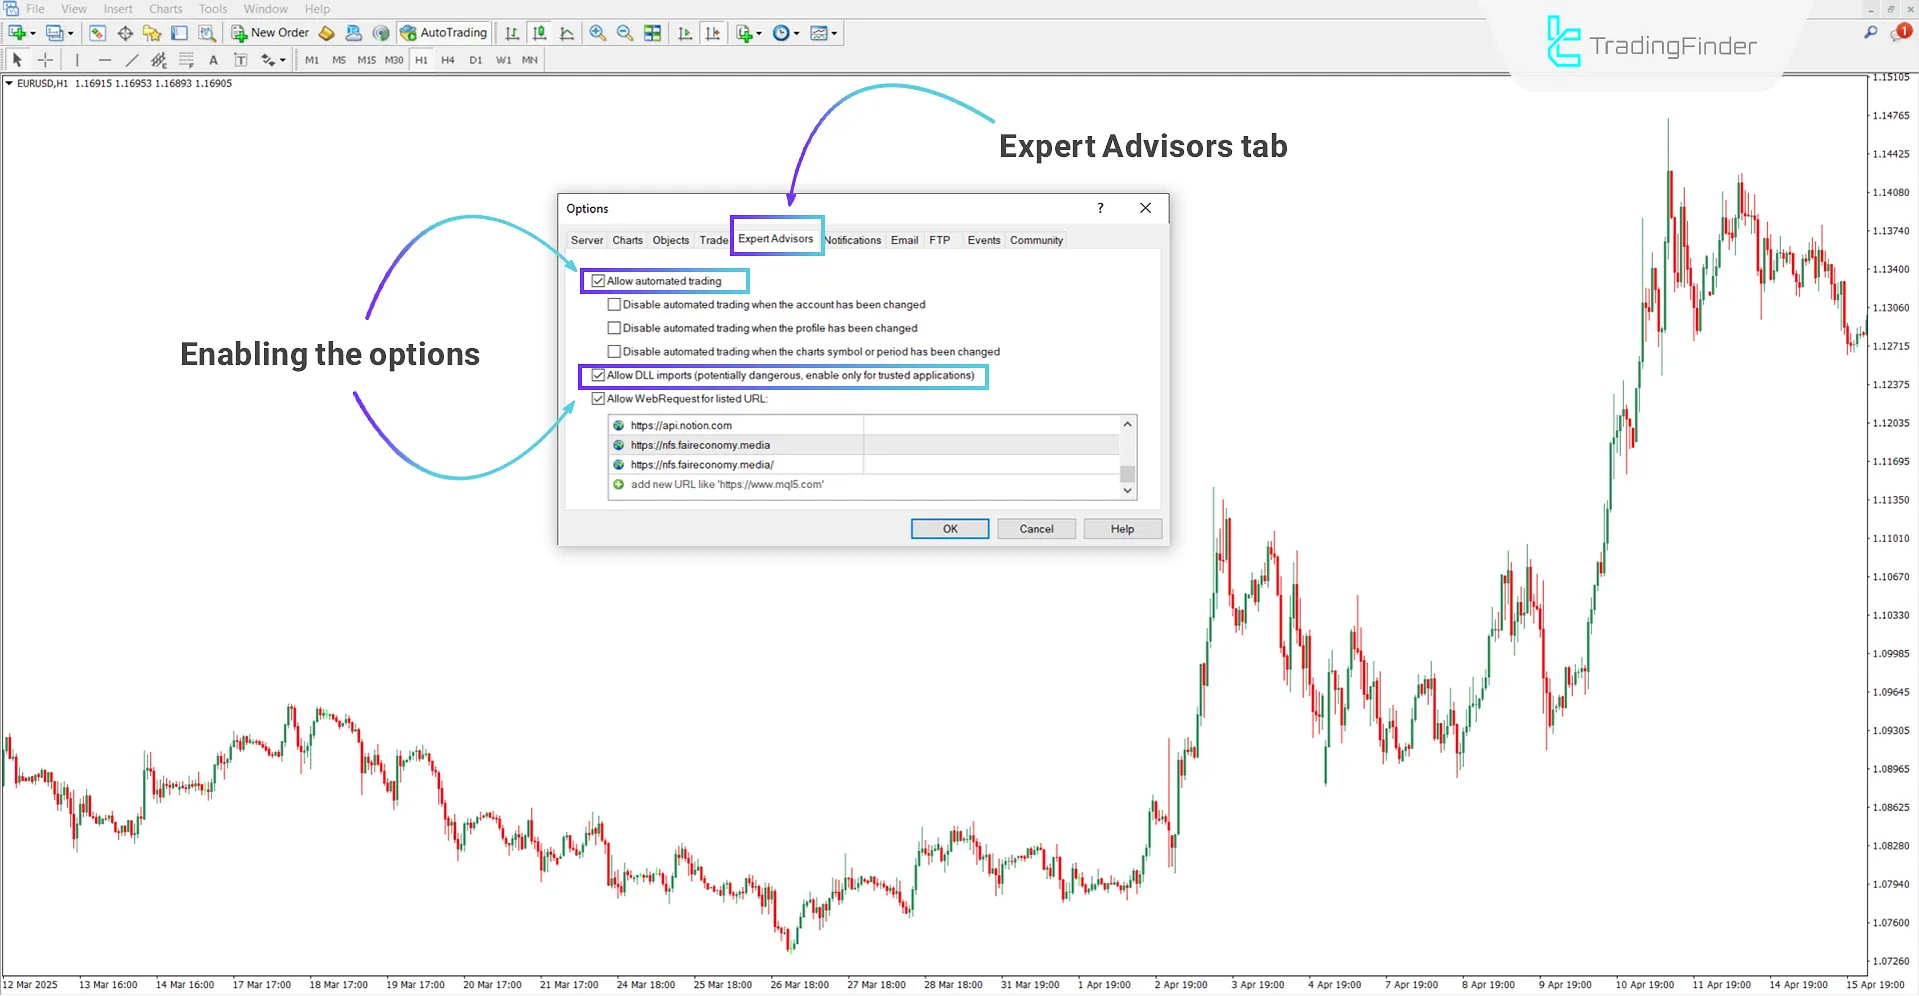
Enabling the "Allow automated trading" and "DLL" Options
To run an Expert in MetaTrader 4, you must first activate two key options within the platform.
The activation process is as follows:
- First, go to the "Tools" menu and select "Options"
- In the opened window, navigate to the "Expert Advisors" tab
- Finally, enable the following options
Options Include:
- Allow automated trading
- Allow DLL imports
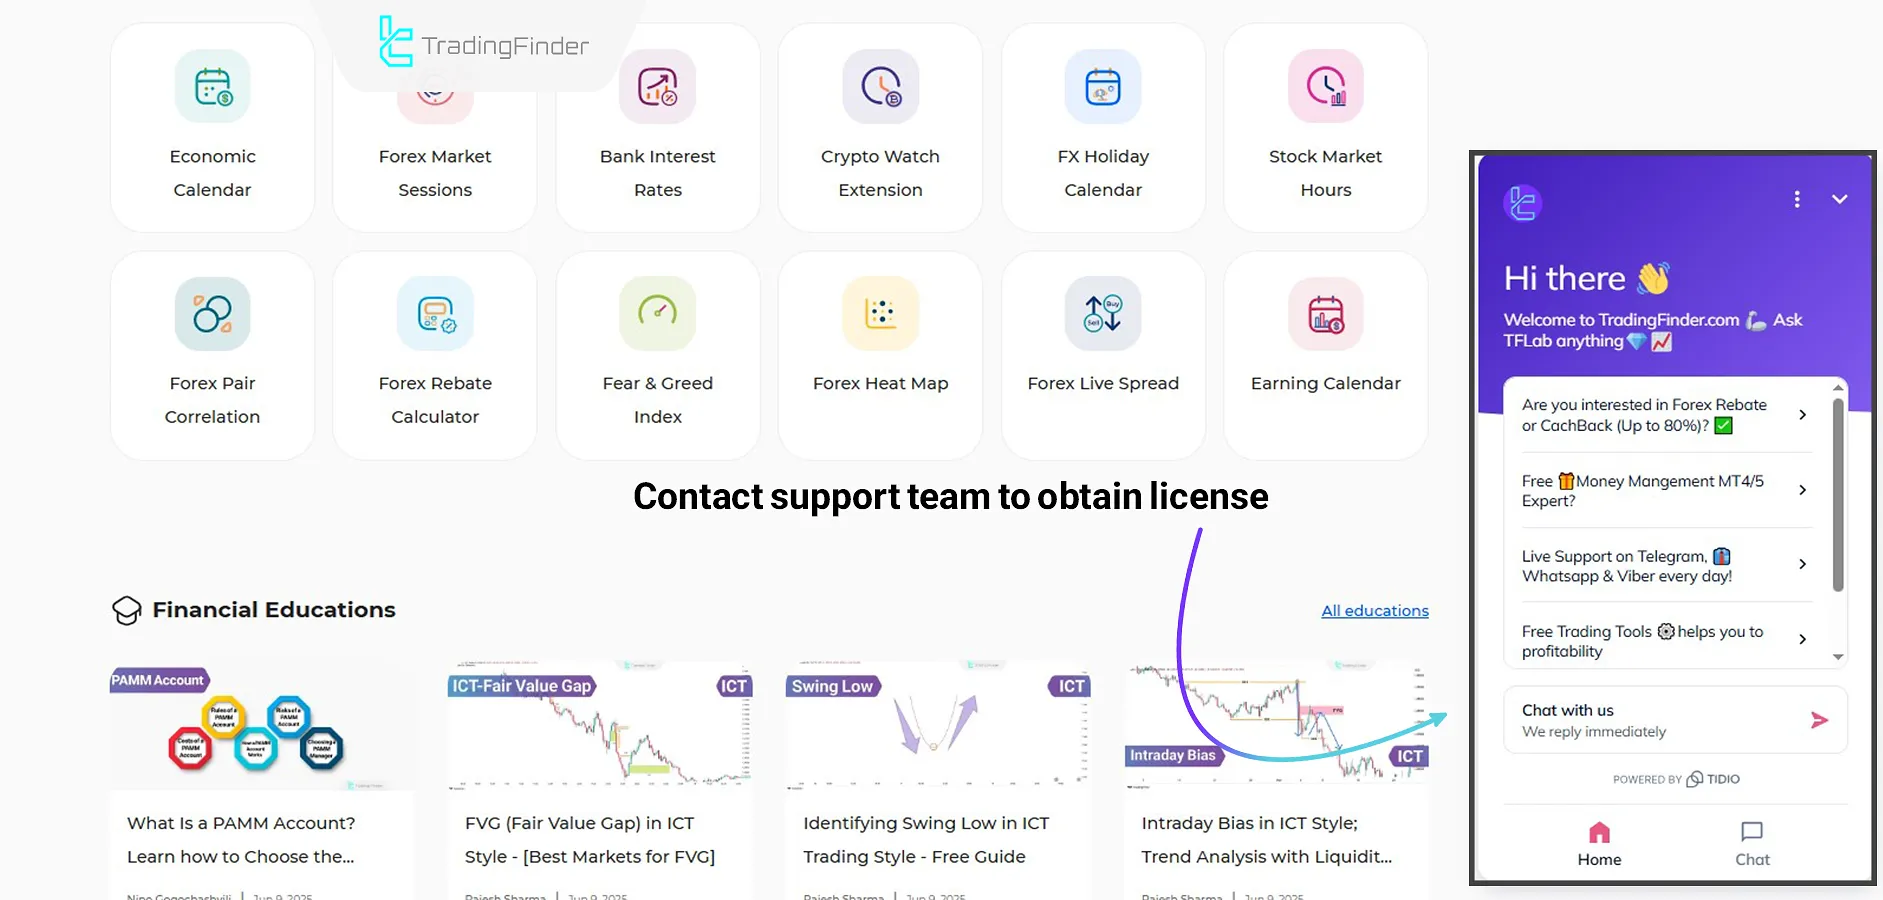
License Code Request
Users can request a license code by contacting the support team of the Trading Finder website.
Additionally, you can also submit a request via messaging apps like Telegram or WhatsApp.
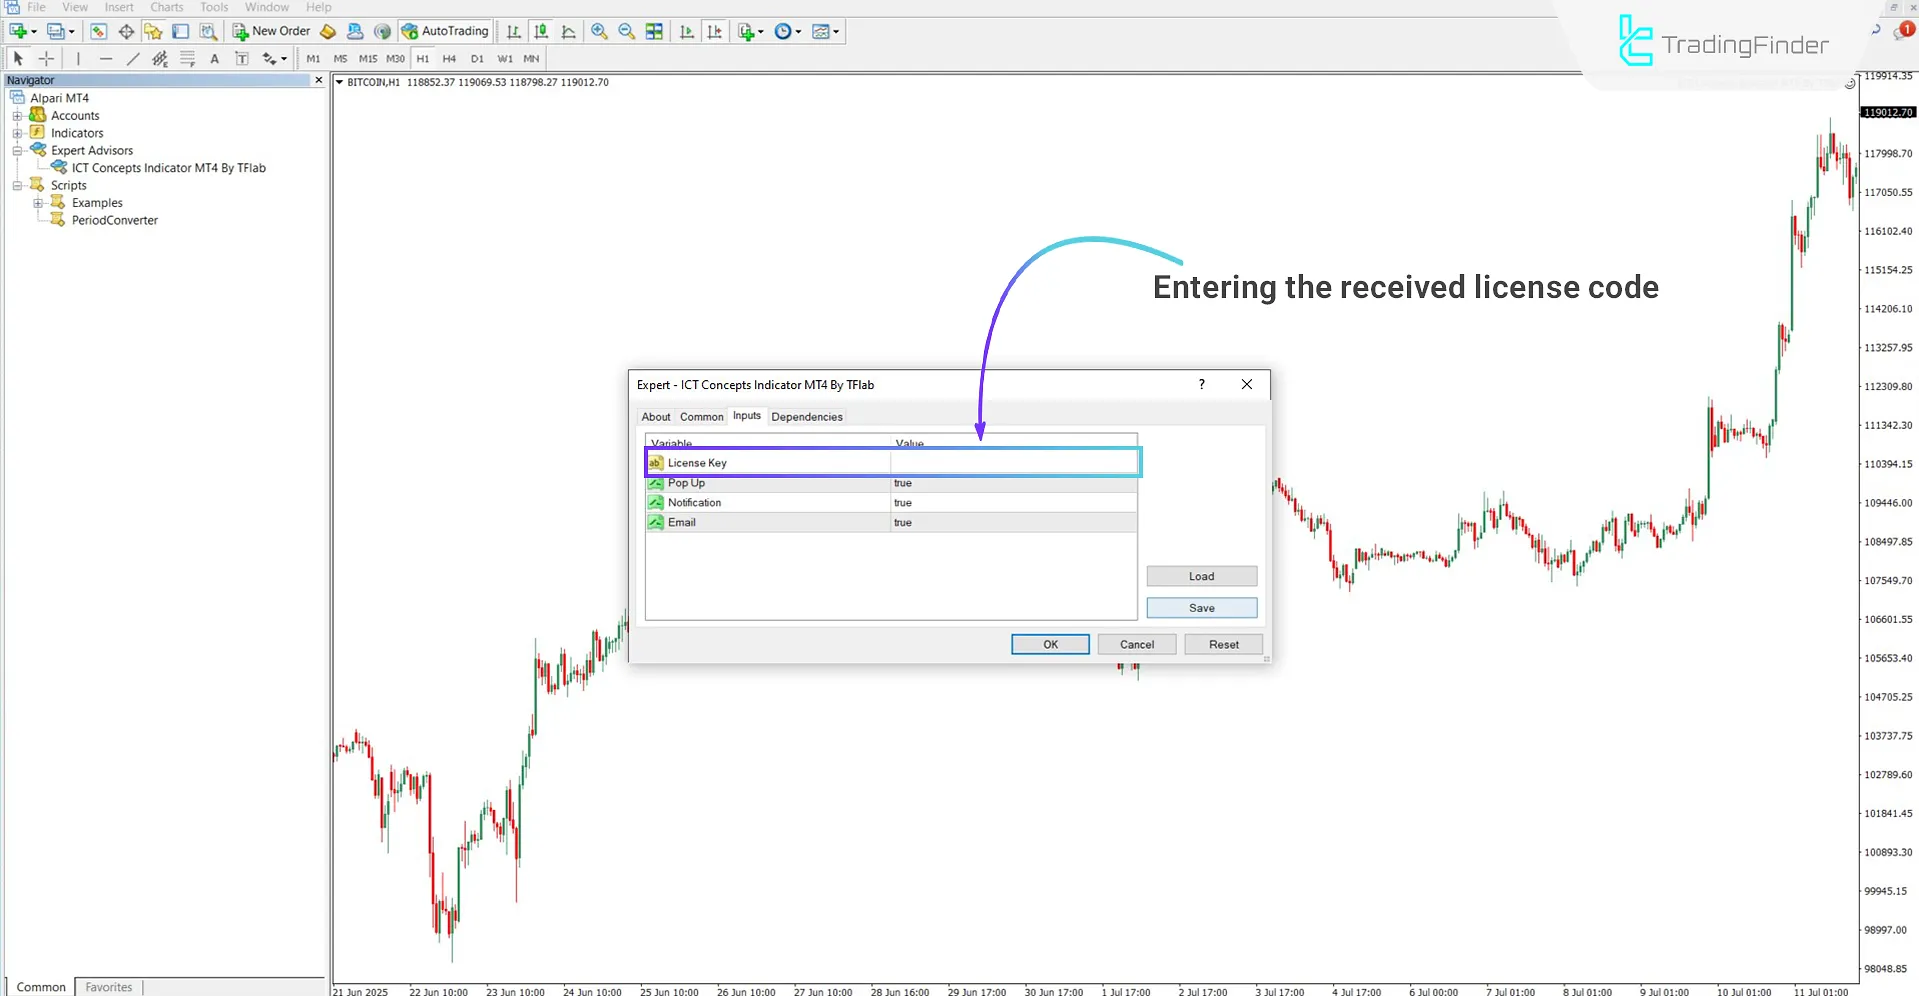
How to Use the License Code
Once the Expert is loaded onto the chart, the main panel will automatically appear.
At this point, the user must enter the license code exactly as received) without any changes (into the field labeled "Your License".
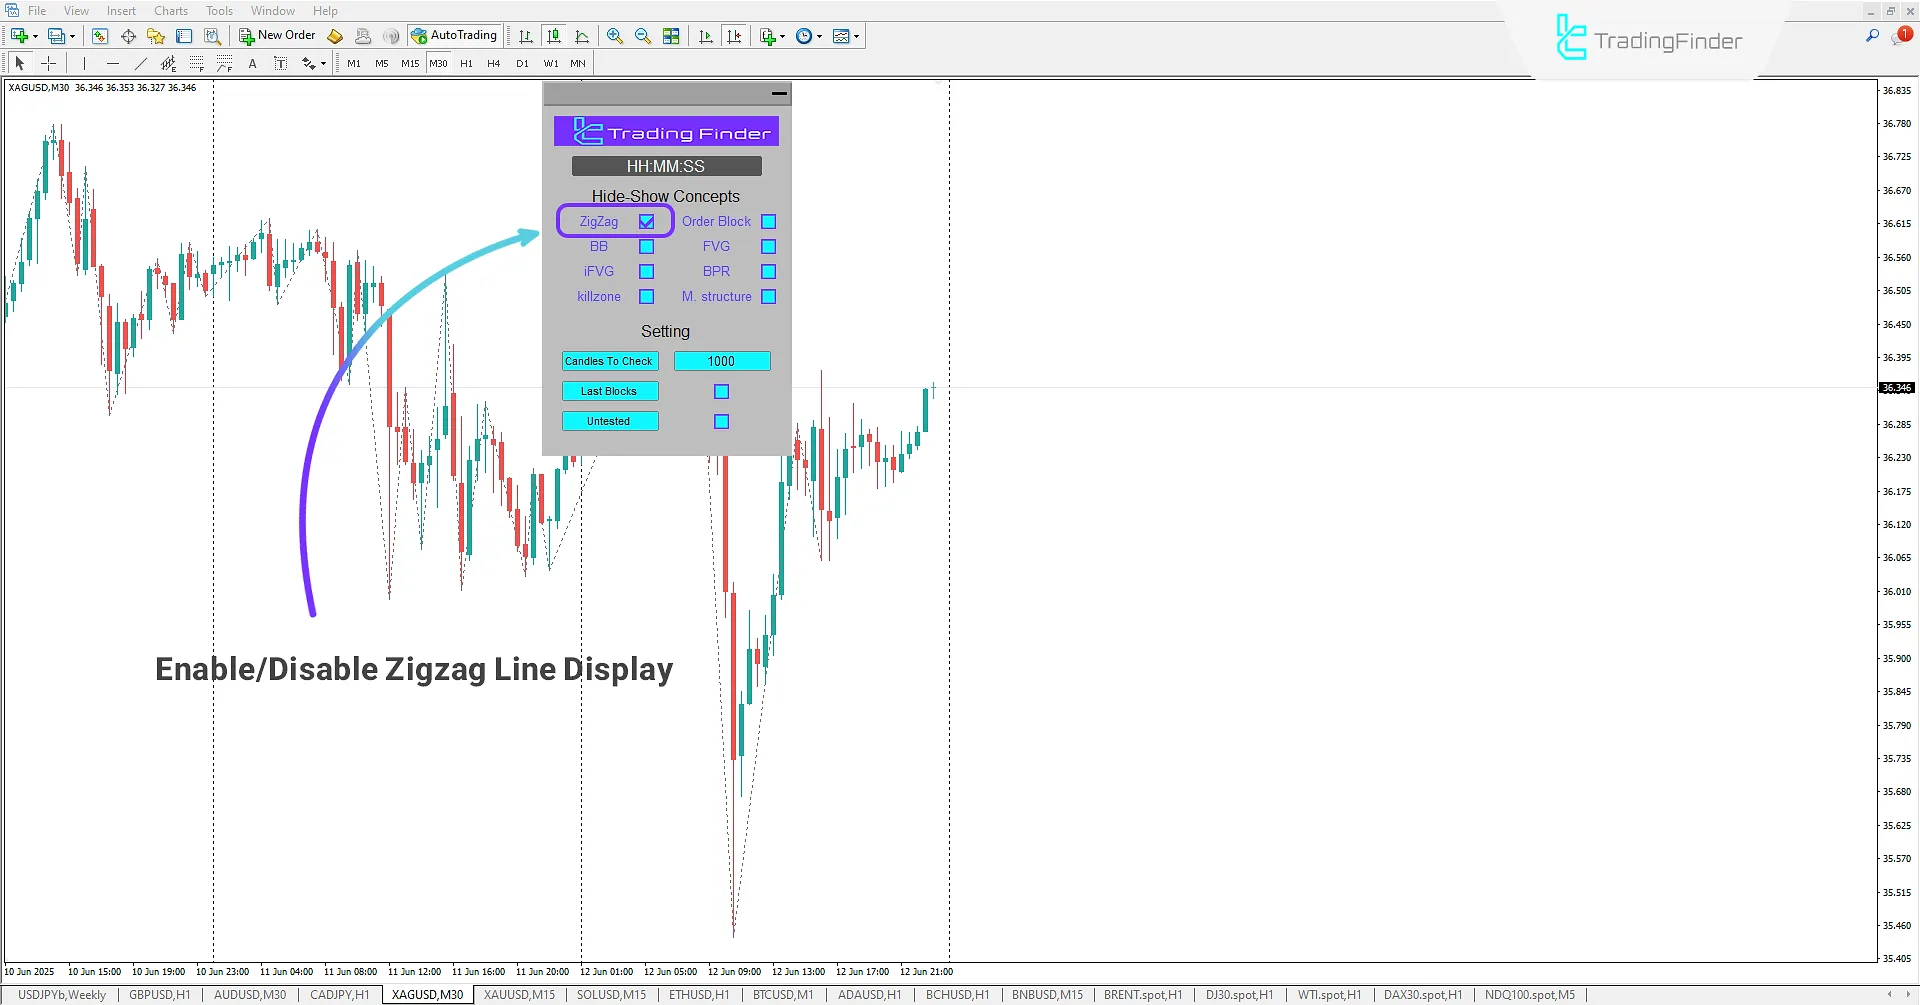
Zigzag Mode
In the 30-minute silver chart, activating the Zigzag option in the ICT Concepts Indicator automatically draws zigzag lines with default values (5,3,3).
This feature allows traders to better visualize the overall market structure and identify key Swing High/Low points.
Zigzag lines play a significant role in detecting price swings and are useful for understanding trend directions, corrective moves, and identifying Break of Structure (BOS) or Change of Character (CHOCH).
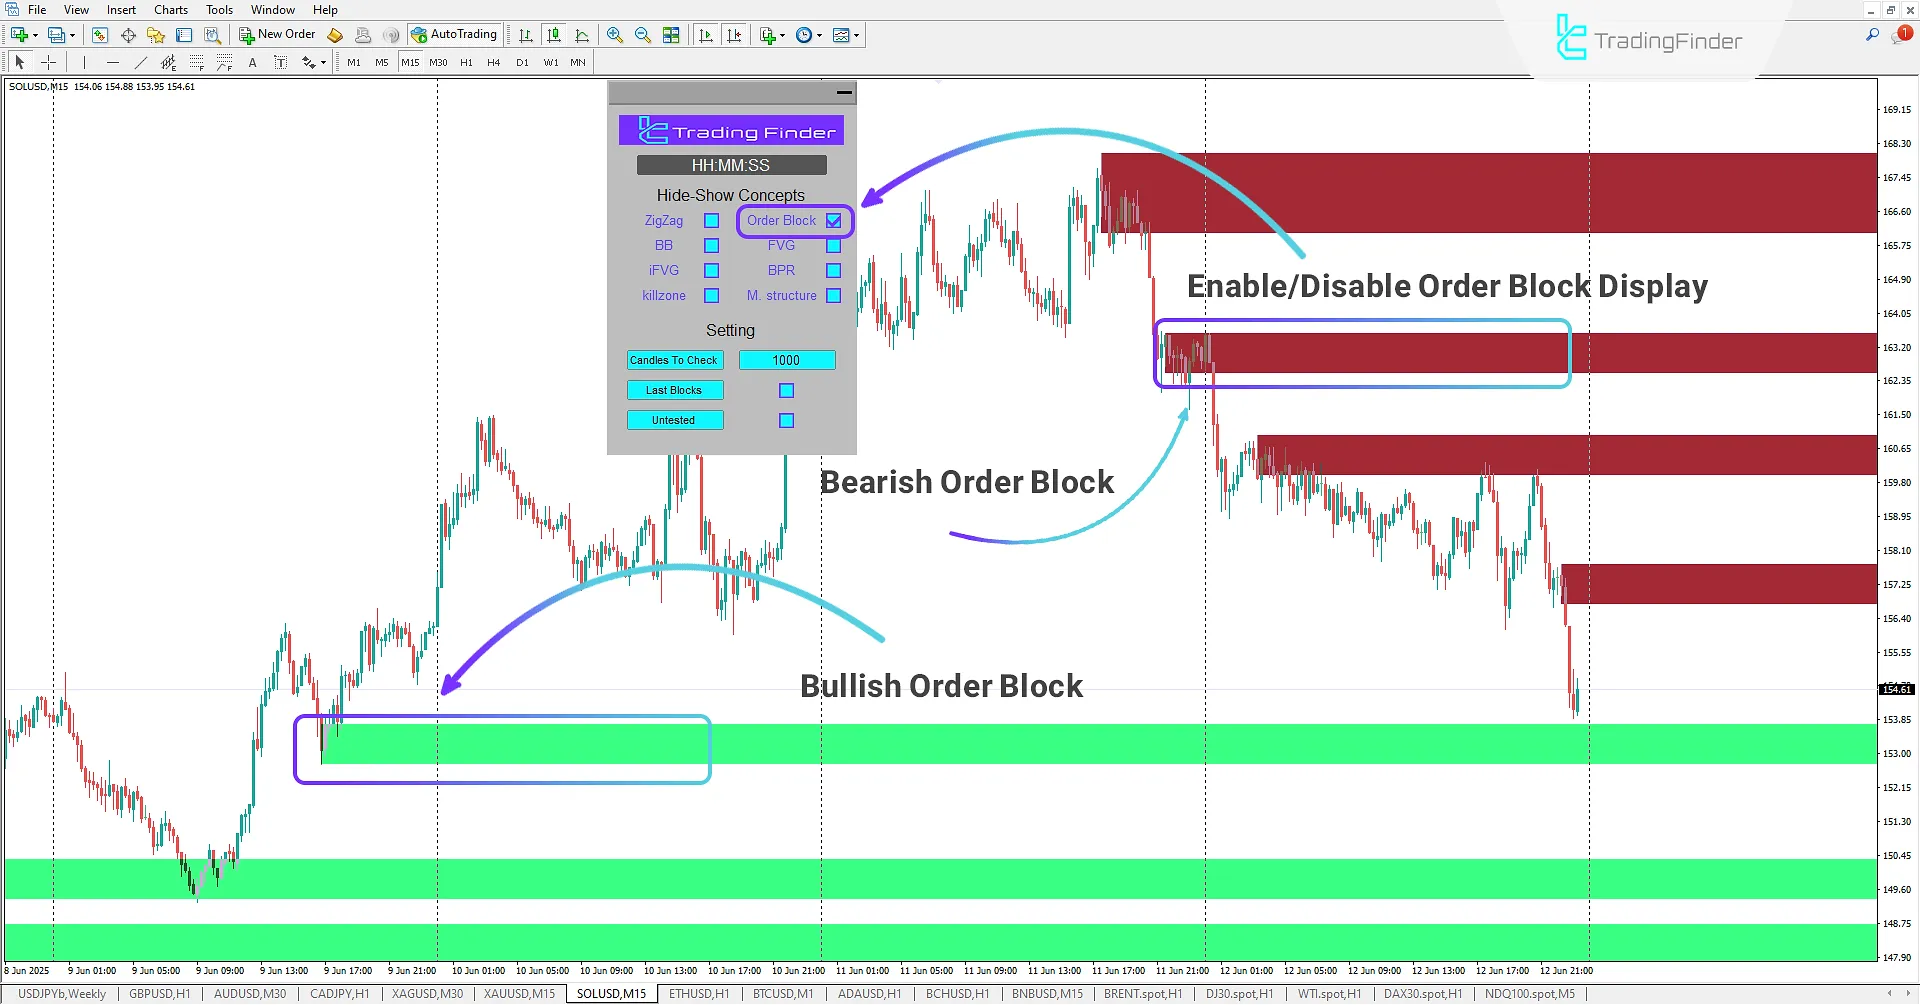
Order Block Mode
When the Order Block option is enabled in the ICT Concepts Indicator, traders can identify areas where Smart Money has placed major orders. These zones typically initiate strong price movements and indicate significant buying or selling pressure.
The indicator highlights these order blocks, allowing users to track Smart Money footprints. When the price retraces to these zones after a pullback, traders have opportunities for high-probability entries.
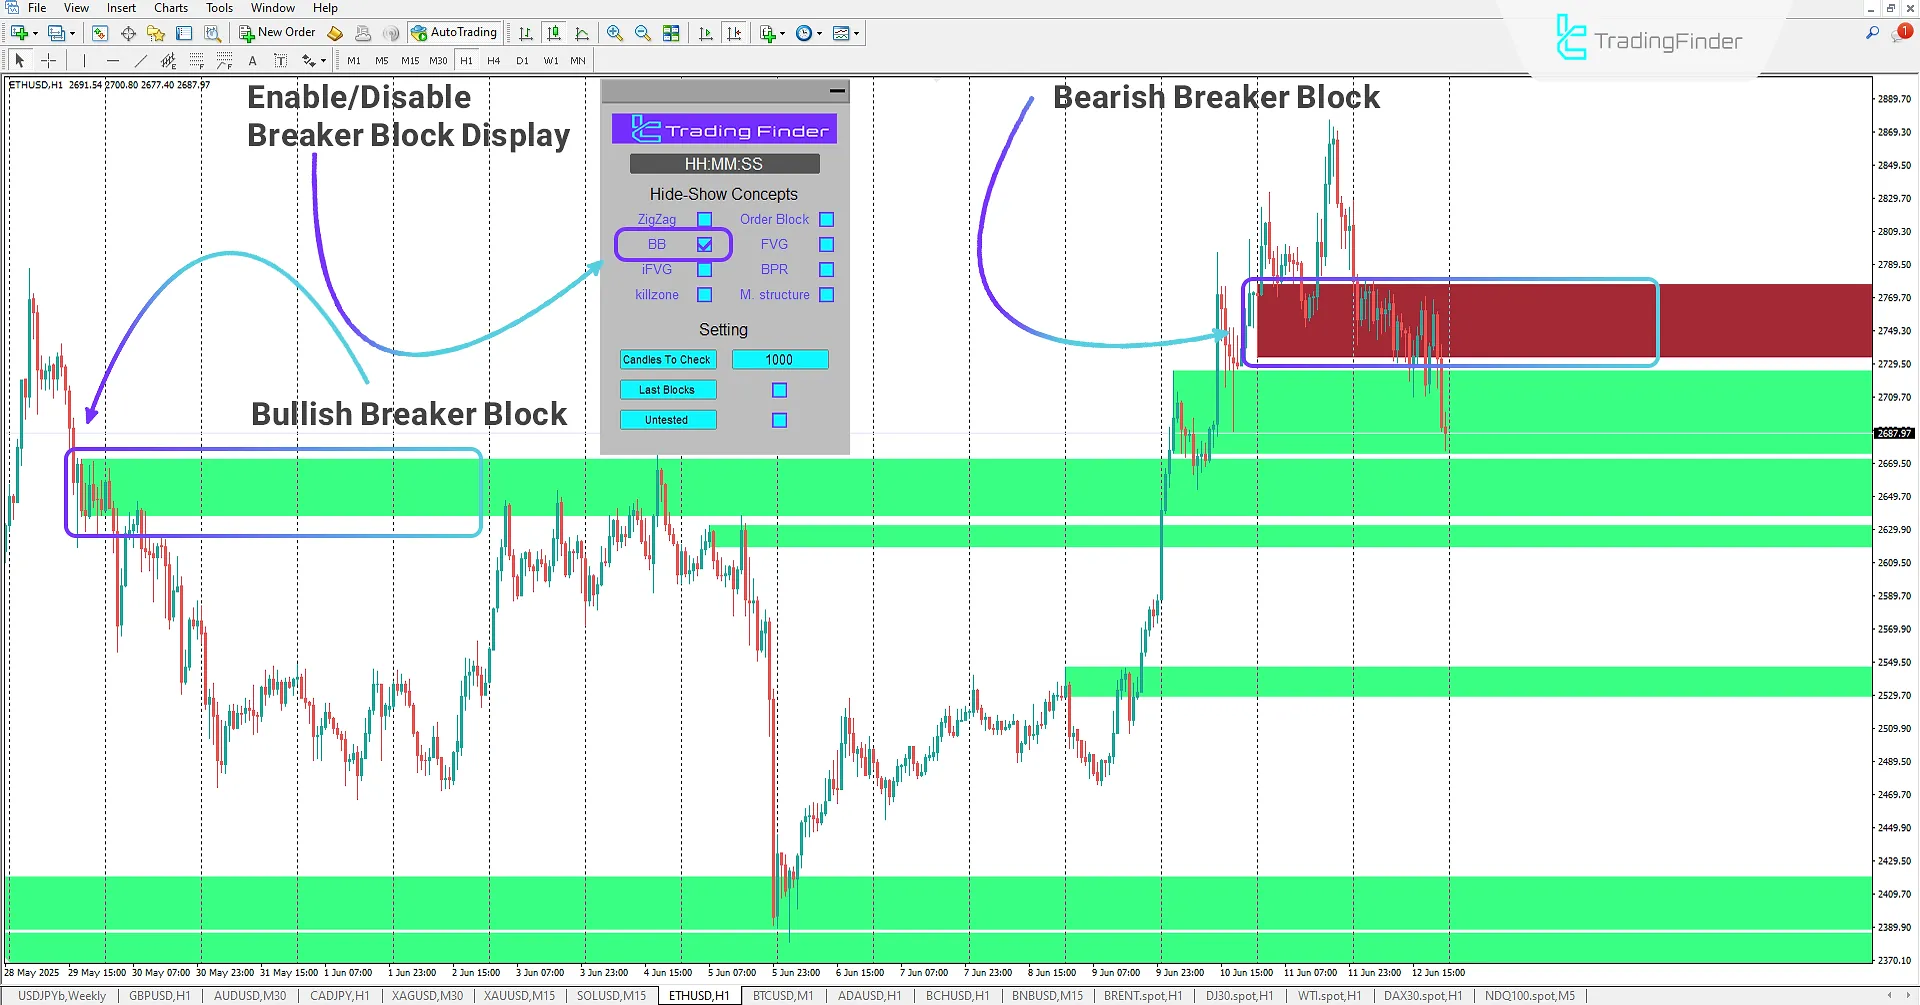
Breaker Block Mode
Enabling the Breaker Block moذs traders detect Breaker blocks that result from Liquidity Sweeps and Market Structure Shifts.
Breaker Blocks are former order blocks whose nature has changed from support to resistance or vice versa after a breakout.
For instance, when a bullish order block is broken, it usually turns into a new resistance zone. Conversely, a broken bearish order block becomes a bullish breaker block and acts as support.
Identifying these blocks and price retracements to such zones allows for more accurate trade setups. This concept, especially when supported by multi-timeframe analysis, significantly enhances trading precision.
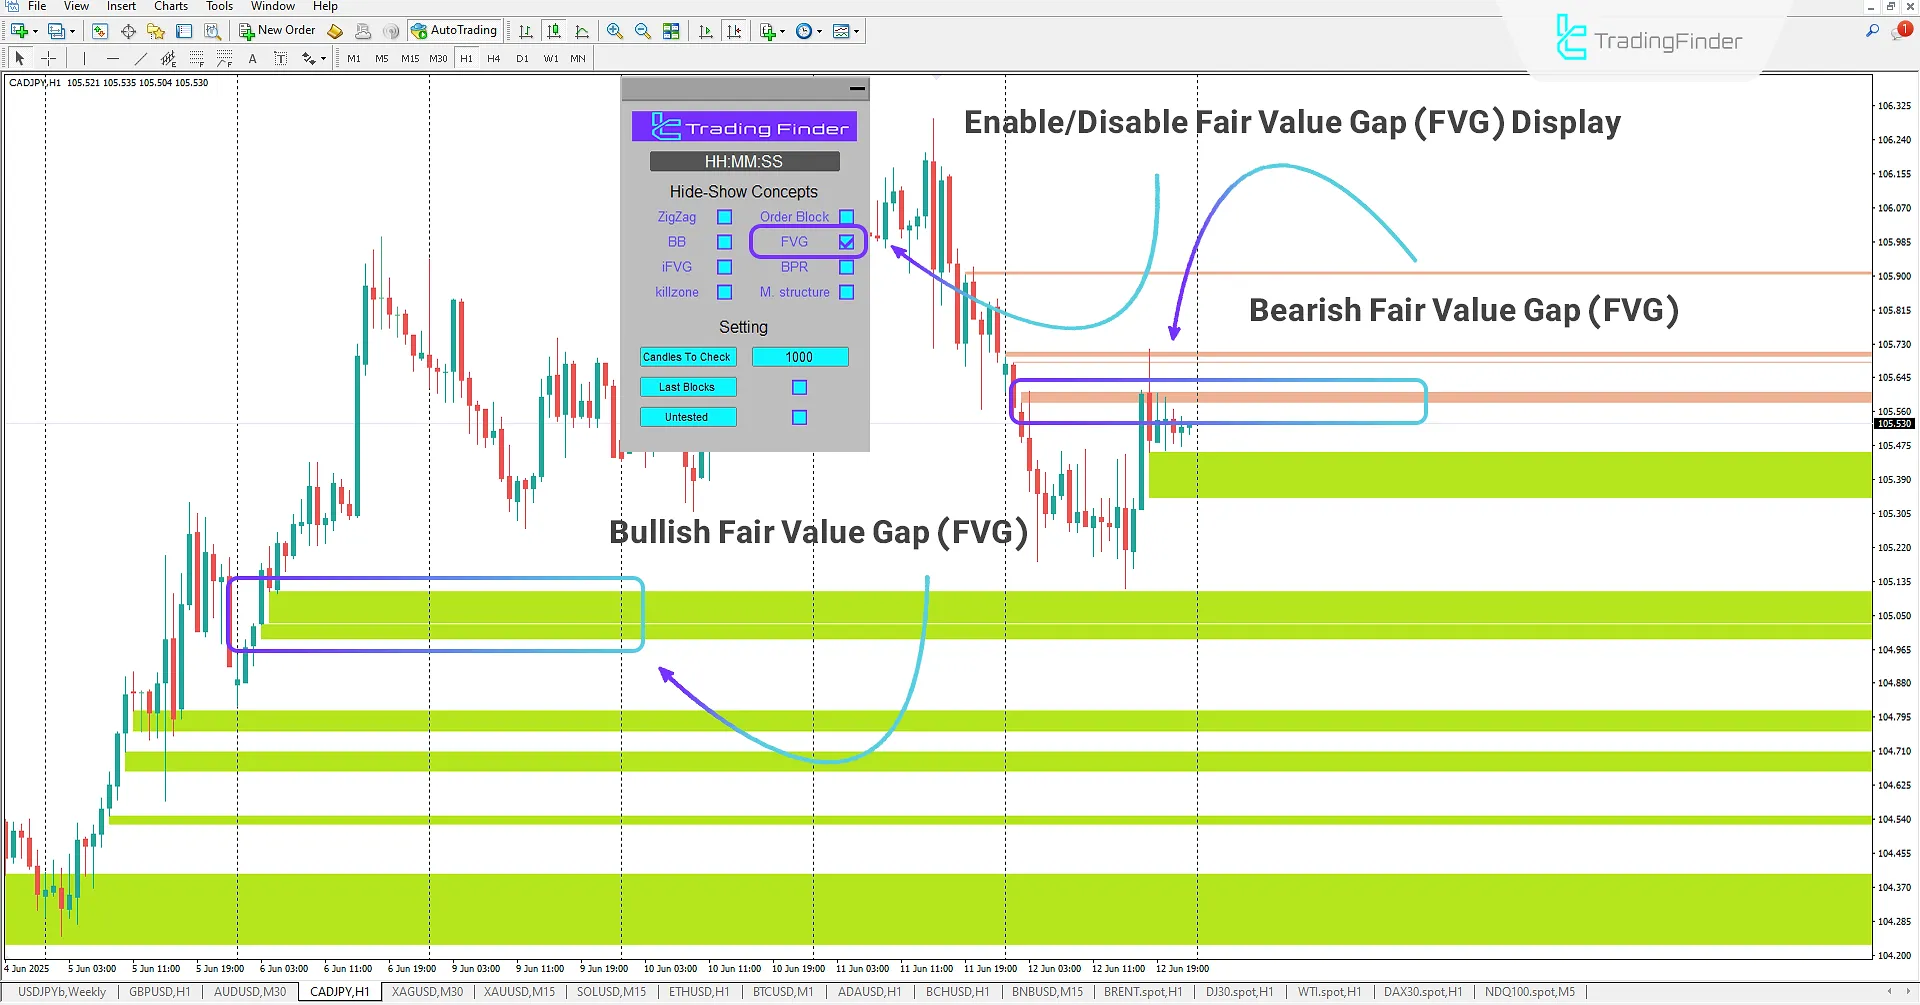
Fair Value Gap (FVG) Mode
Activating the Fair Value Gap (FVG) feature in the ICT Concepts Indicator allows traders to easily identify imbalance zones in the market. These gaps typically form in three-candle patterns where price quickly moves through an area without fully filling it.
FVGs result from intense buying or selling pressure and can act as hidden support or resistance levels. Since markets tend to seek equilibrium, these gaps often pull the price back like a magnet.
Professional traders can use these areas as trade entry opportunities when the price revisits and attempts to fill the gap.
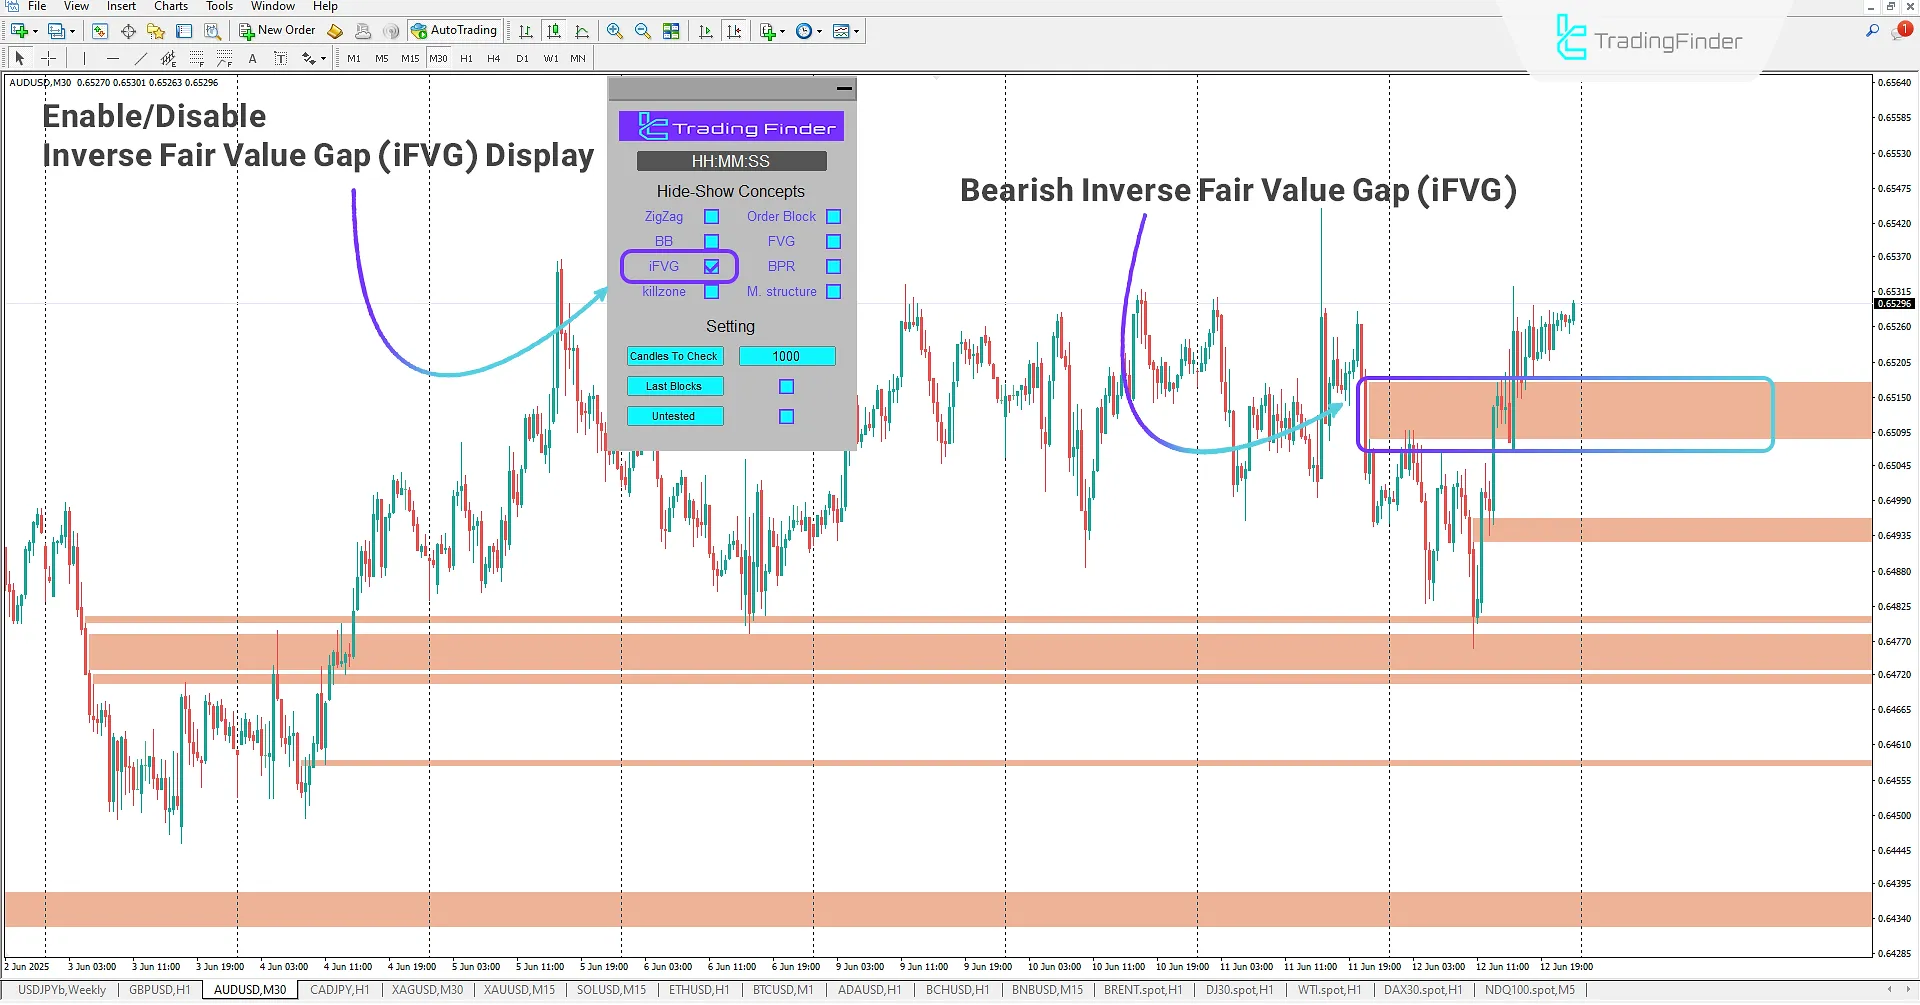
Inverse Fair Value Gap (iFVG) Mode
A more advanced and practical ICT concept is the Inverse Fair Value Gap (iFVG), which plays a key role in identifying supply and demand zones. This occurs when a previous FVG changes nature due to price breaks and market structure shifts.
For example, if a bullish FVG forms and is later broken by price action, it becomes a bearish iFVG, acting as resistance.
Conversely, if a bearish FVG is broken, the resulting zone turns into a bullish iFVG, serving as new support.
By identifying these areas and observing price reactions, traders can find high-probability trade opportunities upon retest.
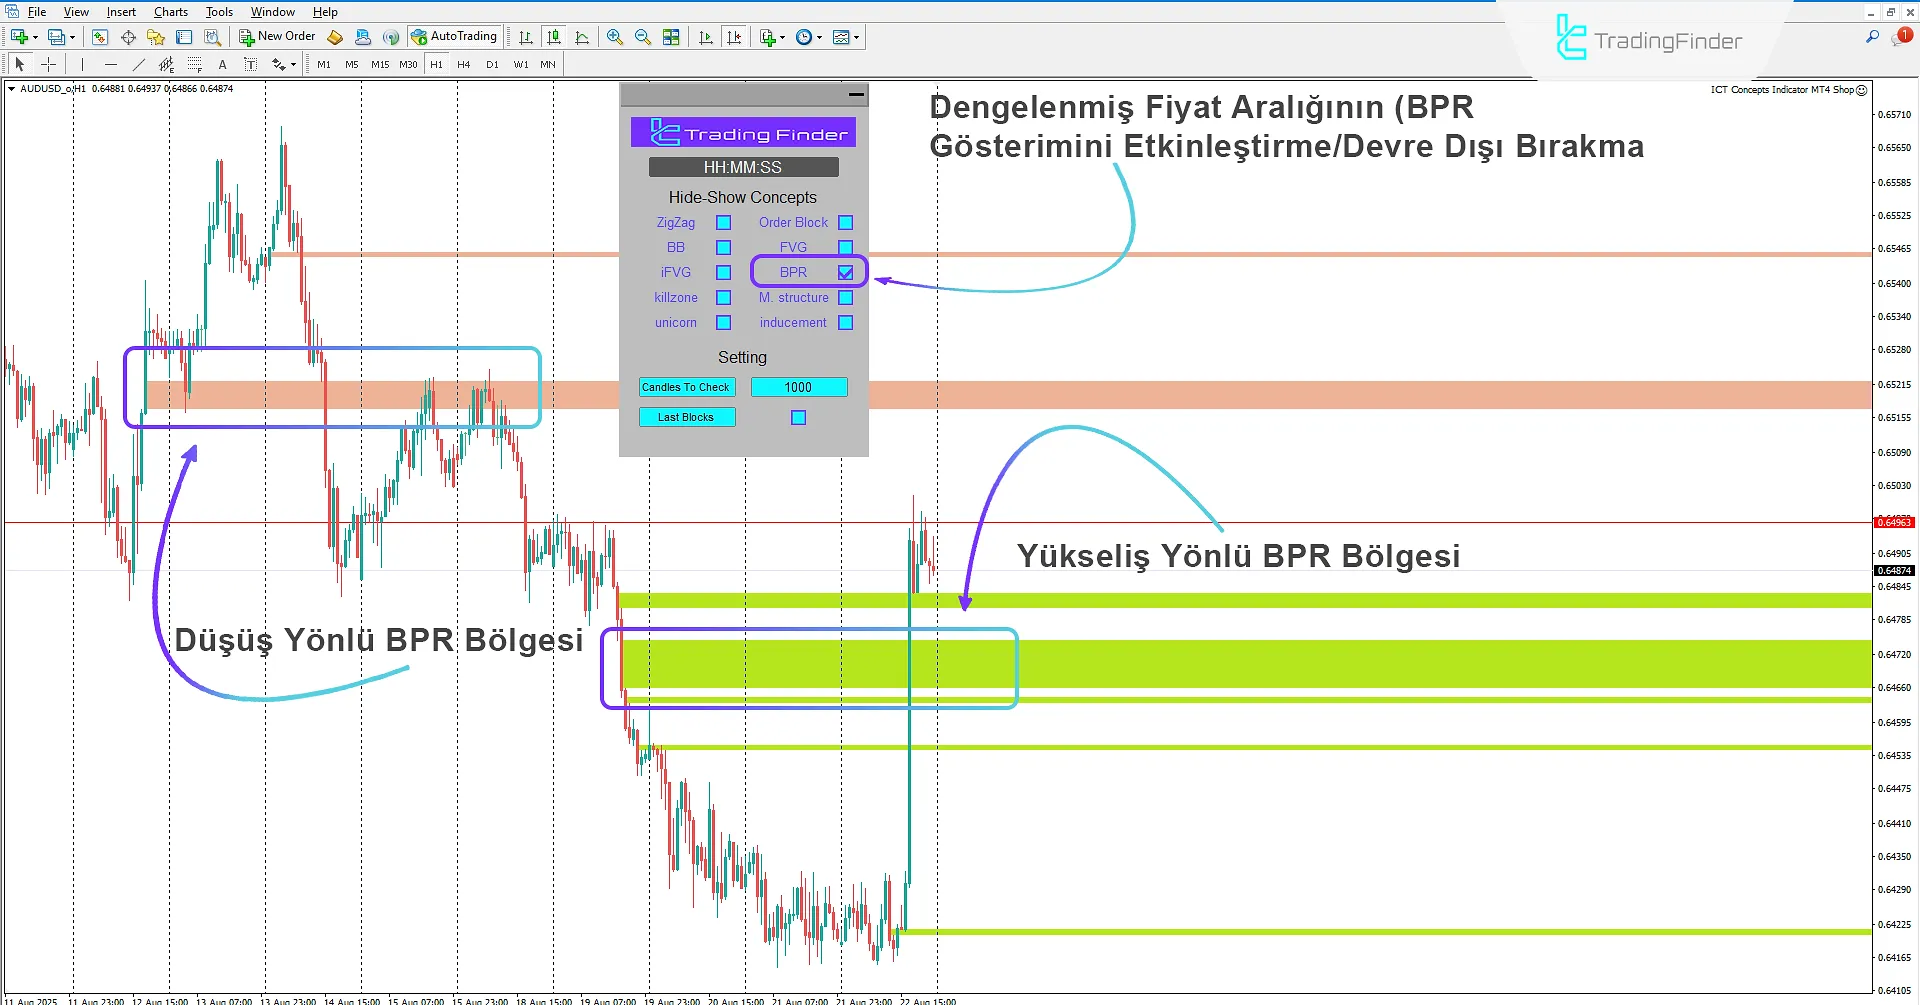
Balanced Price Range (BPR) Mode
In the ICT Concepts Indicator, enabling the FVG Overlap Zone mode allows traders to view shared areas between two opposing fair value gaps (one bullish and one bearish).
This overlapping zone, known as the Balanced Price Range (BPR), represents a price equilibrium area where supply and demand forces are relatively balanced. Identifying the intersection of these two opposing gaps creates a key level on the chart.
Traders can use these zones as optimal entry points. They are particularly important when confirmed on higher timeframes and may serve as reversal or continuation areas.
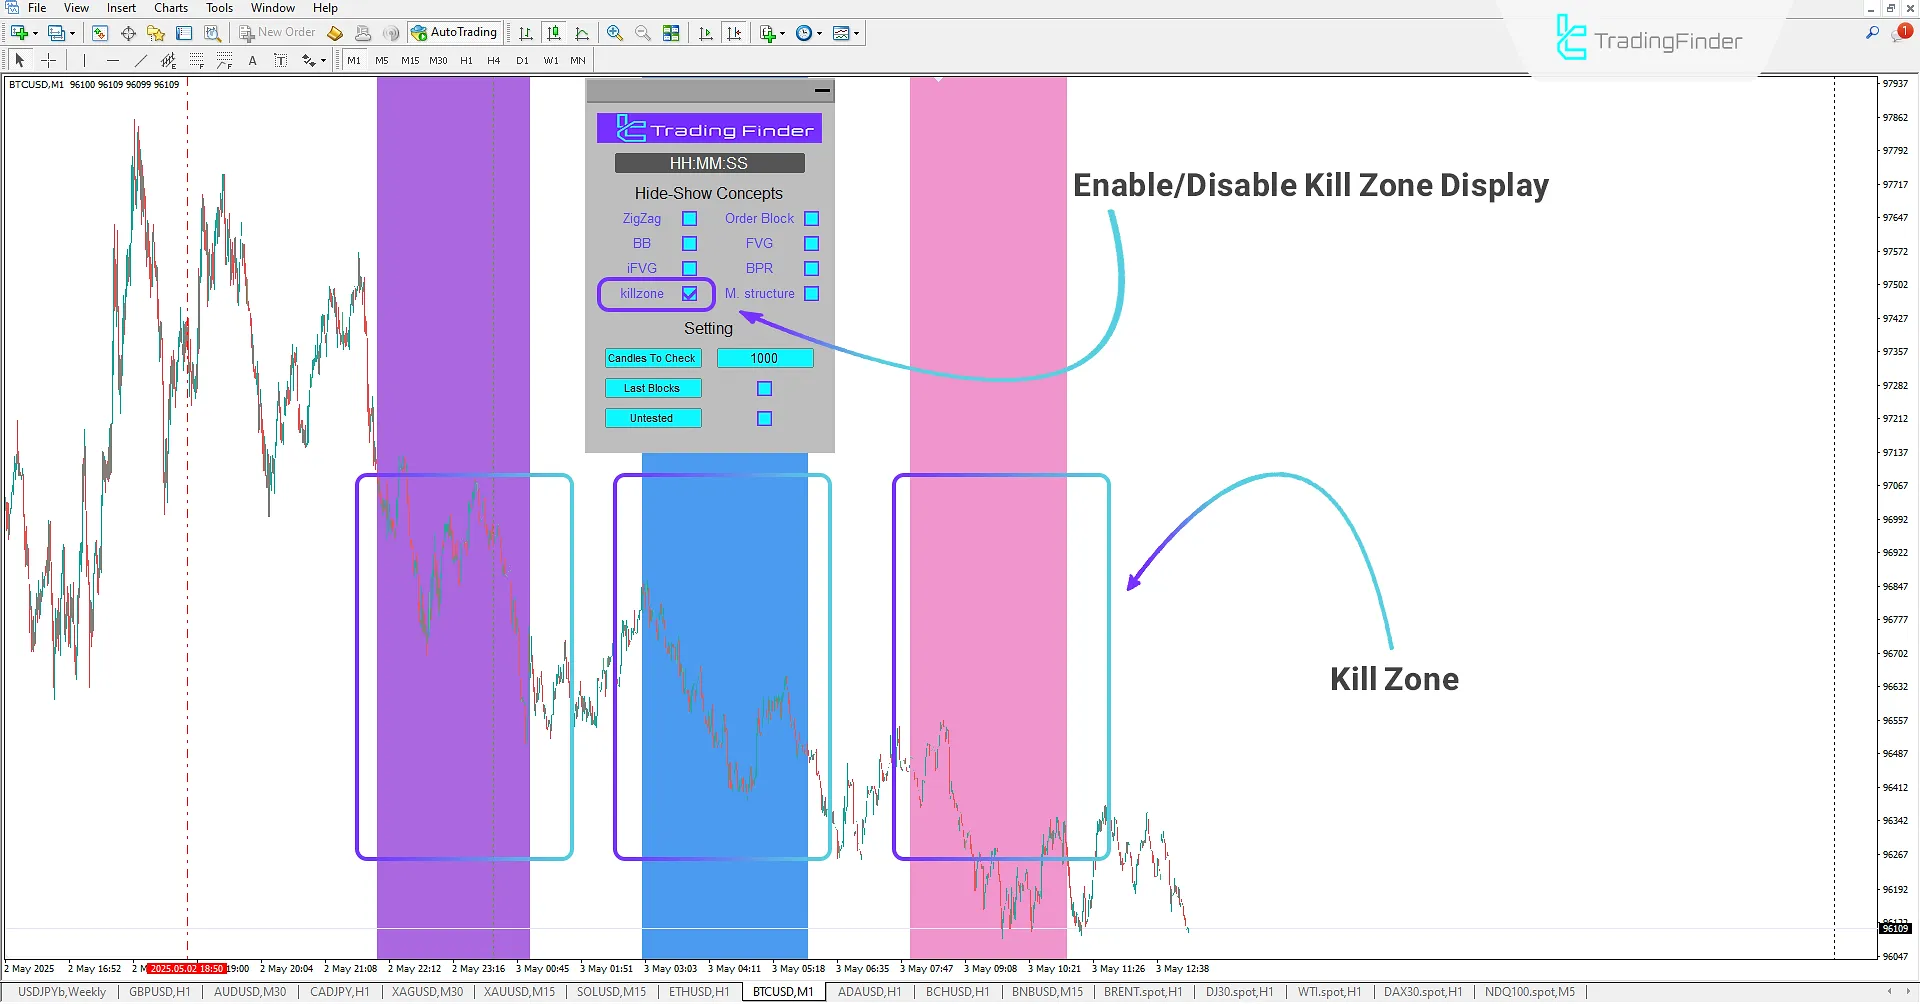
Kill Zone Mode
In financial markets, certain time intervals show the highest volatility and trading volume. These areas, known as Kill Zones, are especially important for ICT-style traders.
When the Kill Zone option is enabled in the ICT Concepts Indicator, users can observe these key time windows on the chart and identify high-probability trade setups.
Considering the Daily Bias and overall market trend, traders can apply ICT strategies such as Judas Swing, Silver Bullet, or Optimal Trade Entry (OTE) to enter trades during price reversals or breakouts within the Kill Zones.
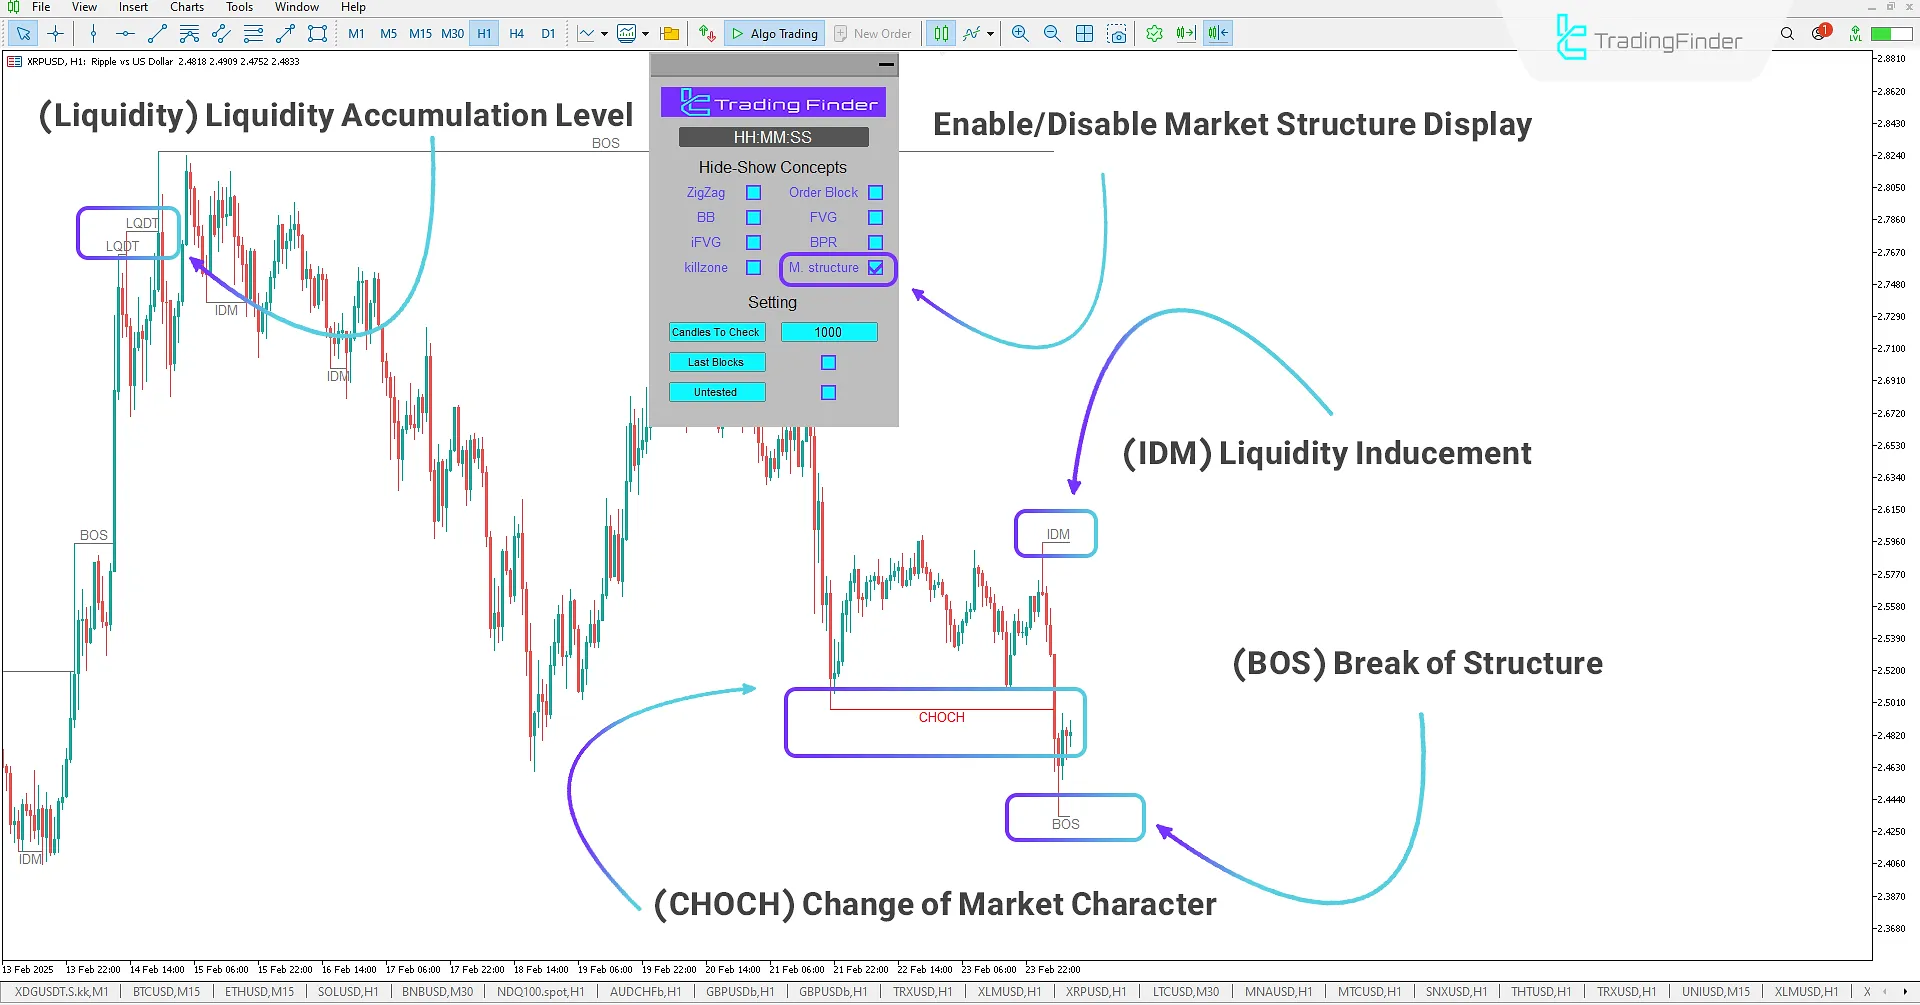
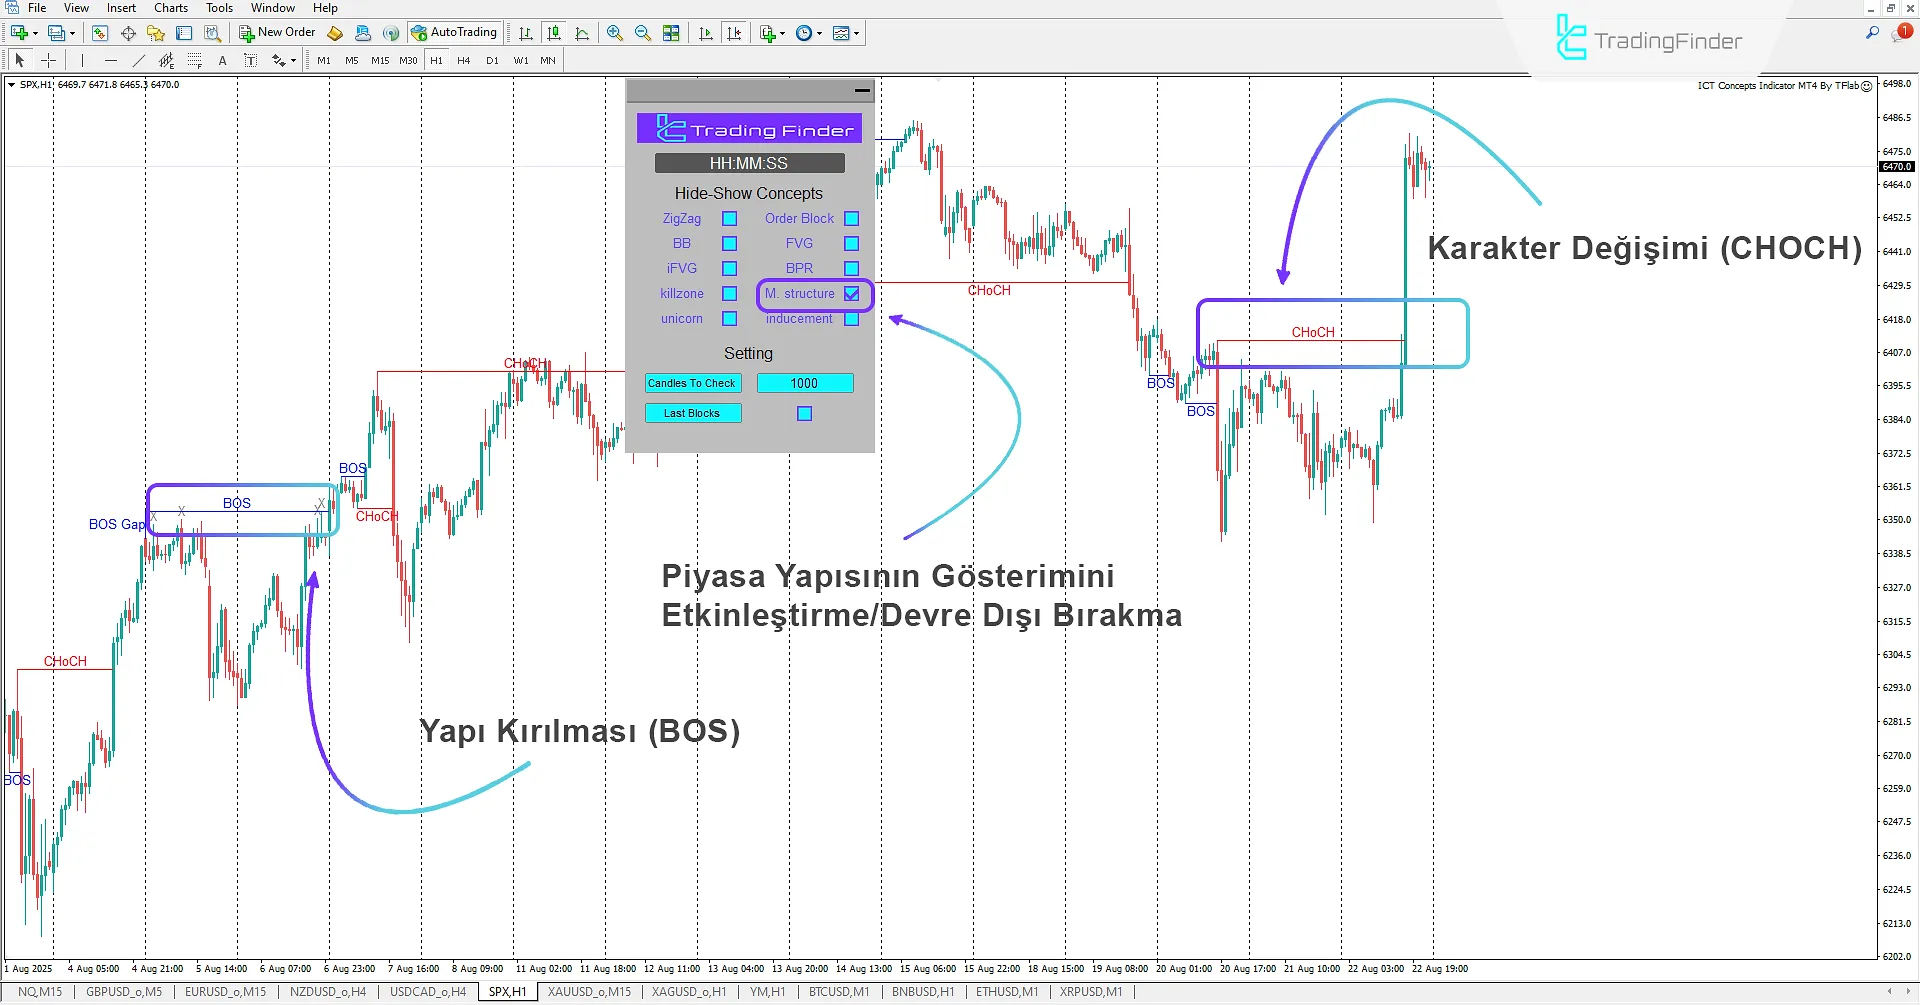
Market Structure (M Structure)
Traders seeking to understand price behavior and identify trend movements can use the Market Structure mode in theICT Concepts Indicator for a more specialized ICT-style analysis.
This feature allows traders to quickly recognize Change of Character (CHOCH) and identify Break of Structure (BOS) levels.
Additionally, simultaneous display of Liquidity Levels and Inducement Zones helps traders interpret price movements after liquidity collection or inducement, enabling them to plan low-risk, high-probability trades.
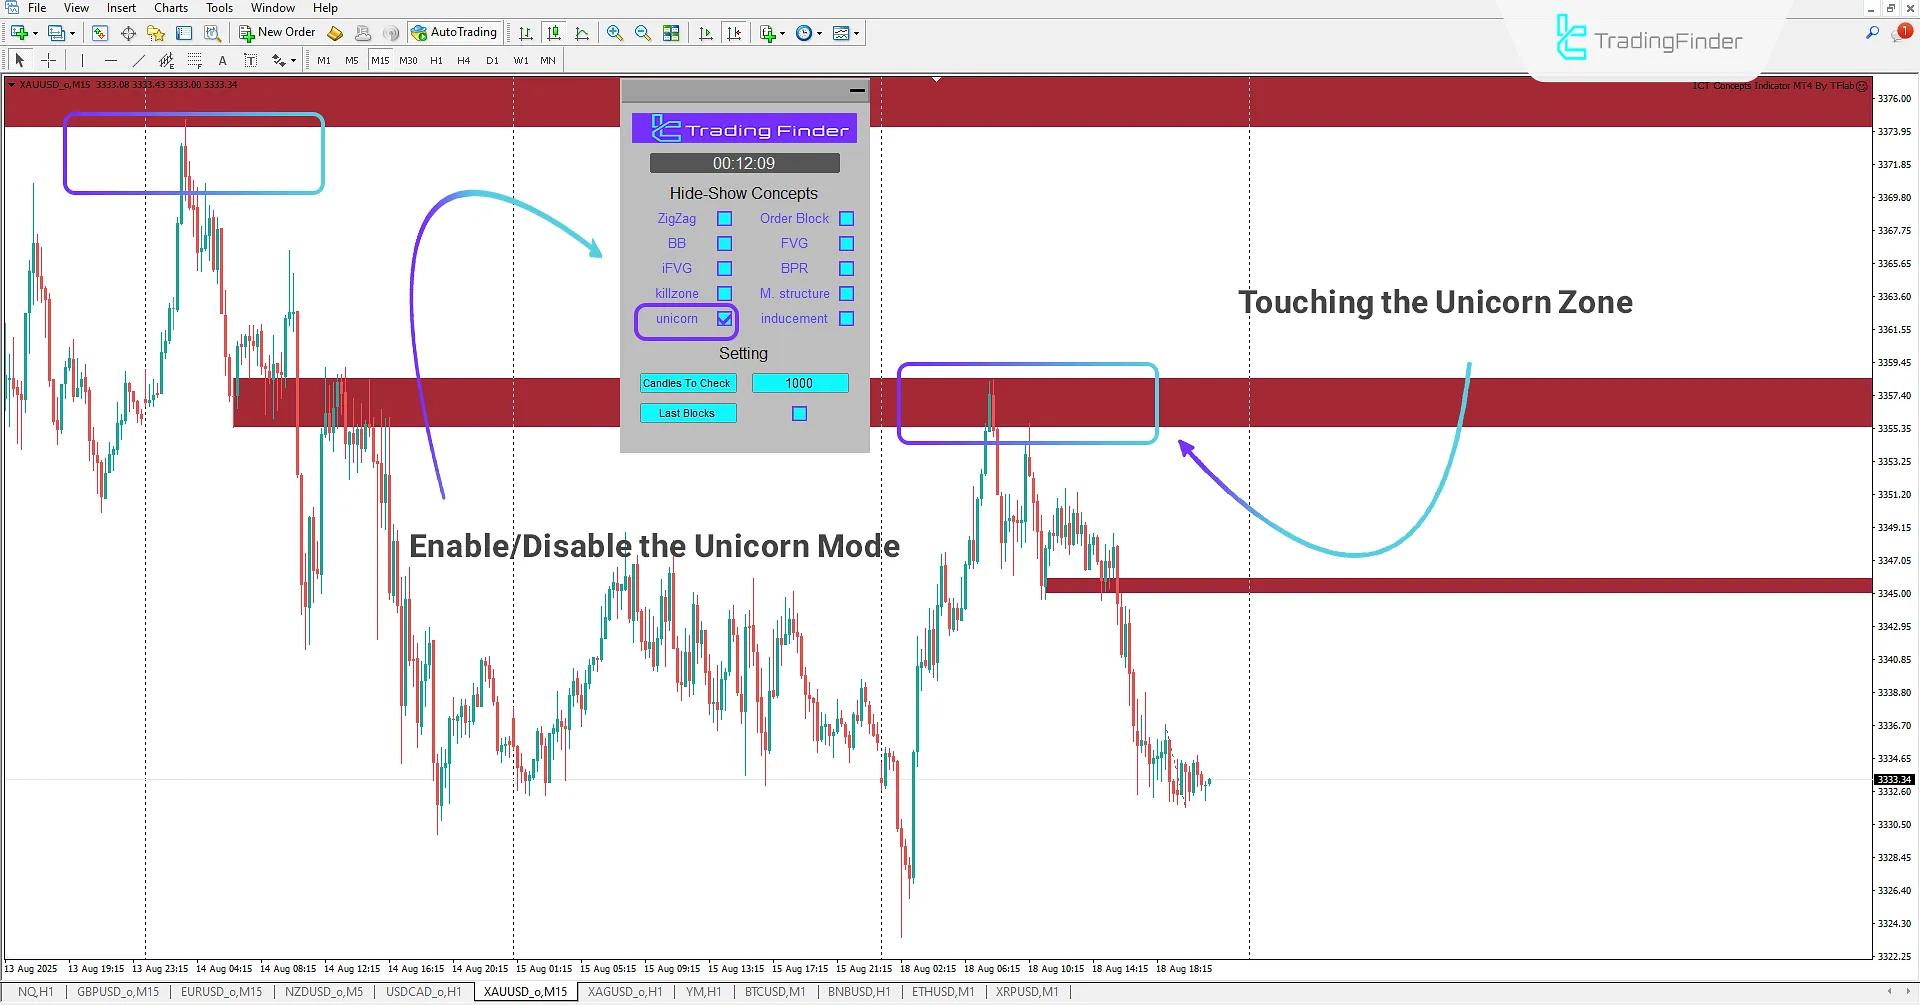
Unicorn Model
By enabling this option, the indicator identifies one of the powerful ICT-style patterns on the chart. The Unicorn Model provides conditions that allow traders to enter buy or sell positions using the specified ranges.
The functionality of this model is based on the structure of the Quasimodo (QM) pattern, with the difference that its trading zone is formed from the overlap between the Breaker Block zone and the Fair Value Gap (FVG) zone. As a result, when the price returns to this range, strong and significant reactions will occur in the market.
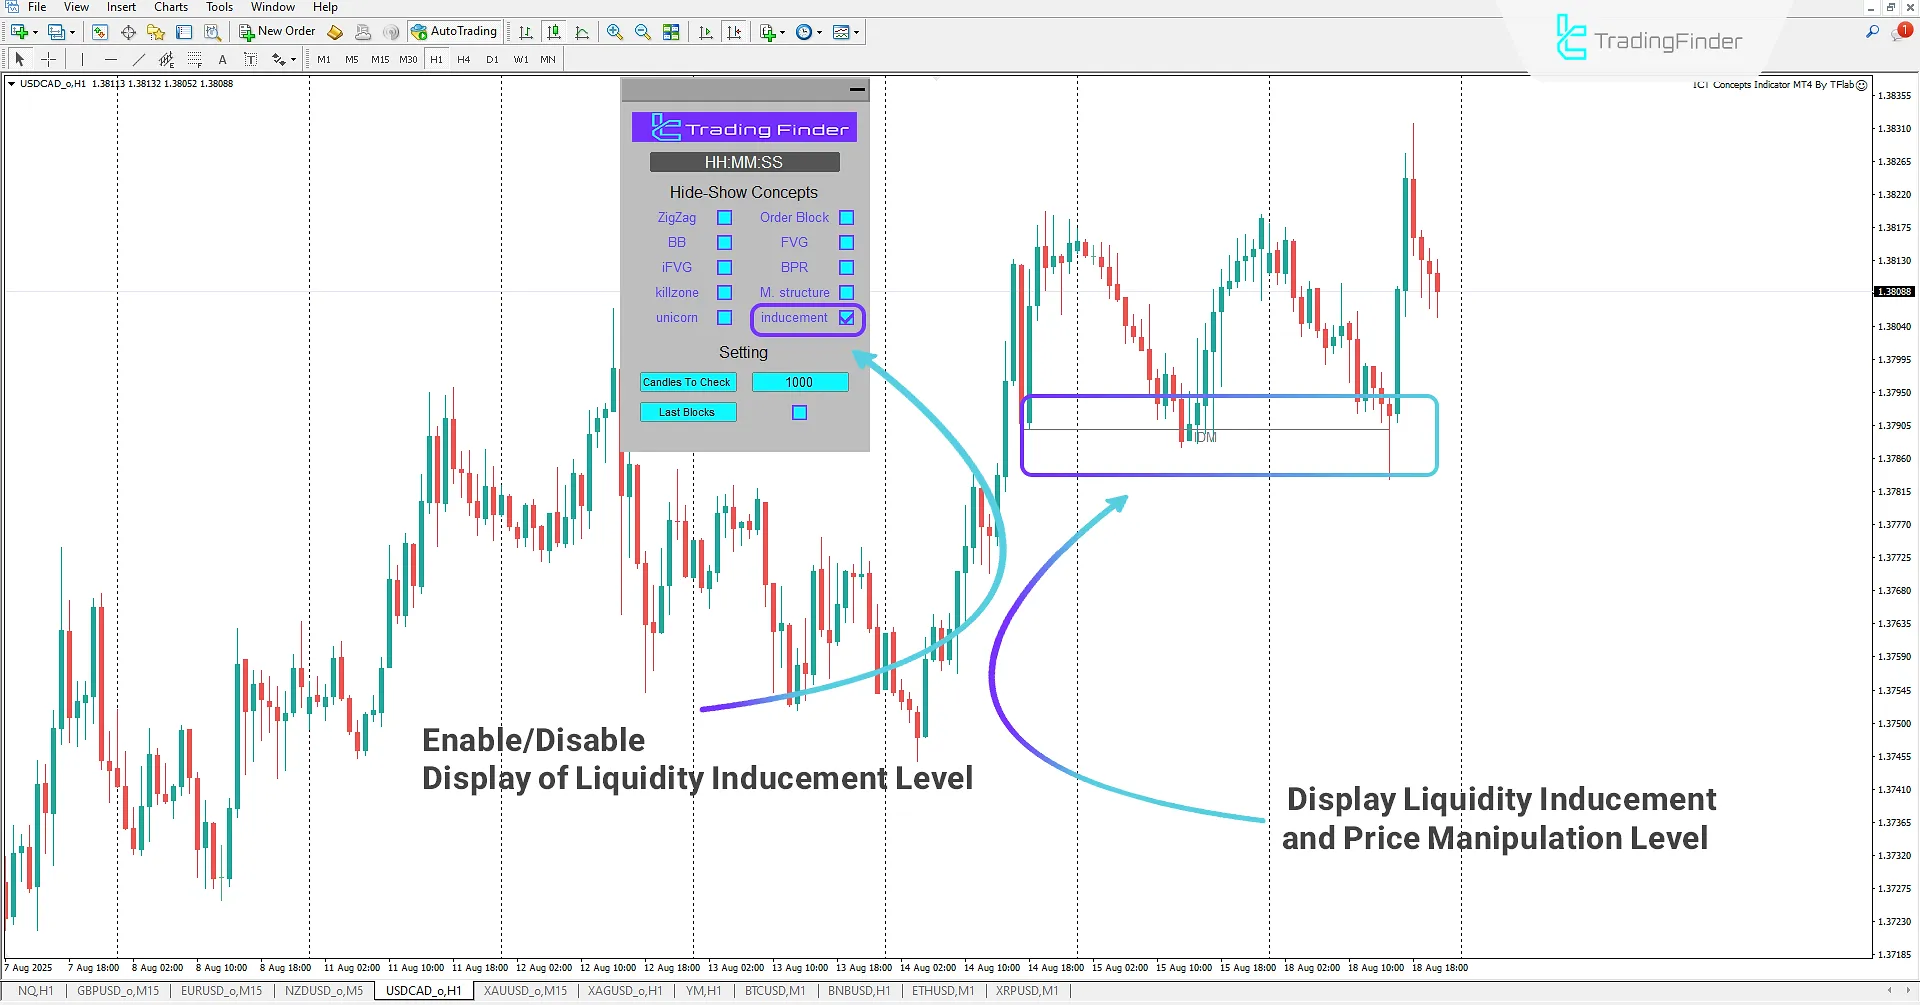
Identifying Liquidity Inducement
By enabling this feature, ICT-style traders can identify levels on the chart that indicate liquidity inducement and price manipulation. This capability allows traders to forecast potential price movements in a more professional and precise manner.
In this mode, levels can be observed where Smart Money seeks to accumulate liquidity and mislead retail traders. In this way, users can gain a better understanding of the next moves of institutions and banks, and accordingly, make more intelligent trading decisions.
ICT Concepts Indicator Settings
Below are the main configuration settings of the ICT Concepts Indicator:
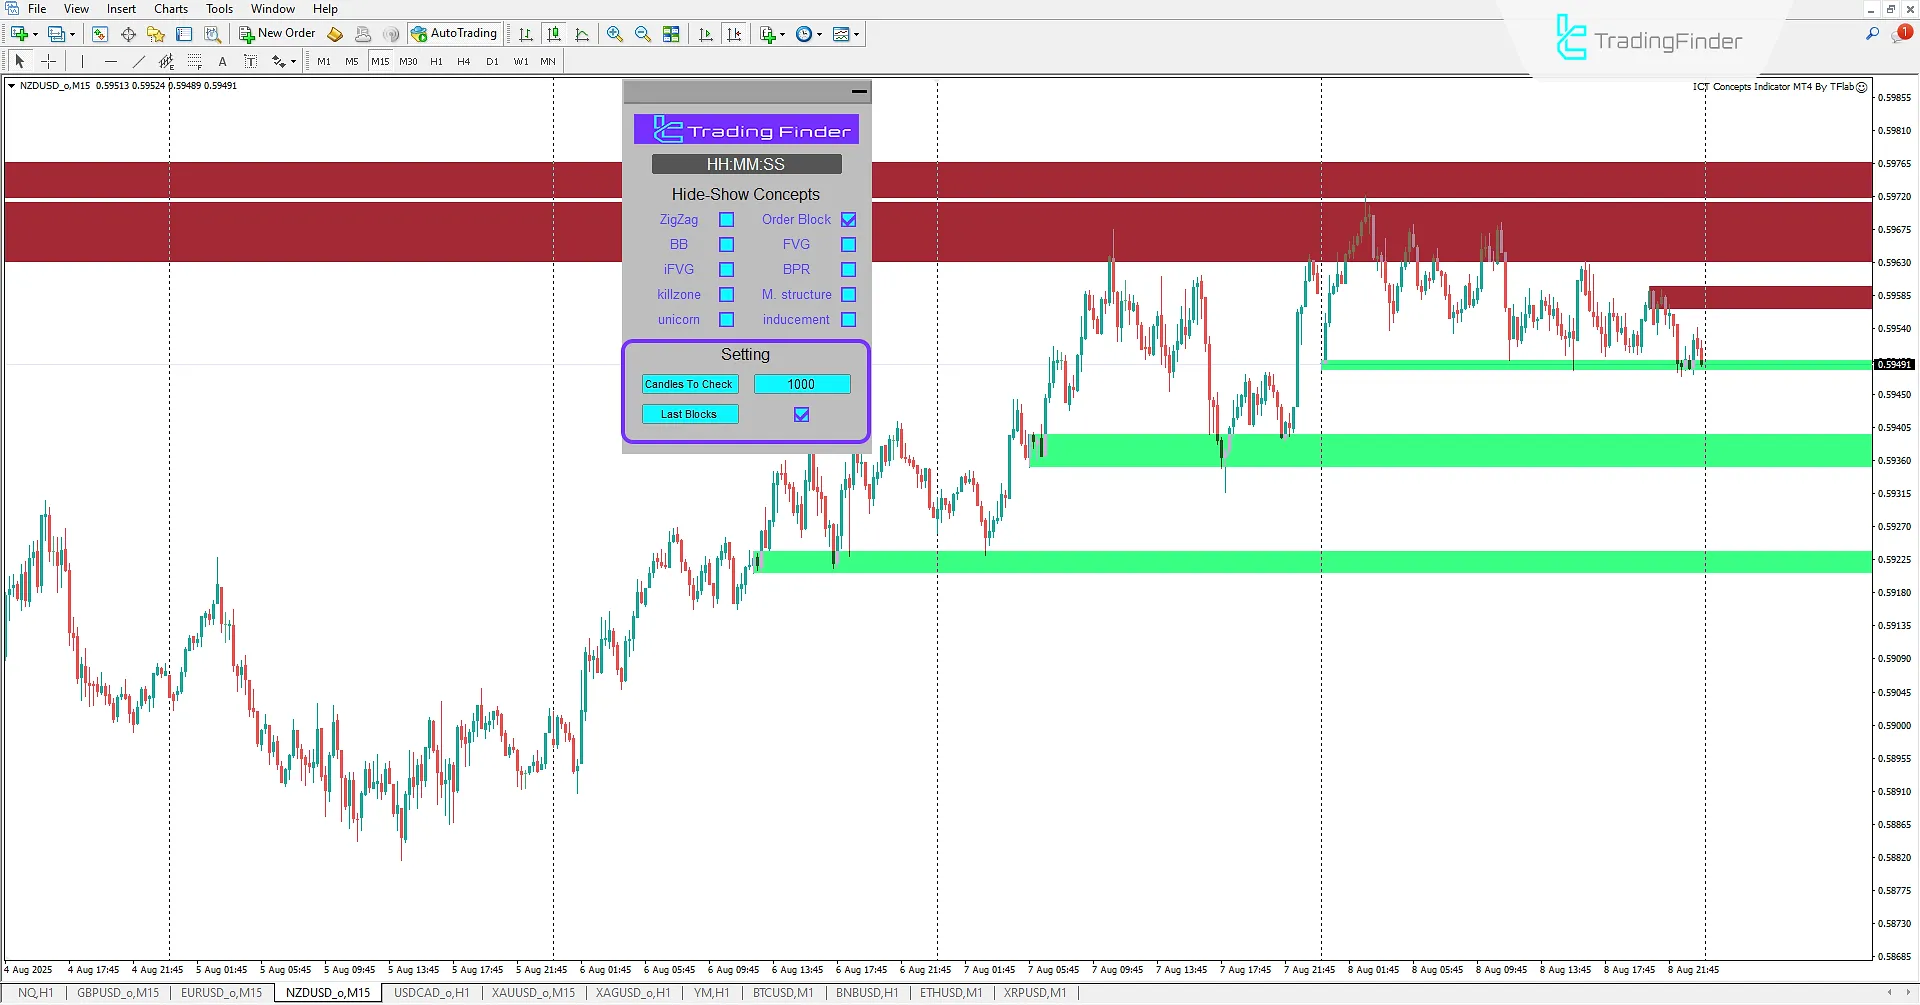
- Candles To Check: Defines the number of candles to scan and identify concepts
- Last Block: Enable/Disable the display of the latest zones
- Untested: Enable/Disable the display of untested zones
Conclusion
The ICT Concepts Indicator is a specialized and advanced tool for technical analysts, ICT-style traders, and Smart Money practitioners. It enables deep analysis based on key concepts of these styles.
This indicator allows users to better understand market trends and price actions and identify optimal trade opportunities.
It is designed to provide deeper insights into market behavior, enabling traders to identify Order Blocks more precisely, track the footprints of Smart Money, institutions, and banks, and apply ICT-style strategies to define accurate entry and exit points.
ICT Concepts MT4 PDF
ICT Concepts MT4 PDF
Click to download ICT Concepts MT4 PDFWhat is the ICT Concepts Indicator, and which platform is it for?
The ICT Concepts Indicator is an advanced professional tool designed for the MetaTrader 4 platform. It provides a comprehensive suite of ICT and Smart Money concepts through a user panel.
What concepts does this indicator provide to traders?
It offers access to Order Blocks, Fair Value Gap (FVG), Breaker Block, Market Structure, and Kill Zones for ICT-style analysis.
What customization options does the settings panel offer?
The advanced settings panel allows users to customize the display of each concept. Traders can activate or deactivate analytical elements like order blocks, market structure, or fair value gaps based on their preferences.
How is Market Structure analyzed?
By enabling this feature, traders can detect Change of Character (CHOCH) and Break of Structure (BOS) levels. They can also monitor Liquidity and Inducement Zones to better interpret trend continuation or reversal after liquidity events.
I installed ICT Concepts in my MT4 platform but having problems. The only concepts that appear on my screen is ZIGZAG and M Structue, none of the other concepts draw any rectangle blocks on my chart. I tried all time frames but still no joy. I followed the setup instructions to the letter, I even uninstalled MT4 but the problem persists. Can you please help Regards Chris

Please review the usage guide carefully. The indicator’s output depends on market conditions, the traded symbol, and the time frame. If the problem continues, you can contact support via the online chat for further assistance.
Is it repaiting indicator?
At the following link, you have the ability to access and use non-repainting indicators for MT5 and MT4. https://tradingfinder.com/products/indicators/mt5/nonrepaint/
This looks cool. Thank you for the awesome innovation..


