![ICT Seek and Destroy Profile Friday Indicator MT4 Free Download [TFlab]](https://cdn.tradingfinder.com/image/461045/2-107-en-ict-seek-destroy-profile-friday-mt4.webp)
![ICT Seek and Destroy Profile Friday Indicator MT4 Free Download [TFlab] 0](https://cdn.tradingfinder.com/image/461045/2-107-en-ict-seek-destroy-profile-friday-mt4.webp)
![ICT Seek and Destroy Profile Friday Indicator MT4 Free Download [TFlab] 1](https://cdn.tradingfinder.com/image/461051/2-107-en-ict-seek-destroy-profile-friday-mt4-2.webp)
![ICT Seek and Destroy Profile Friday Indicator MT4 Free Download [TFlab] 2](https://cdn.tradingfinder.com/image/461052/2-107-en-ict-seek-destroy-profile-friday-mt4-3.webp)
The ICT Seek & Destroy Profile Friday Indicator is designed based on the breakout of the Asian session range by the London session. Its goal is to identify potential Seek & Destroy (S&D) days.
This trading tool analyzes whether the London session completely covers the price range of the Asian session (from high to low).
If this condition is met, the label "Potential S&D Day" is automatically displayed on the chart. Additionally, trading sessions are distinguished on the chart as follows:
- Asian Session (Blue Box);
- London Session (Gray Box);
- New York Session (Green Box).
ICT Seek and Destroy Profile Friday Indicator Table
The general specifications of the ICT Seek & Destroy Profile Friday indicator are presented in the table below:
Indicator Categories: | ICT MT4 Indicators Smart Money MT4 Indicators Currency Strength MT4 Indicators |
Platforms: | MetaTrader 4 Indicators |
Trading Skills: | Intermediate |
Indicator Types: | Breakout MT4 Indicators Reversal MT4 Indicators |
Timeframe: | Multi-Timeframe MT4 Indicators |
Trading Style: | Intraday MT4 Indicators |
Trading Instruments: | Share Stocks MT4 Indicators Indices Market MT4 Indicators Commodity Market MT4 Indicators Stock Market MT4 Indicators Cryptocurrency MT4 Indicators Forex MT4 Indicators |
Overview of the ICT Seek & Destroy Profile Friday Indicator
The ICT Seek & Destroy Indicator defines the Asian session price range. It evaluates the simultaneous breakout of its high and low during the London session to assess the potential formation of a liquidity-drivenSeek & Destroy pattern.
If these conditions are met, the indicator is activated in the New York session and displays an alert on the chart under one of the following scenarios:
- Price returns to the London range;
- The entire New York session remains within the London range.
- The New York range fully engulfs the London range.
In such cases, the indicator marks the event on the chart as an "S&D Valid Day."
Indicator in an Uptrend
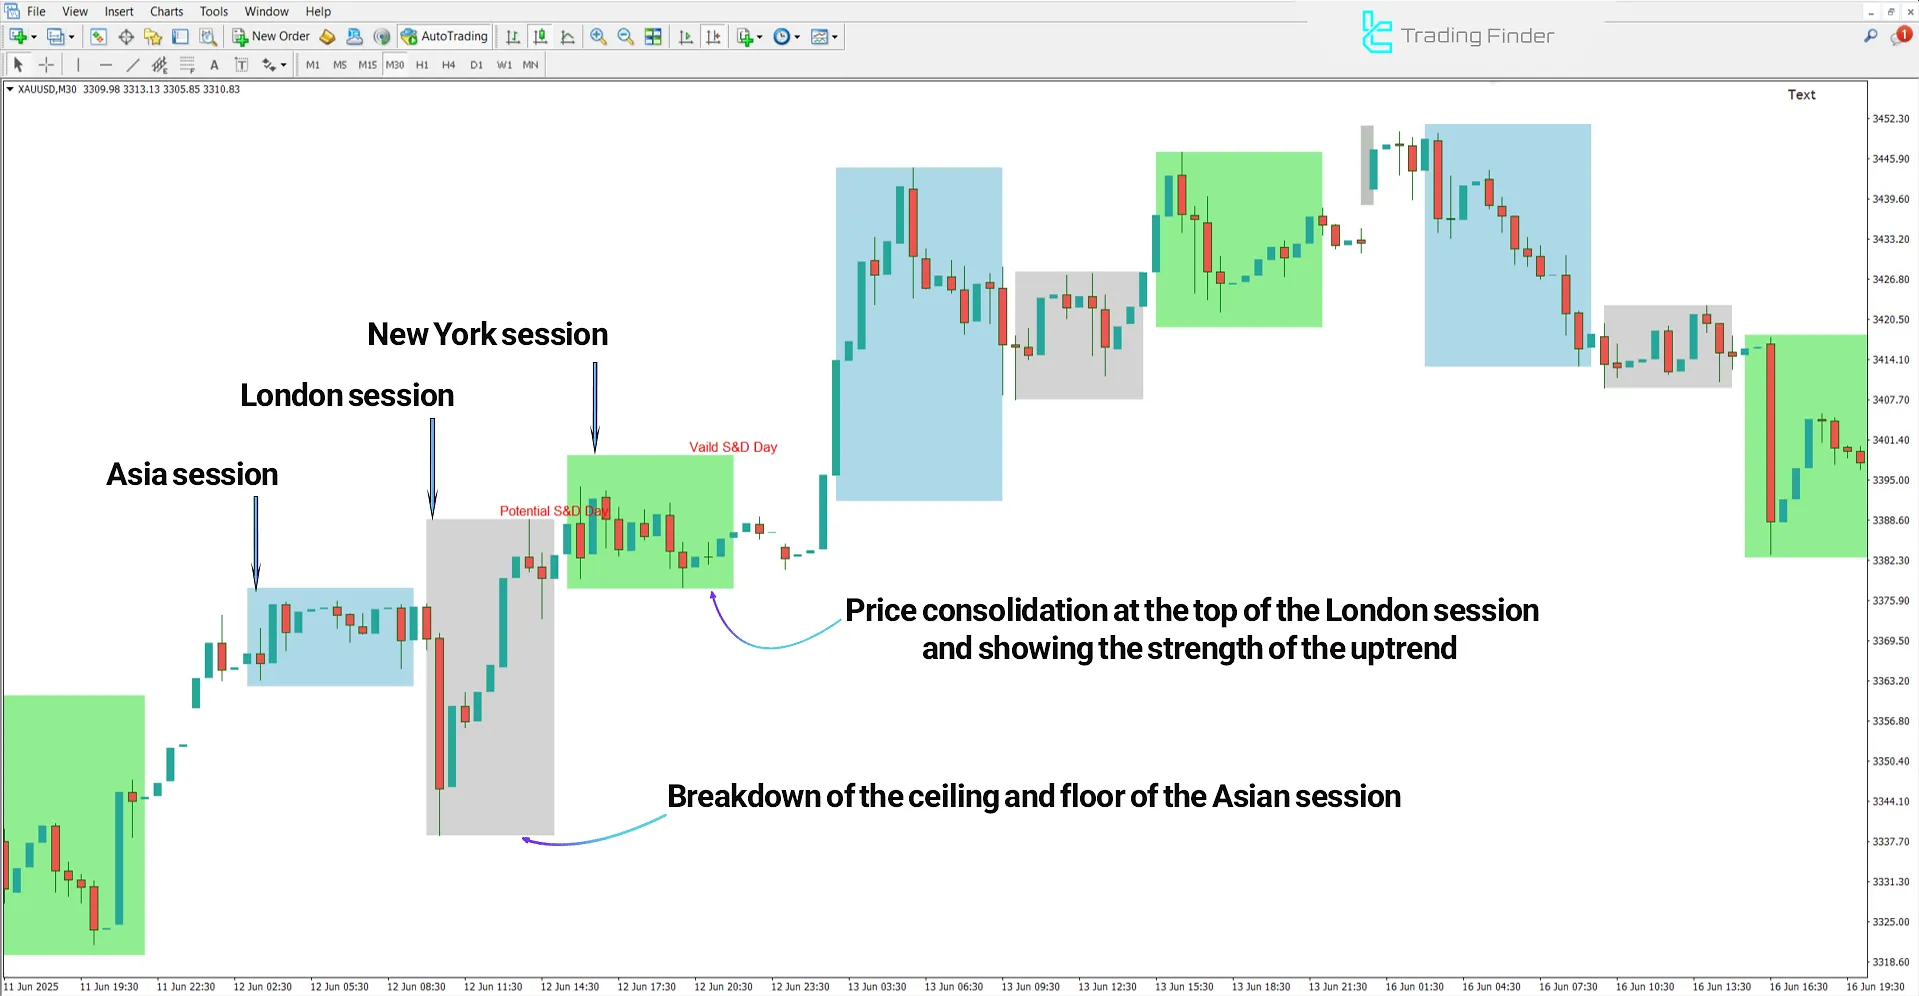
The following price chart shows the Gold (XAU/USD) index on the 30-minute timeframe.
In a bullish trend, if the London session breaks the low first, then the high of the Asian session, the indicator triggers a high volatility warning in the New York session.
Under these conditions, if price stabilizes above the London high during the New York session, the bullish trend strength and a potential buy zone are highlighted.

Indicator in a Downtrend
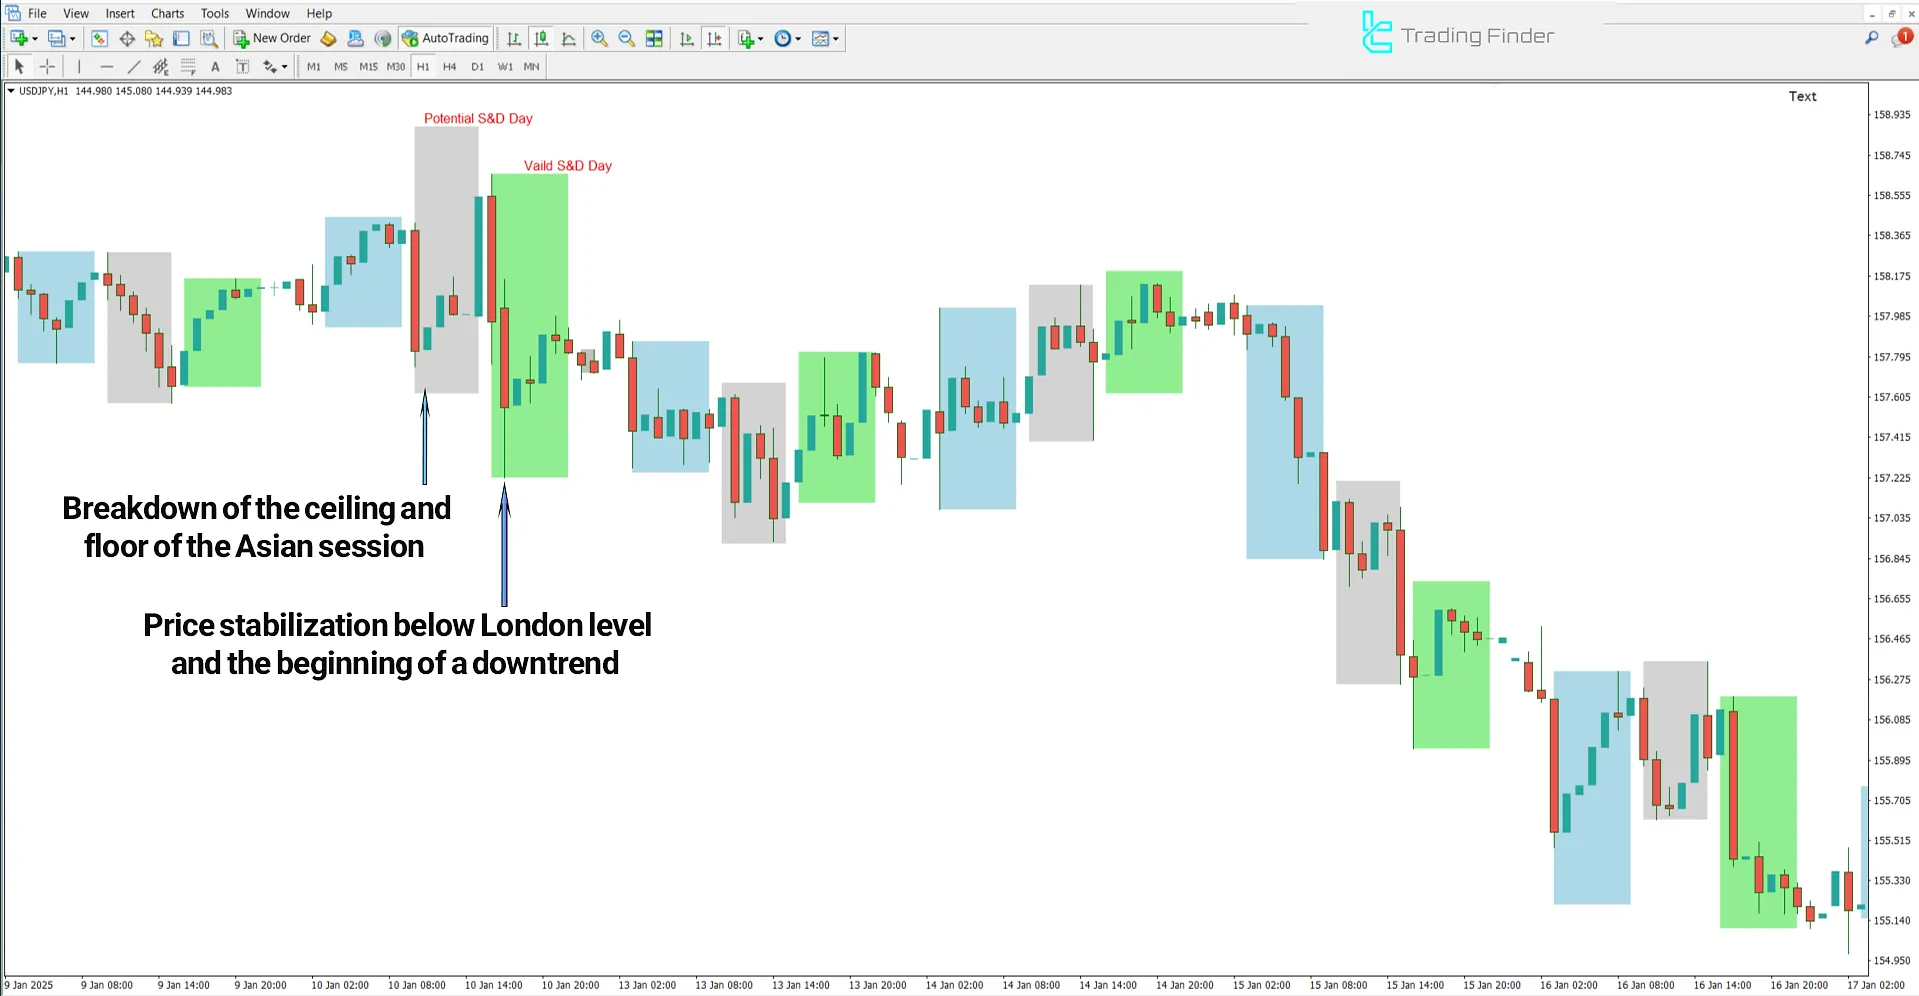
The following image displays the USD/JPY pair on the 1-hour timeframe.
In a bearish trend, if the London session first breaks the Asian high and then swiftly reverses to break the Asian low, this indicates a liquidity grab from buyers before a downward phase begins.
In this scenario, if price stabilizes below the London low during the New York session and the closing candles remain below the London range, the trading day is considered a valid bearish S&D day.

Conclusion
The ICT Seek & Destroy Profile Friday Indicator is a specialized tool designed to identify volatile days in the New York session, based on price action during the Asian and London sessions.
During the London session, if both the high and low of the Asian session are broken, the indicator issues a "Potential S&D Day" alert.
ICT Seek & Destroy Profile Friday MT4 PDF
ICT Seek & Destroy Profile Friday MT4 PDF
Click to download ICT Seek & Destroy Profile Friday MT4 PDFWho is the ICT Seek & Destroy Profile Friday Indicator suitable for?
This trading tool is ideal for traders who operate based on liquidity, price action, and market session timings.
What are the characteristics of the ICT Seek & Destroy Profile Friday Indicator in a bullish trend?
In a bullish trend, the London session first breaks the Asian low, then the high. If the New York session stabilizes above the London high, the market enters a bullish phase.


