![Implied Fair Value Gap Indicator MT4 Download - Free - [Trading Finder]](https://cdn.tradingfinder.com/image/164978/13-33-en-impliedfvg-mt4-1.webp)
![Implied Fair Value Gap Indicator MT4 Download - Free - [Trading Finder] 0](https://cdn.tradingfinder.com/image/164978/13-33-en-impliedfvg-mt4-1.webp)
![Implied Fair Value Gap Indicator MT4 Download - Free - [Trading Finder] 1](https://cdn.tradingfinder.com/image/164977/13-33-en-impliedfvg-mt4-2.webp)
![Implied Fair Value Gap Indicator MT4 Download - Free - [Trading Finder] 2](https://cdn.tradingfinder.com/image/165005/13-33-en-impliedfvg-mt4-3.webp)
![Implied Fair Value Gap Indicator MT4 Download - Free - [Trading Finder] 3](https://cdn.tradingfinder.com/image/164991/13-33-en-impliedfvg-mt4-4.webp)
Implied FVG Indicator for MT4 is designed based on the ICT trading style. This tool, identifies price gaps that are not visible on the chart.
This MT4 ICT indicator considers two hypothetical lines at 50% of the shadows of adjacent candles for each middle candle; the area between these hypothetical lines is termed the hidden fair value gap.
If one of the adjacent shadows completely overlaps the other, a hidden fair value gap does not form.
Indicator Specifications Table
Indicator Categories: | ICT MT4 Indicators Smart Money MT4 Indicators Liquidity MT4 Indicators |
Platforms: | MetaTrader 4 Indicators |
Trading Skills: | Advanced |
Indicator Types: | Reversal MT4 Indicators |
Timeframe: | Multi-Timeframe MT4 Indicators |
Trading Style: | Intraday MT4 Indicators Scalper MT4 Indicators |
Trading Instruments: | Share Stocks MT4 Indicators Forward Market MT4 Indicators Commodity Market MT4 Indicators Stock Market MT4 Indicators Cryptocurrency MT4 Indicators Forex MT4 Indicators |
Implied FVG Indicator Overview
The Implied Fair Value Gap is similar to the "FVG" but with a key difference a typical FVG forms when, across three candles, the gap between the first and third candles is not covered by the price.
However, a hidden fair value gap forms when this gap is covered only by the shadows of the adjacent candles.
Indicator Performance in an Uptrend
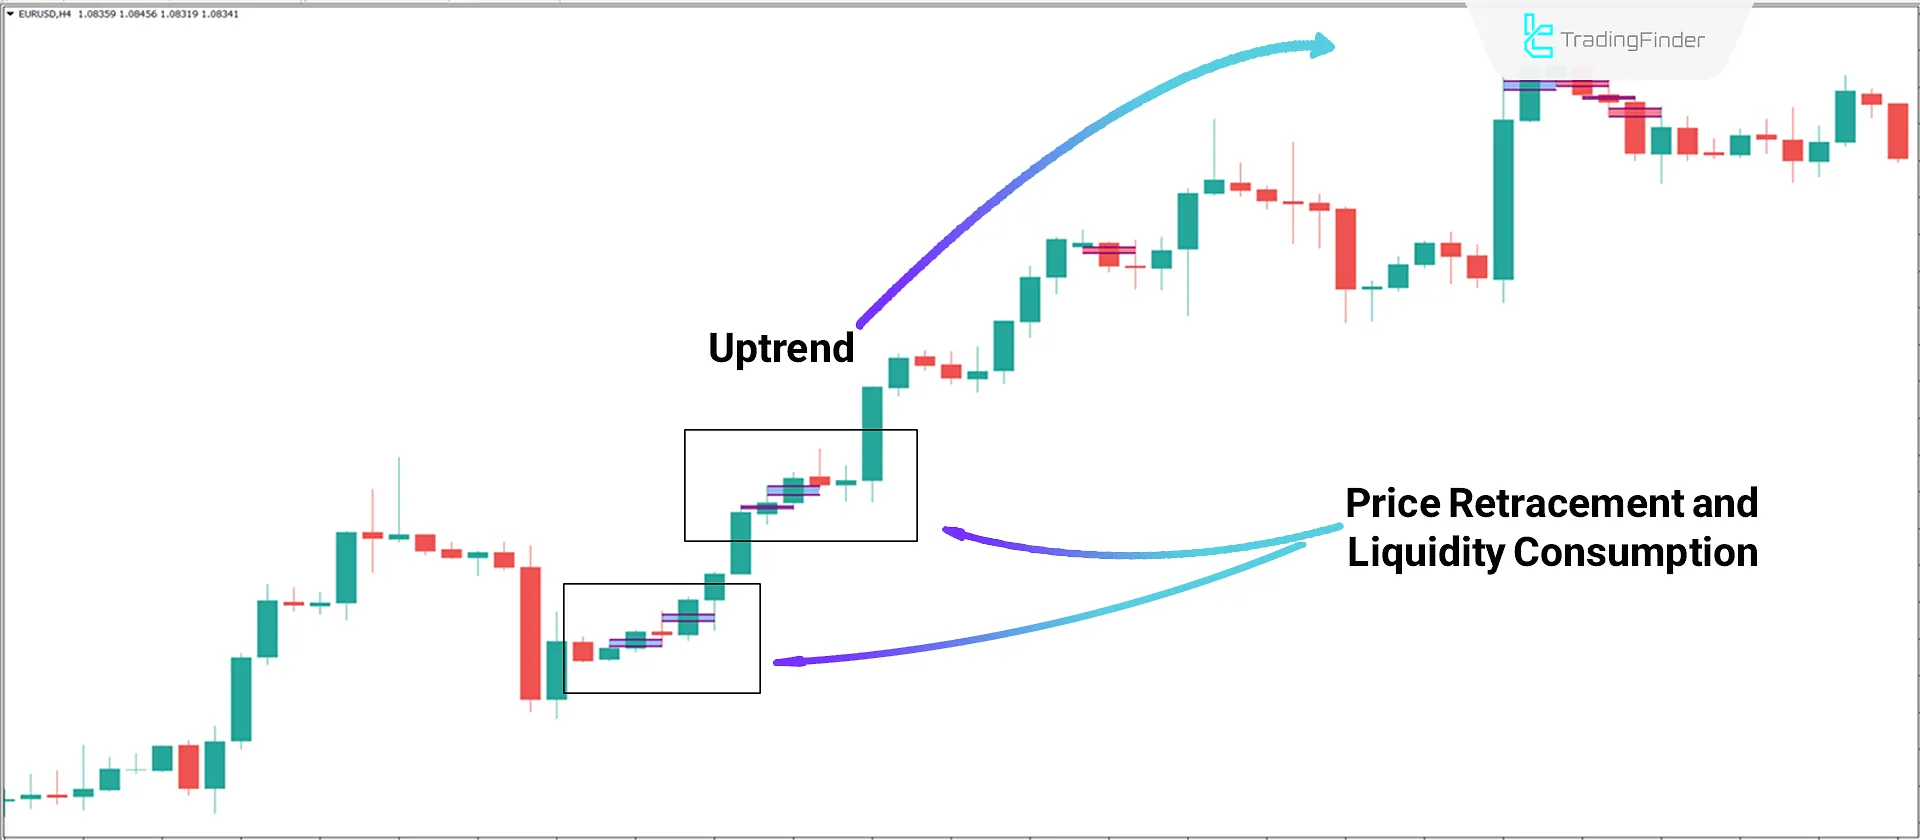
According to the 4-hour price chart of the EUR/USD currency pair, the indicator identifies areas of implied fair value gaps and marks them as purple boxes on the chart.
The image shows that the price becomes bullish after penetrating the "Implied FVG" and consuming liquidity.

Implied FVG Indicator in a Downtrend
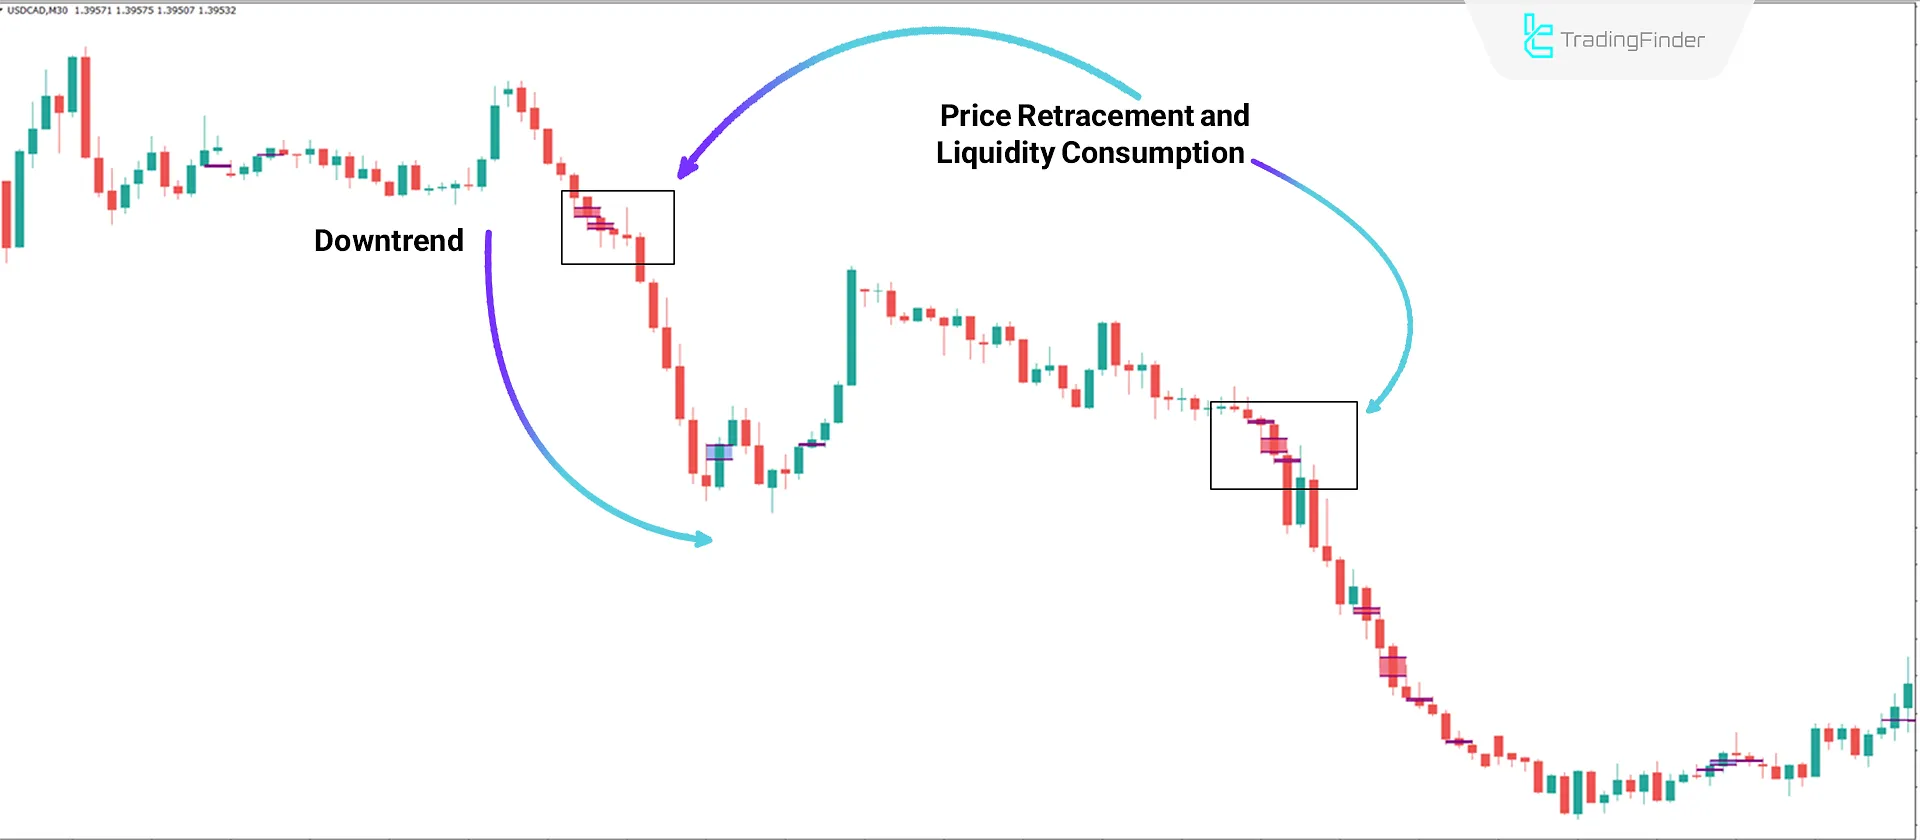
According to the 30-minute price chart of the USD/CAD currency pair, the indicator identifies areas of implied fair value gaps and marks them as pink boxes on the chart.
The image shows that the price becomes bearish after penetrating the "Implied FVG" and consuming liquidity.

Indicator Settings

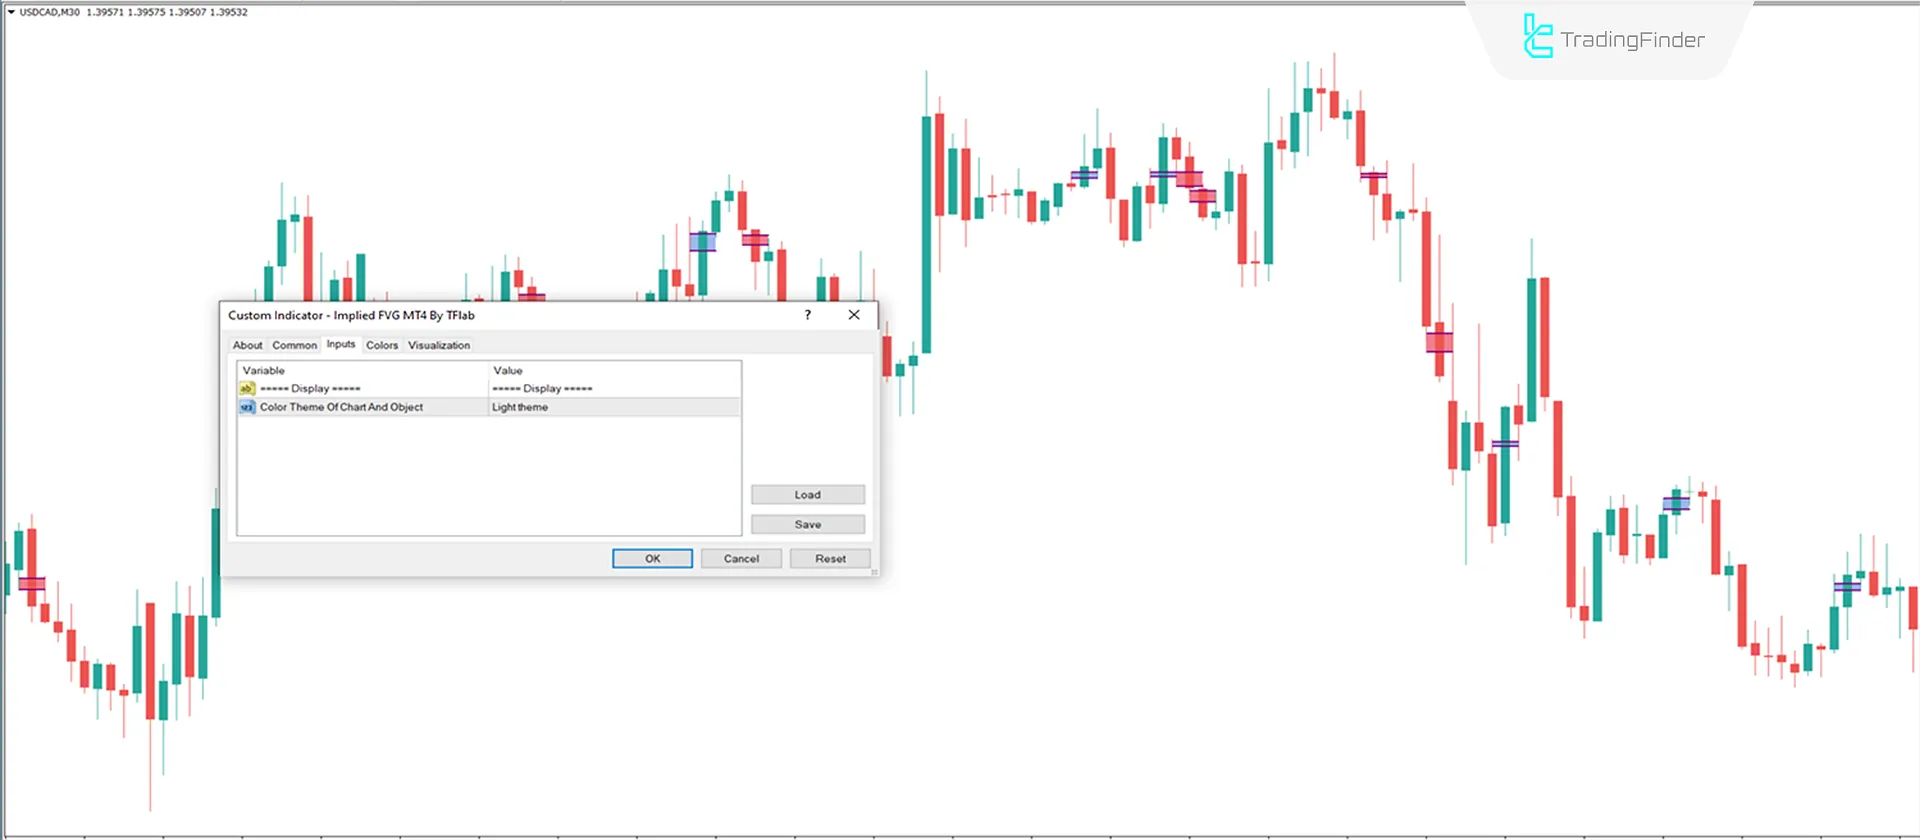
- Theme: Indicator theme.
Conclusion
The areas marked by the Implied Fair Value Gap indicator closely resemble FVGs, with one difference FVGs represent the gap between two adjacent candles, whereas "Implied FVG" forms from the 50% overlap of the shadows of two adjacent candles.
Implied Fair Value Gap MT4 PDF
Implied Fair Value Gap MT4 PDF
Click to download Implied Fair Value Gap MT4 PDFHow can this indicator be used for trade entries?
The areas marked by this indicator have high liquidity, making them key points for trend reversals.
Which trading markets is this indicator suitable for?
This tool is suitable for all trading markets without any restrictions.


