![Keltner Channel Indicator for MetaTrader 4 Download – Free – [TradingFinder]](https://cdn.tradingfinder.com/image/116912/11-34-en-keltner-channel-mt4.webp)
![Keltner Channel Indicator for MetaTrader 4 Download – Free – [TradingFinder] 0](https://cdn.tradingfinder.com/image/116912/11-34-en-keltner-channel-mt4.webp)
![Keltner Channel Indicator for MetaTrader 4 Download – Free – [TradingFinder] 1](https://cdn.tradingfinder.com/image/116627/11-34-en-keltner-channel-mt4-02.webp)
![Keltner Channel Indicator for MetaTrader 4 Download – Free – [TradingFinder] 2](https://cdn.tradingfinder.com/image/116604/11-34-en-keltner-channel-mt4-03.webp)
![Keltner Channel Indicator for MetaTrader 4 Download – Free – [TradingFinder] 3](https://cdn.tradingfinder.com/image/116626/11-34-en-keltner-channel-mt4-05.webp)
On July 22, 2025, in version 2, alert/notification and signal functionality was added to this indicator
The Keltner Channel Indicator is part of the MetaTrader 4 indicator series that identifies the direction of the trend. This channel is a technical analysis tool developed by Chester Keltner.
The indicator helps traders recognize the primary price trend using the Moving Average and the ATR Indicator.
It plots two bands above and below the price, offering traders potential entry and exit points. The Keltner Channel consists of a blue dashed line (20-period EMA) and two red bands derived from the Average True Range (ATR).
Keltner Channel Indicator Table
Indicator Categories: | Volatility MT4 Indicators Trading Assist MT4 Indicators Bands & Channels MT4 Indicators |
Platforms: | MetaTrader 4 Indicators |
Trading Skills: | Elementary |
Indicator Types: | Breakout MT4 Indicators Reversal MT4 Indicators |
Timeframe: | Multi-Timeframe MT4 Indicators |
Trading Style: | Day Trading MT4 Indicators Intraday MT4 Indicators Scalper MT4 Indicators |
Trading Instruments: | Share Stocks MT4 Indicators Forward Market MT4 Indicators Indices Market MT4 Indicators Commodity Market MT4 Indicators Stock Market MT4 Indicators Cryptocurrency MT4 Indicators Forex MT4 Indicators |
Keltner Channel Indicator at a Glance
Given the importance of identifying the trend direction and trading in line with it, the Keltner Channel uses the 20-period Exponential Moving Average (EMA) to indicate the future trend direction. It offers traders entry points that are in line with the trend.
The Keltner Channel utilizes price averaging and market volatility measured by the ATR Indicator. When the price breaks above or below the channel's bands, it signals the strength of the trend direction.
 Gold (XAU/USD) price chart
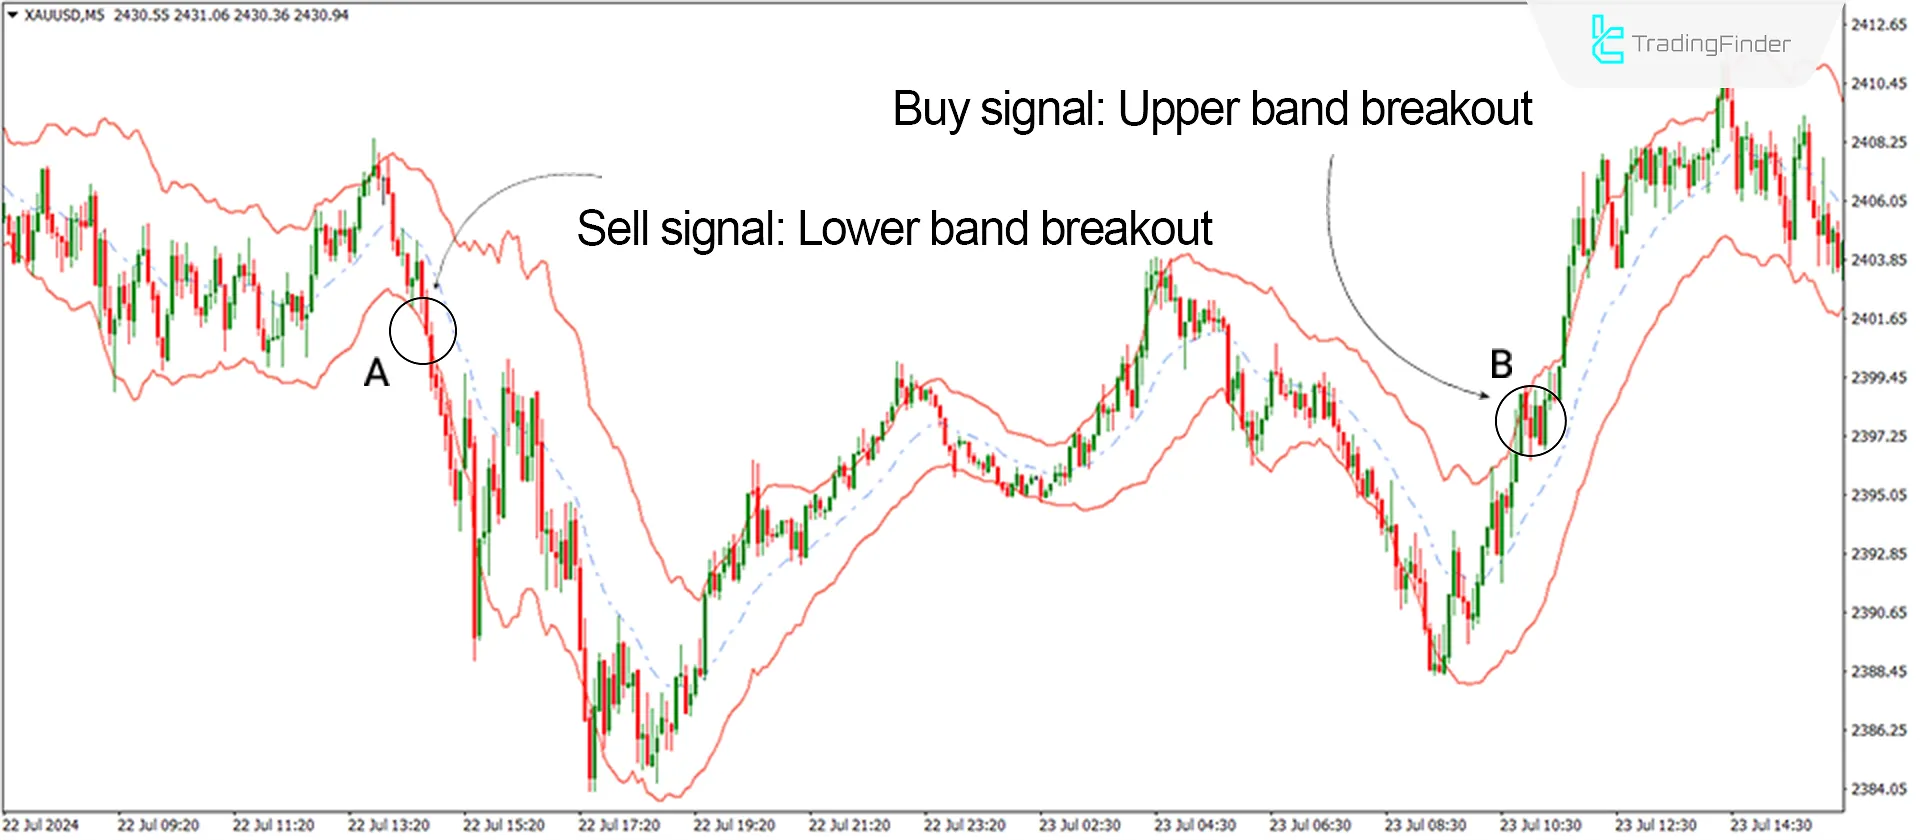
The image below shows the price chart of Gold (XAU/USD) in the 5-minute timeframe. At point A, the price breaks below the lower band of the channel after crossing below the moving average, continuing the downtrend.
At point B, the price crosses above the moving average and breaks the upper band of the channel, confirming the uptrend.
Uptrend Conditions of the Indicator (Buy Positions)
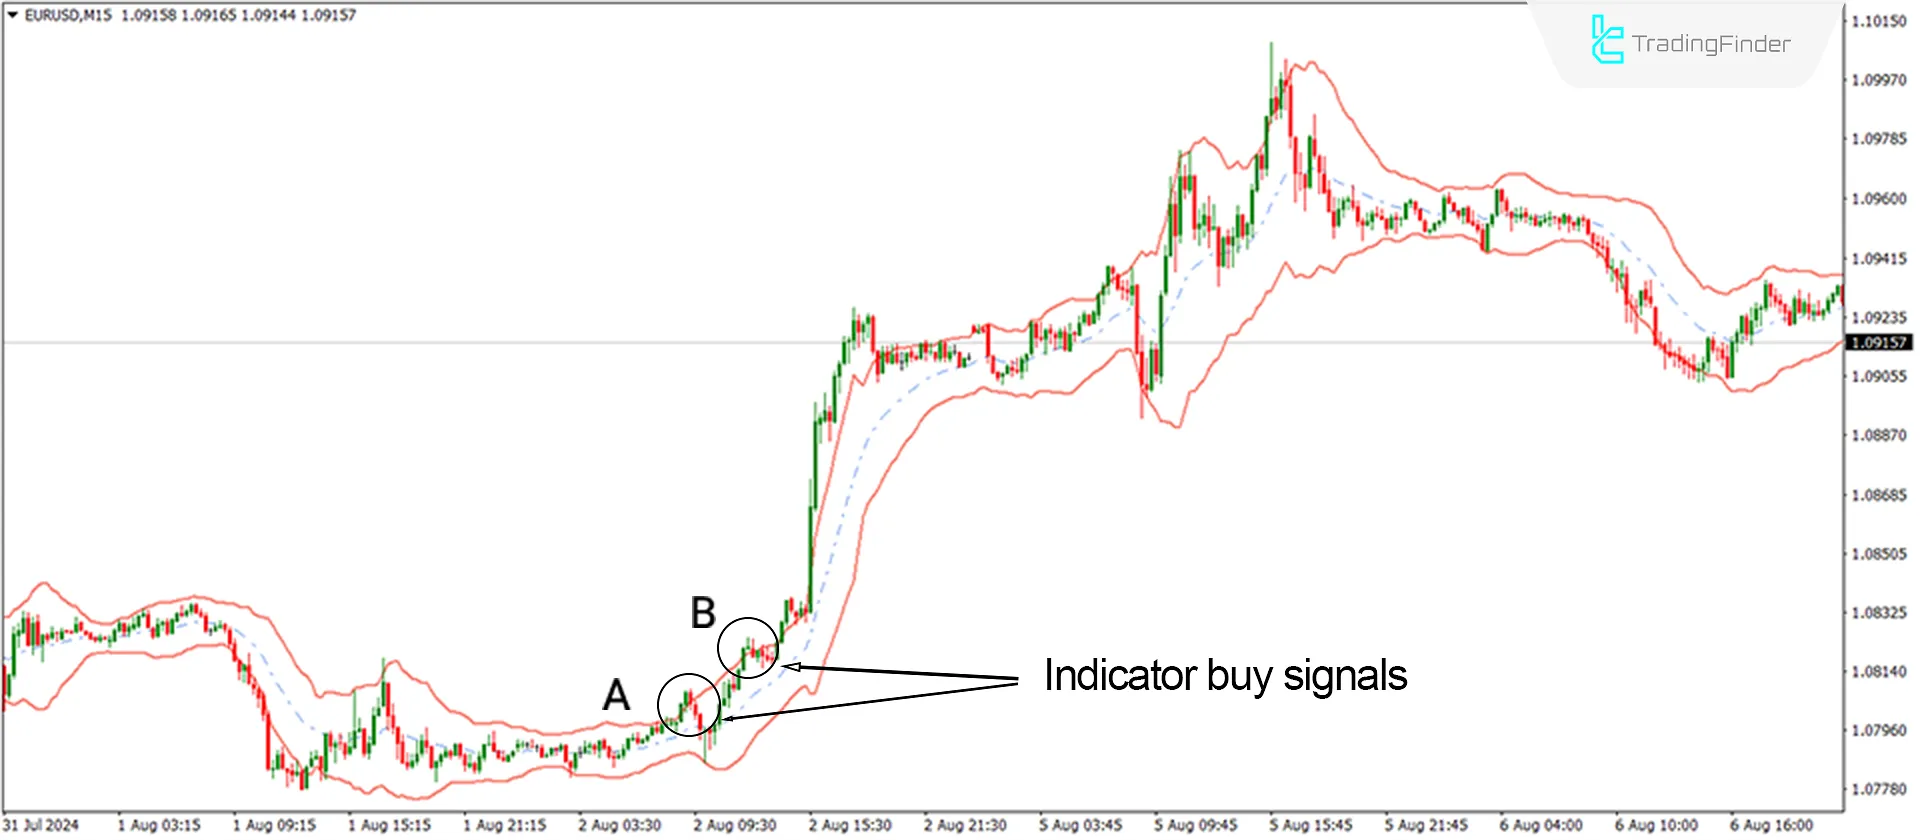
The image below shows the price chart of EUR/USD in the 15-minute timeframe. At points A and B, the price crosses above the moving average and breaks the upper channel band, signaling an uptrend and a potential entry for buy positions.

Downtrend Conditions of the Indicator (Sell Positions)
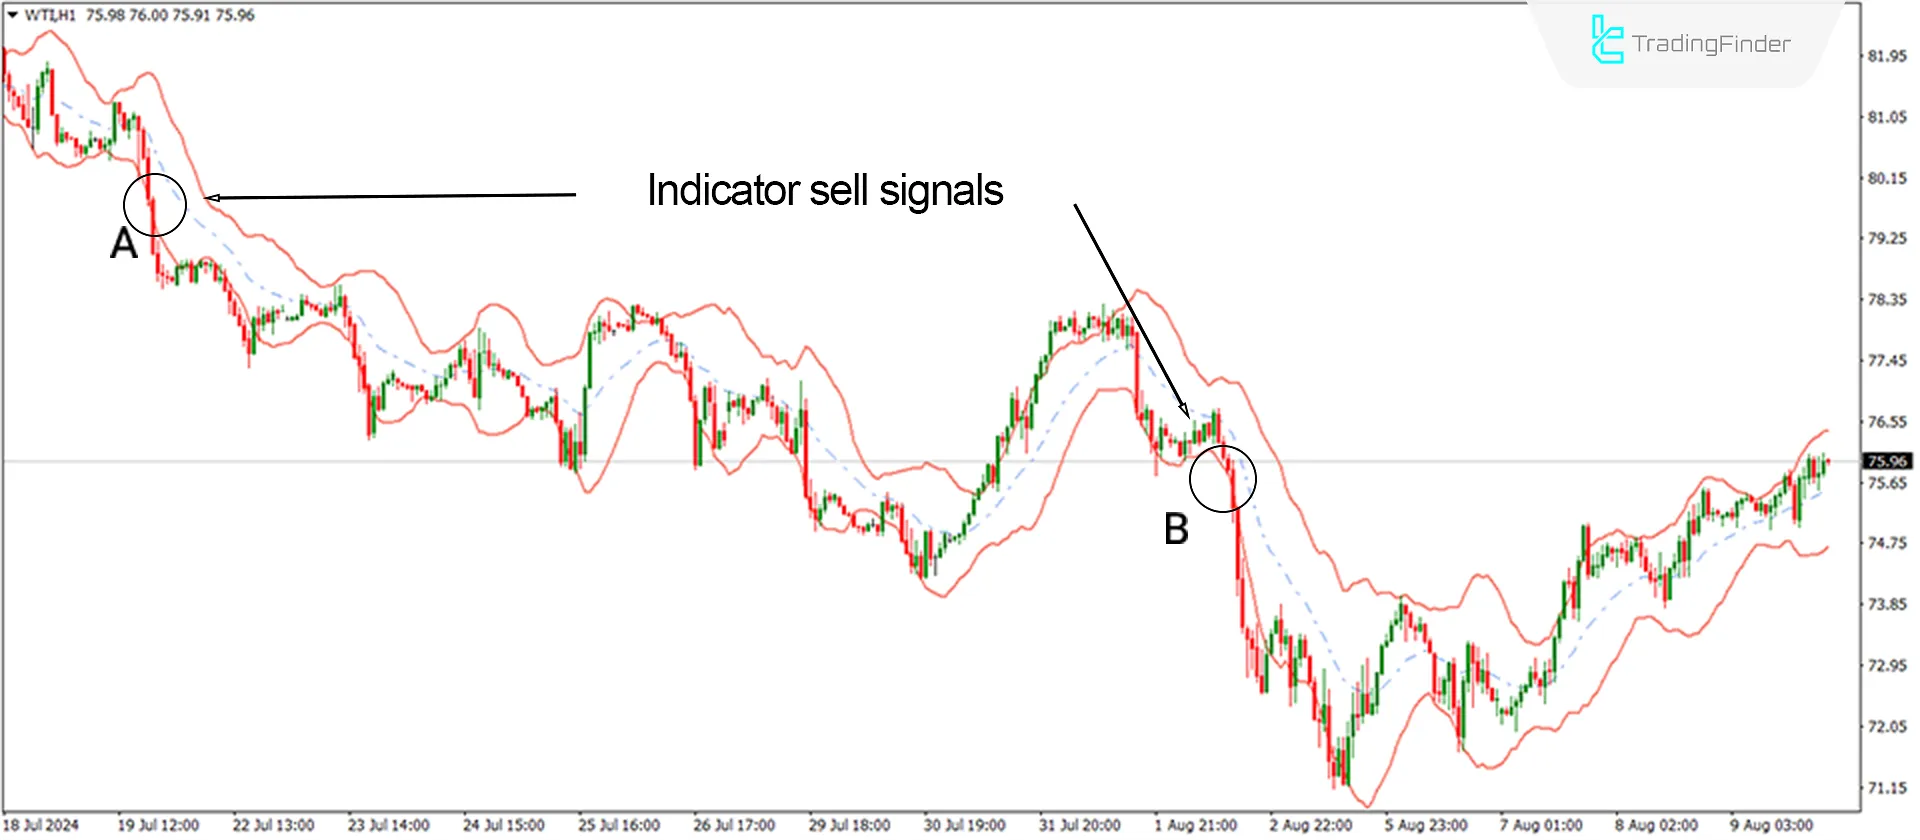
The image below shows the price chart of WTI Crude Oil in the 1-hour timeframe. At points A and B, the price crosses below the moving average and breaks the lower channel band, signaling a downtrend and a potential entry for sell positions.

Keltner Channel Indicator Settings

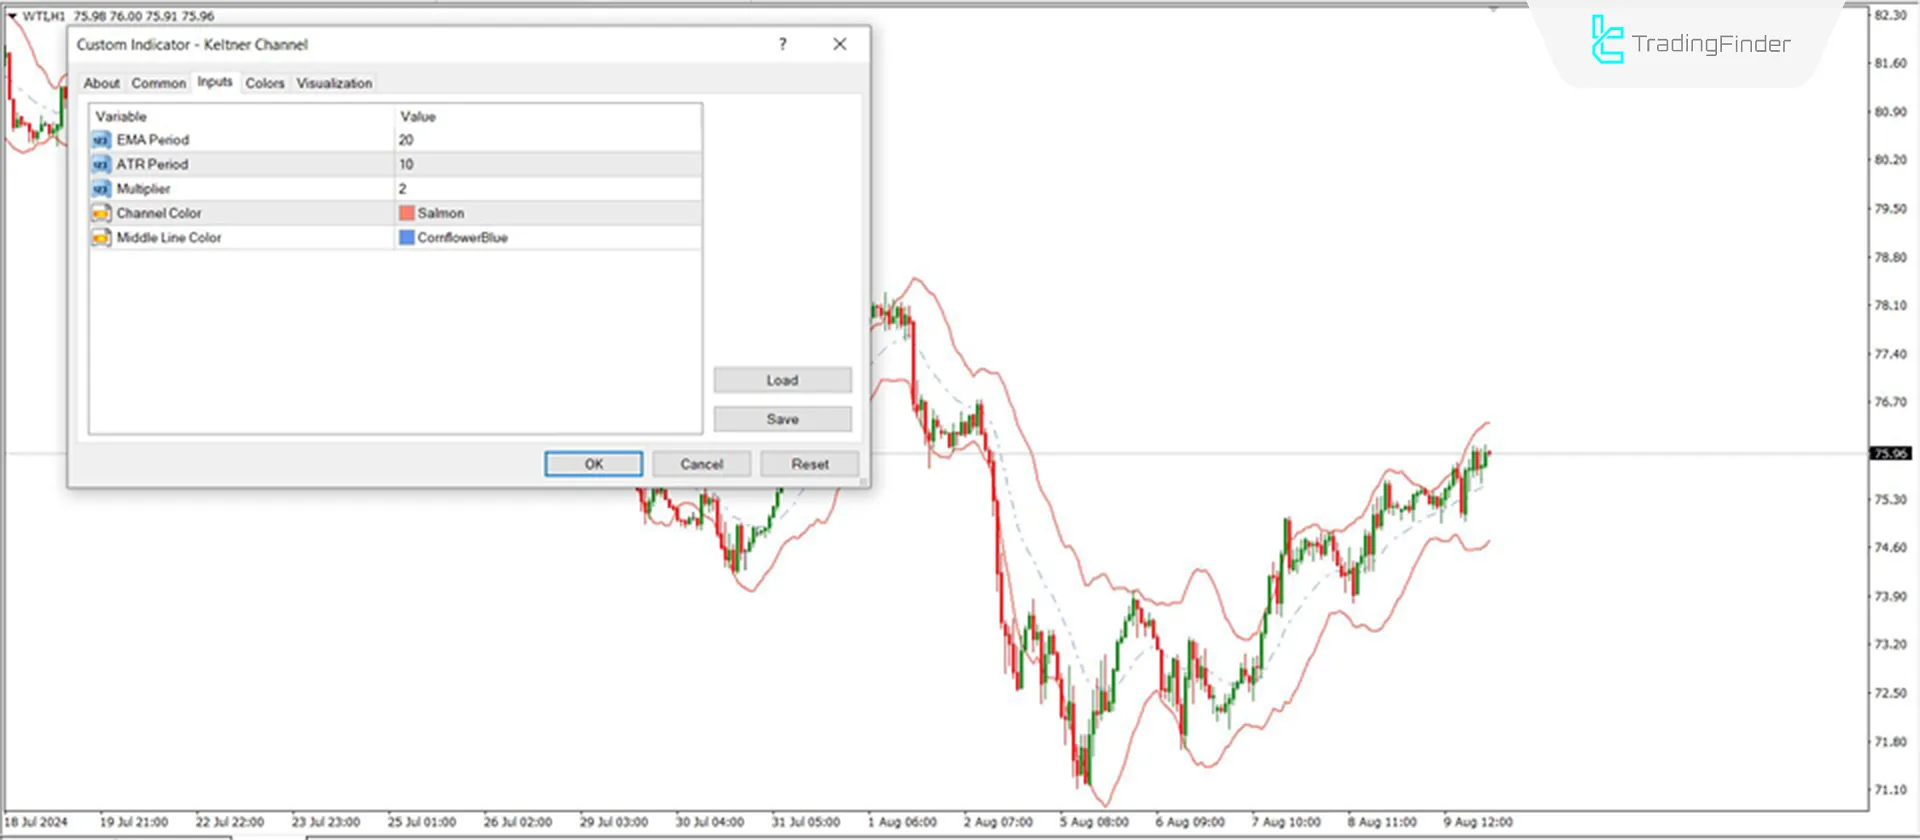
- EMA Period: The EMA period is set to 20;
- ATR Period: The ATR period is set to 10;
- Multiplier: The multiplier for the band distance from the moving average is 2;
- Channel Color: The color of the channel bands is red or customizable;
- Middle Line Color: The color of the middle dashed line is blue.
Conclusion
The Keltner Channel Indicator is a multi-timeframe tool that can be used across all trading strategies. This Volatility indicator provides a broad view of the trend direction. To enhance trend confirmation, you can combine the Keltner Channel with other confirming indicators, such as the RSI, MACD, or static support and resistance levels.
Keltner Channel MT4 PDF
Keltner Channel MT4 PDF
Click to download Keltner Channel MT4 PDFCan the Keltner Channel be used on its own?
Although the Keltner Channel is a powerful tool, it is recommended that it be used alongside other technical indicators, such as RSI and MACD, to improve signal accuracy.
Is the Keltner Channel applicable to all markets?
This indicator can be used in all financial markets, including stocks, currency pairs, commodities, and cryptocurrencies.


