![Key Price Action Levels Indicator For MT4 Download - [TFlab]](https://cdn.tradingfinder.com/image/204563/2-15-en-key-pa-levels-mt4-1.webp)
![Key Price Action Levels Indicator For MT4 Download - [TFlab] 0](https://cdn.tradingfinder.com/image/204563/2-15-en-key-pa-levels-mt4-1.webp)
![Key Price Action Levels Indicator For MT4 Download - [TFlab] 1](https://cdn.tradingfinder.com/image/204562/2-15-en-key-pa-levels-mt4-2.webp)
![Key Price Action Levels Indicator For MT4 Download - [TFlab] 2](https://cdn.tradingfinder.com/image/204567/2-15-en-key-pa-levels-mt4-3.webp)
![Key Price Action Levels Indicator For MT4 Download - [TFlab] 3](https://cdn.tradingfinder.com/image/204566/2-15-en-key-pa-levels-mt4-4.webp)
The Key Price Action Levels Indicator, as a MetaTrader4 supply and demand indicator, identifies points on the MetaTrader 4 chart where the price has reacted in the past, indicating that these points may function as support and resistance zones or supply and demand areas.
This indicator usesdifferent colors to clearly display rounded levels on the chart.
Key PA Levels Indicator Specifications Table
Table below provides the specifications for the Key PA Levels Indicator:
Indicator Categories: | Price Action MT4 Indicators Support & Resistance MT4 Indicators Levels MT4 Indicators |
Platforms: | MetaTrader 4 Indicators |
Trading Skills: | Intermediate |
Indicator Types: | Range MT4 Indicators Breakout MT4 Indicators |
Timeframe: | Multi-Timeframe MT4 Indicators |
Trading Style: | Day Trading MT4 Indicators Intraday MT4 Indicators |
Trading Instruments: | Share Stocks MT4 Indicators Indices Market MT4 Indicators Commodity Market MT4 Indicators Stock Market MT4 Indicators Cryptocurrency MT4 Indicators Forex MT4 Indicators |
Introduction
The Round Levels Indicator is essential for identifying order accumulation areas, closing positions, and placing new orders. The market’s reaction around these levels can significantly influence price trends. By identifying these levels, traders can optimally leverage market volatility.
Uptrend Conditions
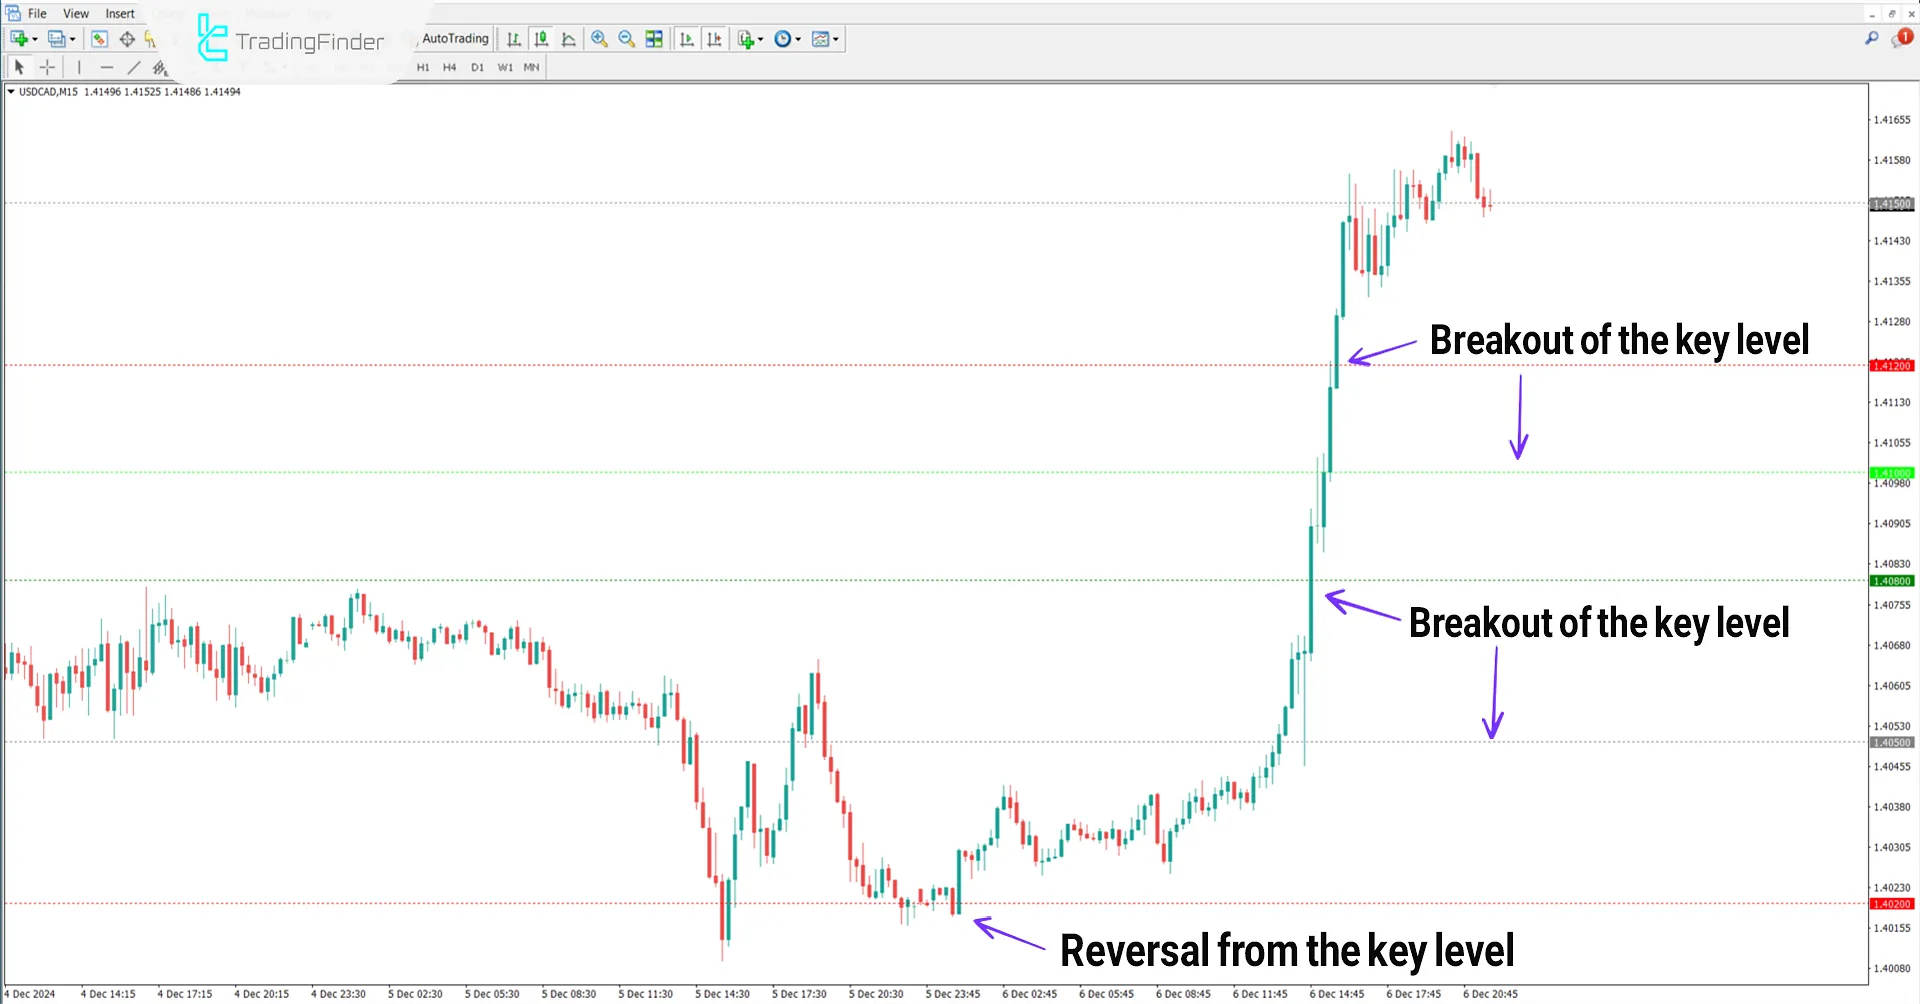
The chart below shows the USD/CAD pair on a 5 minute timeframe. When the price reaches the key price action levels, important reactions such as breaking rounded lines, trend continuation, or reversal are observable.

Downtrend Conditions
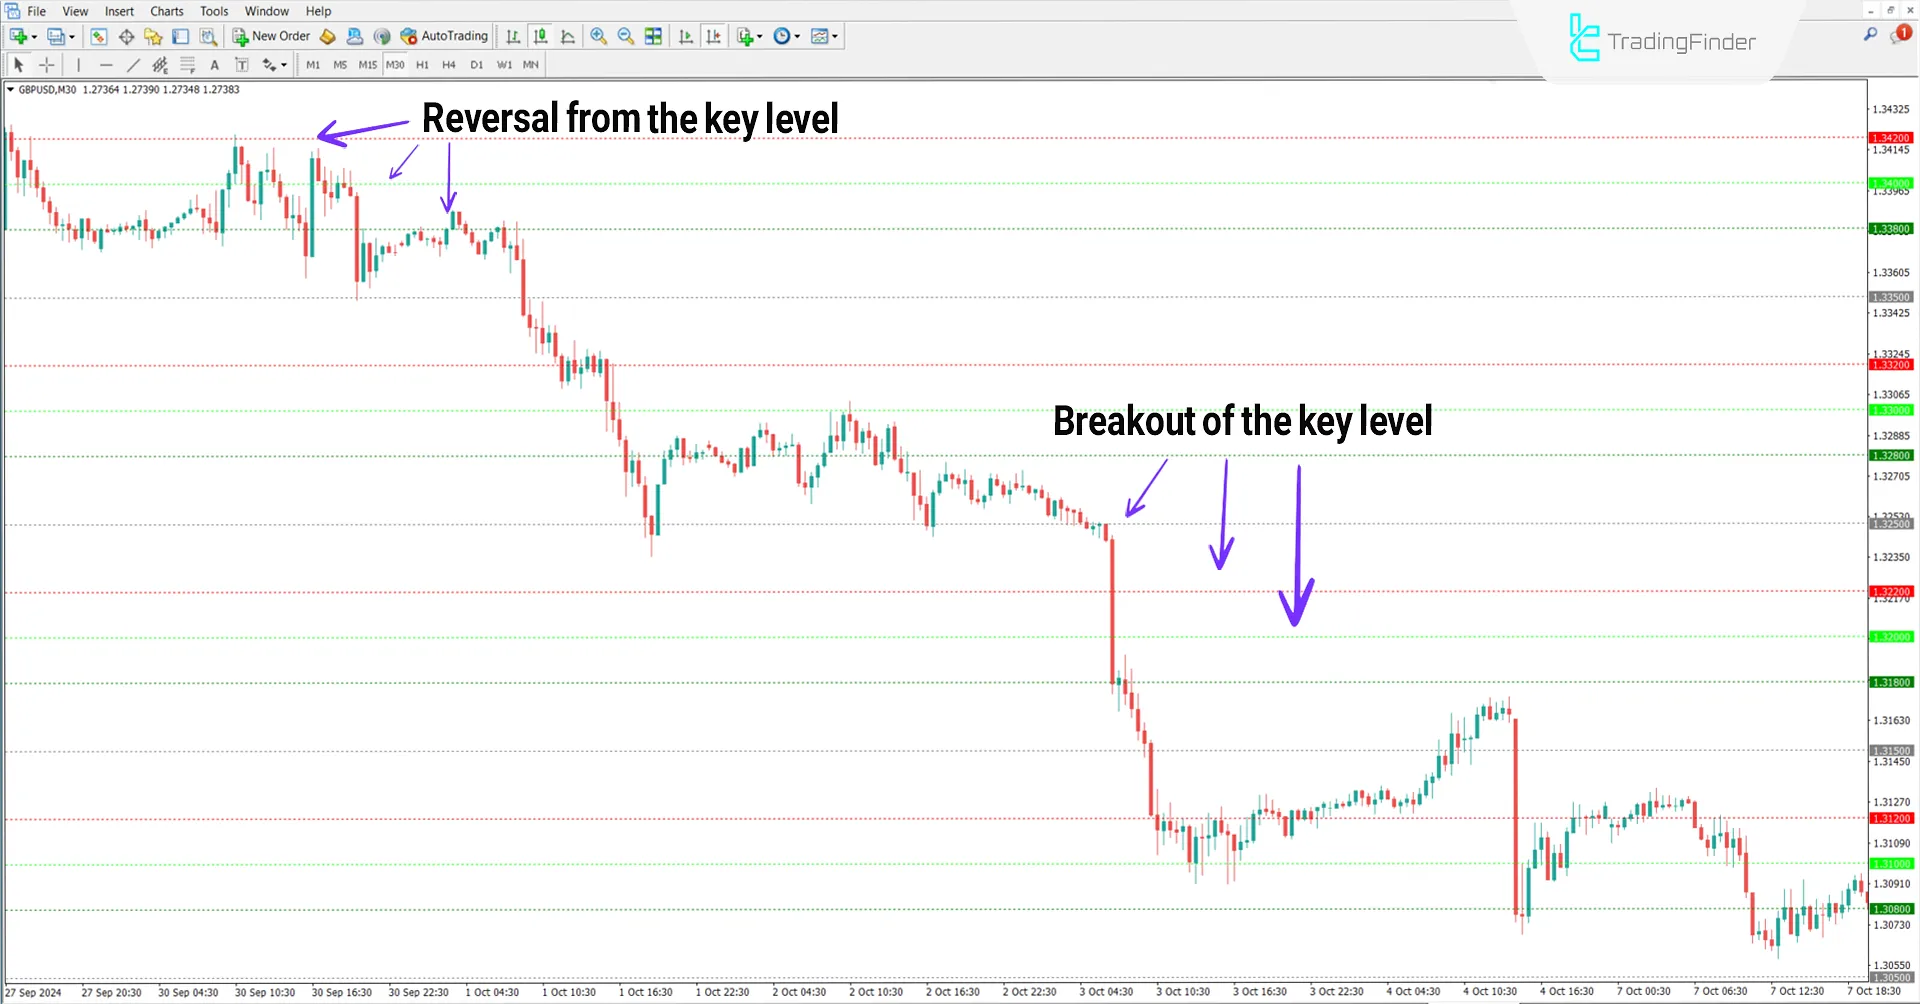
The image below shows the GBP/USD pair on a 30 minute timeframe. When the price reaches the key price action levels, a trend reversal is possible; however, breaking the rounded levels increases the likelihood of the trend continuing downward.

Indicator Settings
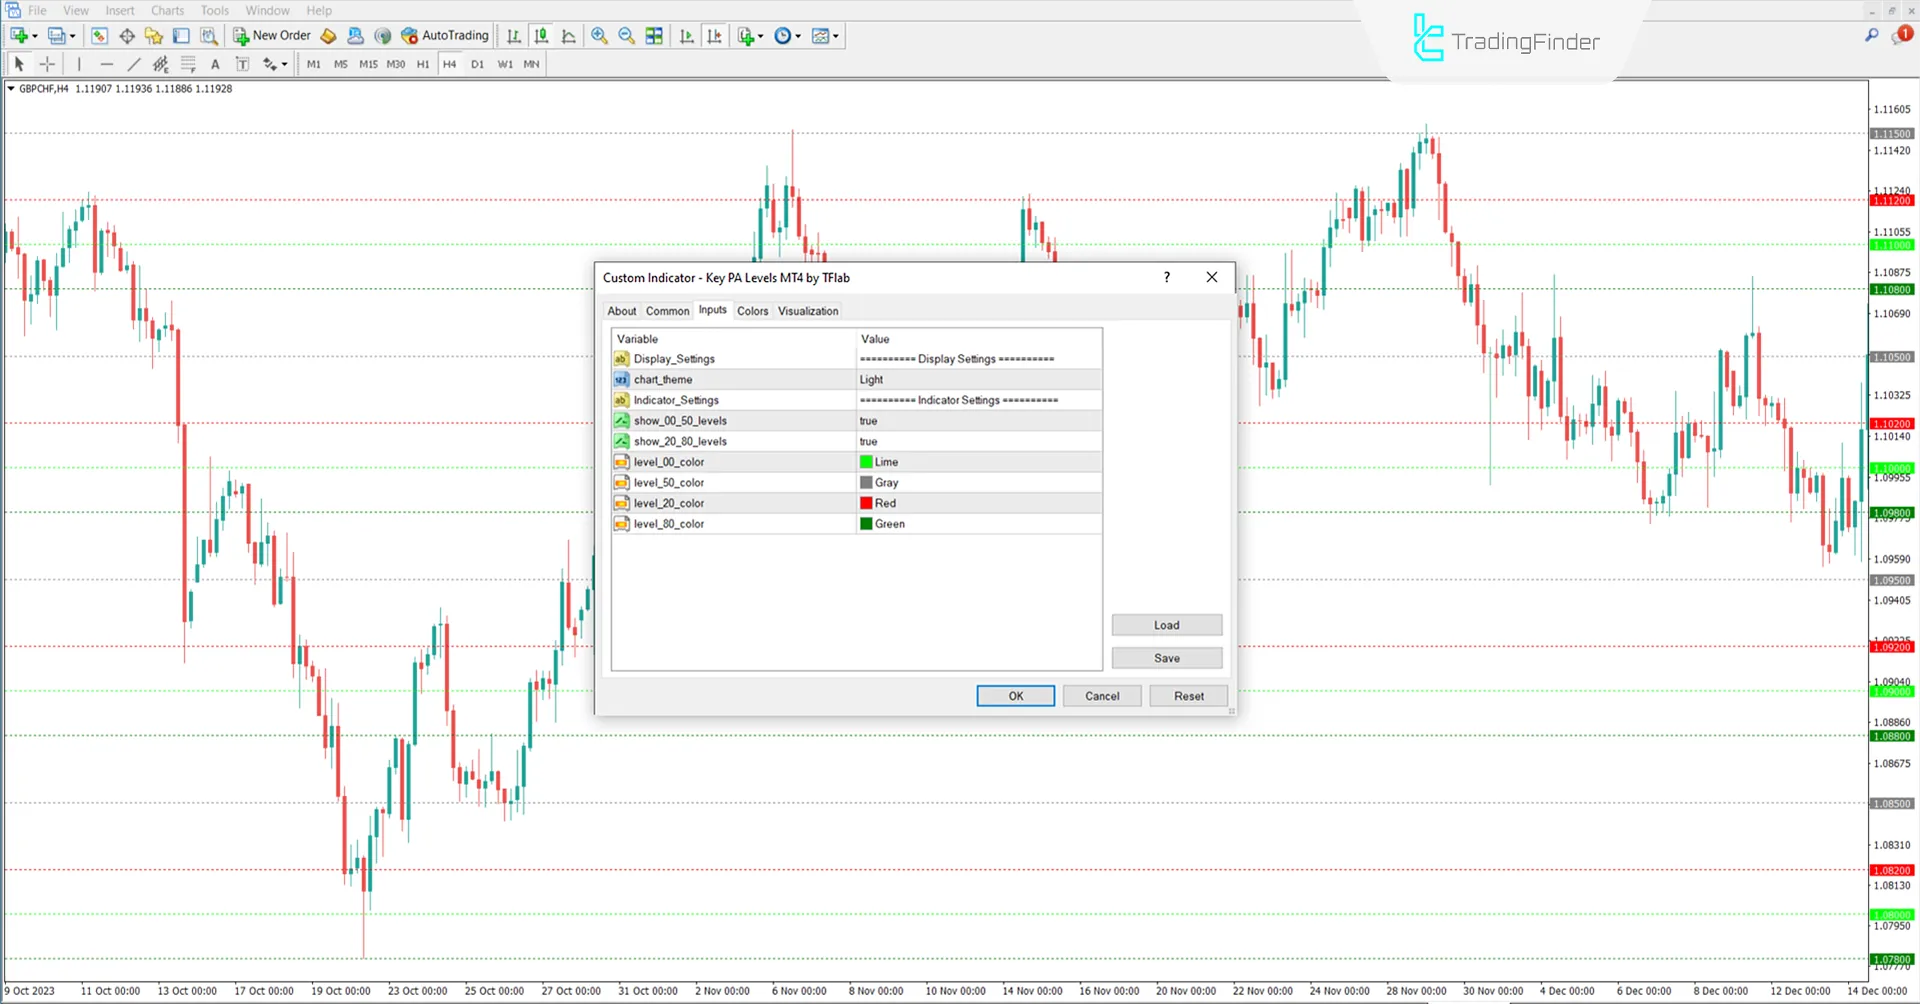
Image displays the key parameters and settings for Key PA Levels MetaTrader 4 Indicator:

- Chart theme: Display Chart theme;
- Show – 00-50 levels: Display 00–50 levels;
- Show – 20-80 levels: Display 20–80 levels;
- Level – 00 – color: Level 00 color;
- Level – 50 – color: Level 50 color;
- Level – 20 – color: Level 20 color;
- Level – 80 – color: Level 80 color.
Conclusion
The Key PA Levels Indicator is an analytical tool applicable across all financial markets and supports multi timeframe usage.
By analyzing past price data, it identifies price action levels in. However, it does not directly generate buy or sell signals.
Key Price Action Levels MT4 PDF
Key Price Action Levels MT4 PDF
Click to download Key Price Action Levels MT4 PDFDoes this tool provide buy and sell signals?
No, this indicator only provides traders with critical rounded levels.
Can the rounded levels indicator be used in a multi timeframe manner?
Yes, this tool supports multi timeframe usage.


