![Kumo Cloud Heatmap Indicator MT4 Download – Free – [TradingFinder]](https://cdn.tradingfinder.com/image/599160/13-245-en-kumo-cloud-heatmap-mt4-01.webp)
![Kumo Cloud Heatmap Indicator MT4 Download – Free – [TradingFinder] 0](https://cdn.tradingfinder.com/image/599160/13-245-en-kumo-cloud-heatmap-mt4-01.webp)
![Kumo Cloud Heatmap Indicator MT4 Download – Free – [TradingFinder] 1](https://cdn.tradingfinder.com/image/599159/13-245-en-kumo-cloud-heatmap-mt4-02.webp)
![Kumo Cloud Heatmap Indicator MT4 Download – Free – [TradingFinder] 2](https://cdn.tradingfinder.com/image/599166/13-245-en-kumo-cloud-heatmap-mt4-03.webp)
![Kumo Cloud Heatmap Indicator MT4 Download – Free – [TradingFinder] 3](https://cdn.tradingfinder.com/image/599184/13-245-en-kumo-cloud-heatmap-mt4-04.webp)
The Kumo Cloud Heatmap Indicator is designed based on the Ichimoku indicator structure, aiming to simplify trend analysis across different timeframes.
Instead of directly displaying multiple Ichimoku lines, this indicator represents market conditions through a colored heatmap.
According to the indicator’s table, green indicates a bullish trend, red indicates a bearish trend, and gray shows a neutral market condition.
Specification Table of Kumo Cloud Heatmap Indicator
The specifications of the Kumo Cloud Heatmap Indicator are as follows.
Indicator Categories: | Trading Assist MT4 Indicators Heatmap Indicators for MetaTrader 4 Ichimoku Indicators for MetaTrader 4 |
Platforms: | MetaTrader 4 Indicators |
Trading Skills: | Intermediate |
Indicator Types: | Reversal MT4 Indicators |
Timeframe: | Multi-Timeframe MT4 Indicators |
Trading Style: | Day Trading MT4 Indicators Scalper MT4 Indicators Swing Trading MT4 Indicators |
Trading Instruments: | Stock Market MT4 Indicators Cryptocurrency MT4 Indicators Forex MT4 Indicators |
Kumo Cloud Heatmap at a Glance
The Kumo Cloud Heatmap colors are based on the price position relative to the Ichimoku Cloud.
- Green: Bullish trend, price positioned above the Kumo Cloud
- Red: Bearish trend, price fluctuating below the Kumo Cloud
- Gray: Neutral condition, price located inside the Kumo Cloud
Bullish Trend Condition
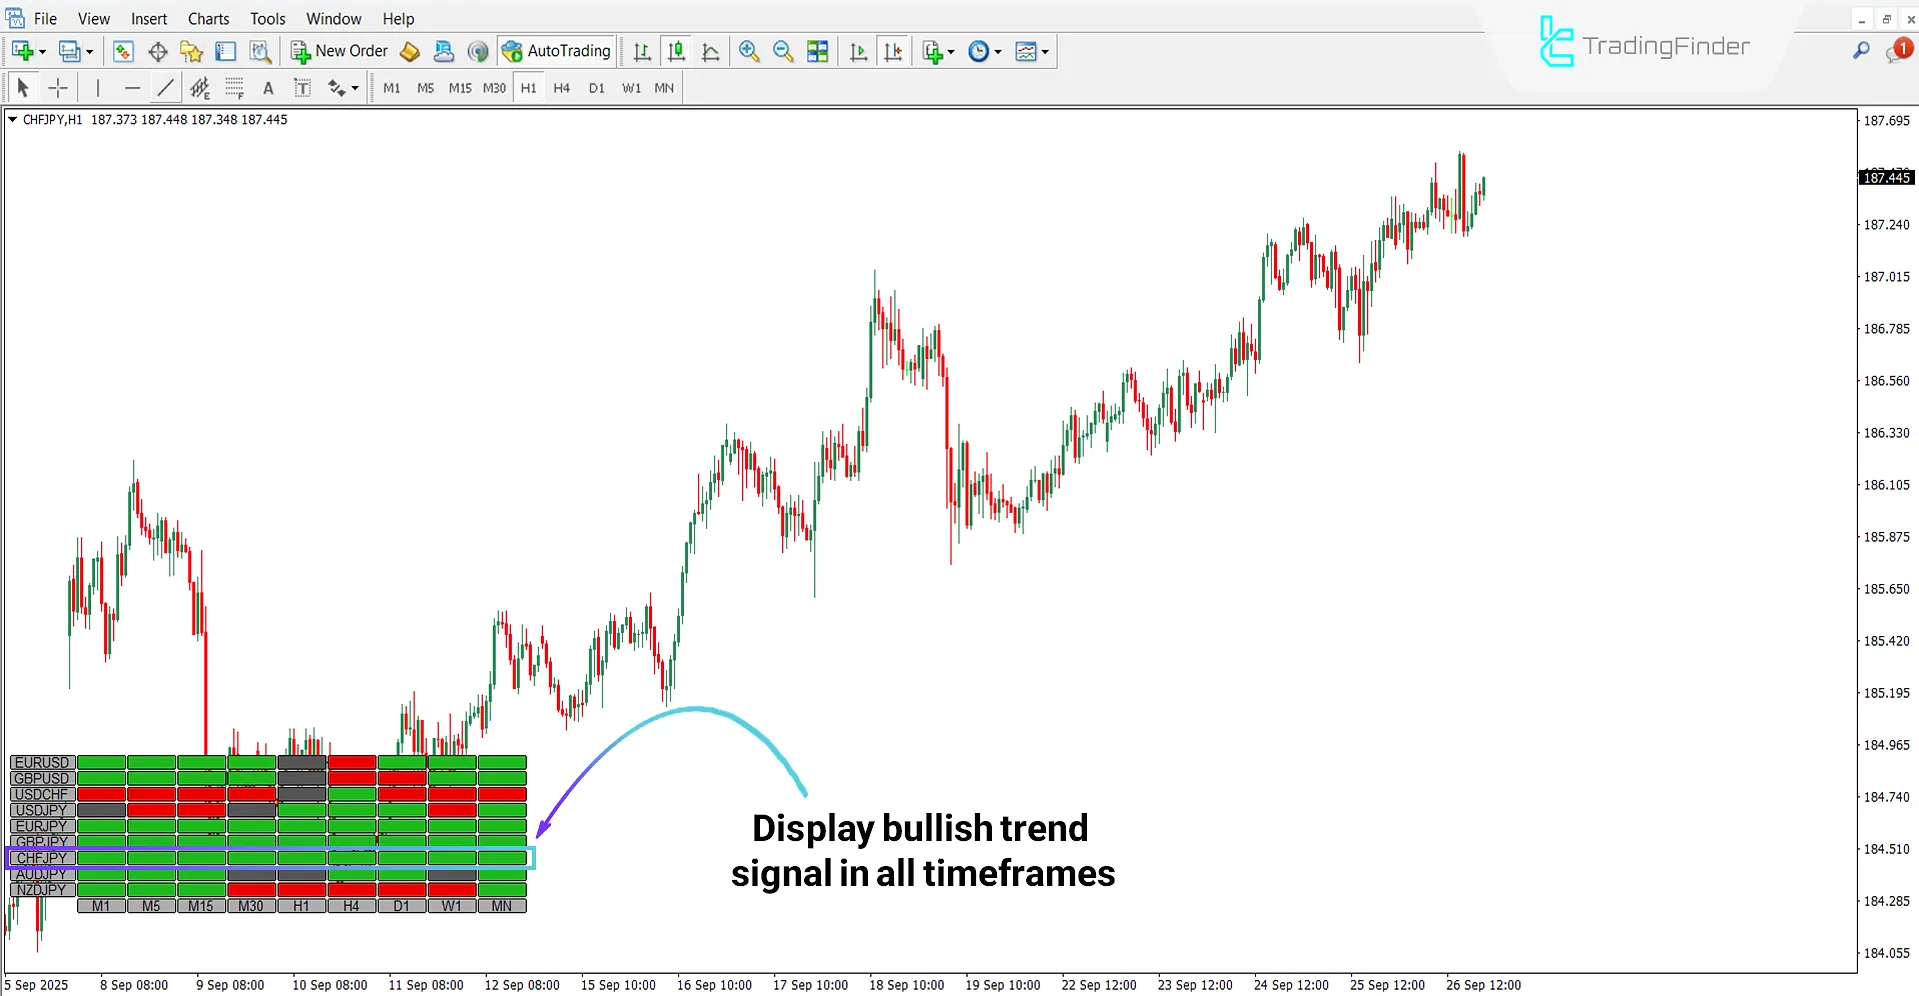
According to the 1-hour chart of Swiss Franc to Japanese Yen (CHF/JPY), the "H1" section in the heatmap is displayed in green, indicating a bullish signal.
Furthermore, when most timeframes simultaneously appear in green, it confirms the strength and sustainability of the bullish trend.

Bearish Trend Condition
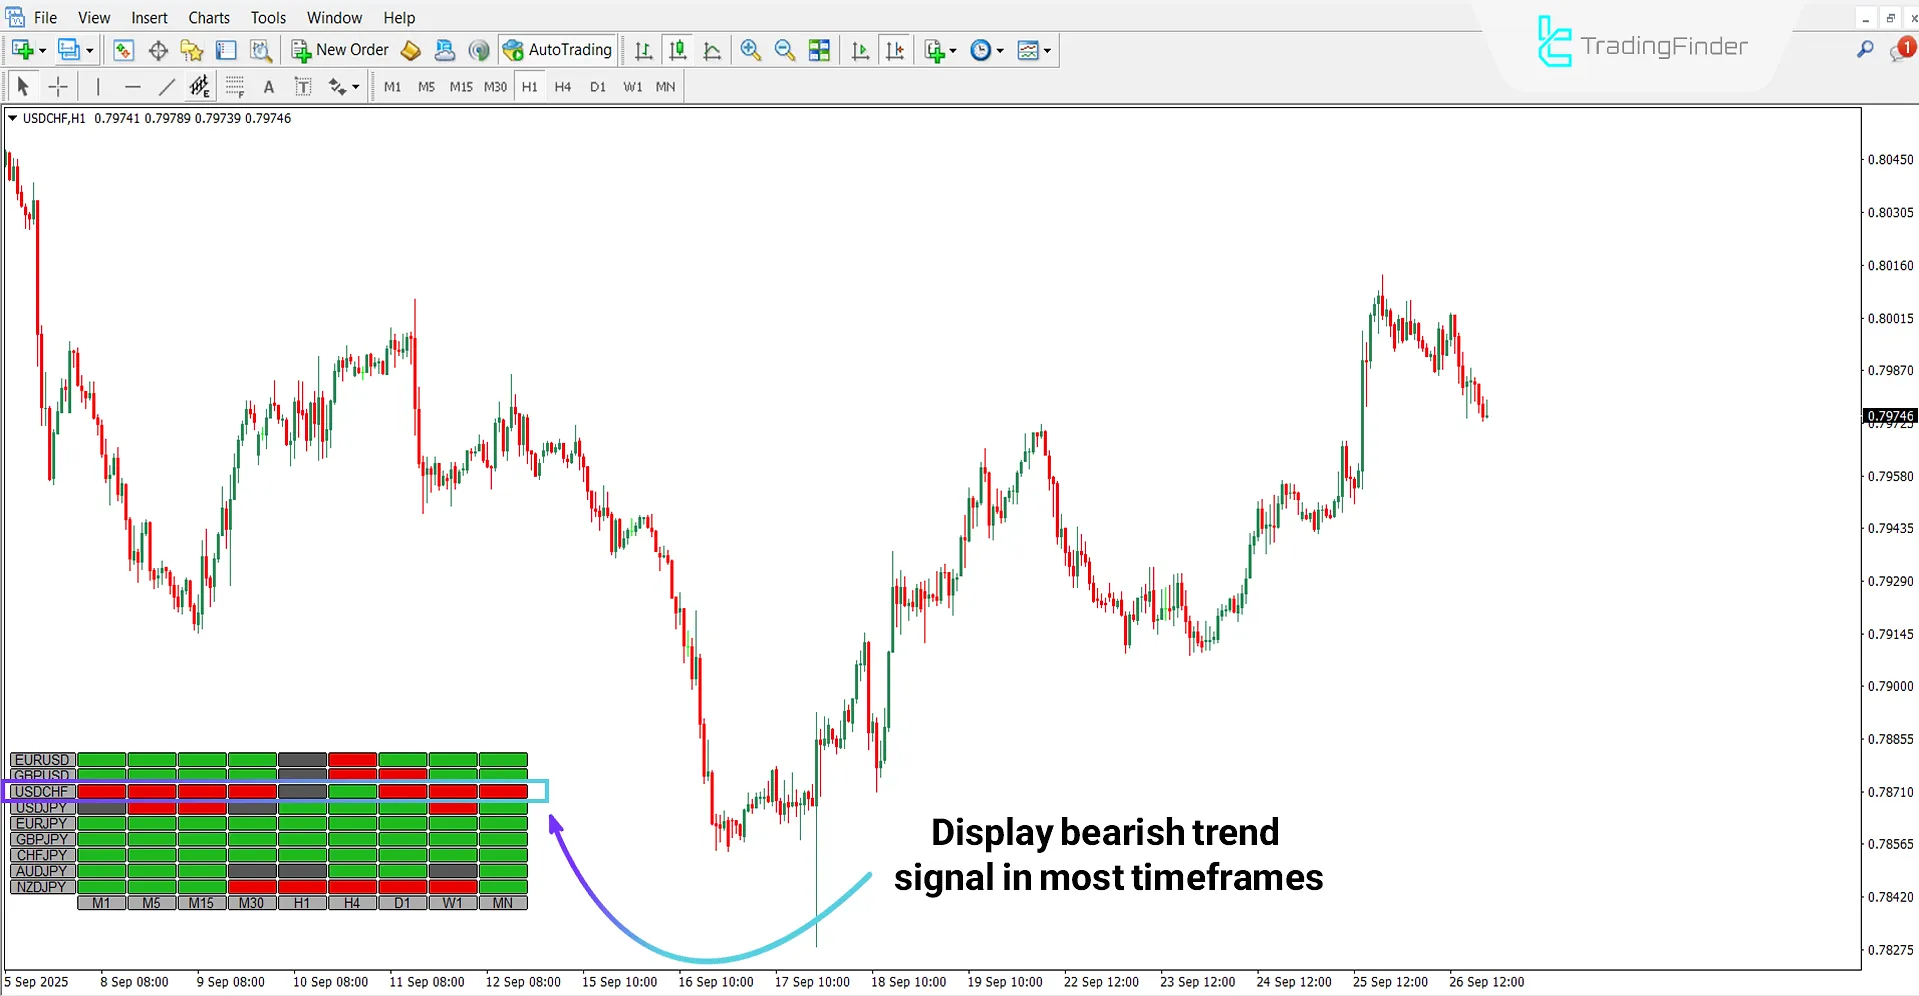
According to the 1-hour chart of US Dollar to Swiss Franc (USD/CHF), the 1-hour timeframe in the heatmap is displayed in gray, indicating a neutral market condition.
However, the dominance of red color across most timeframes suggests the strength and continuation of the bearish trend.

Settings of Kumo Cloud Heatmap Indicator
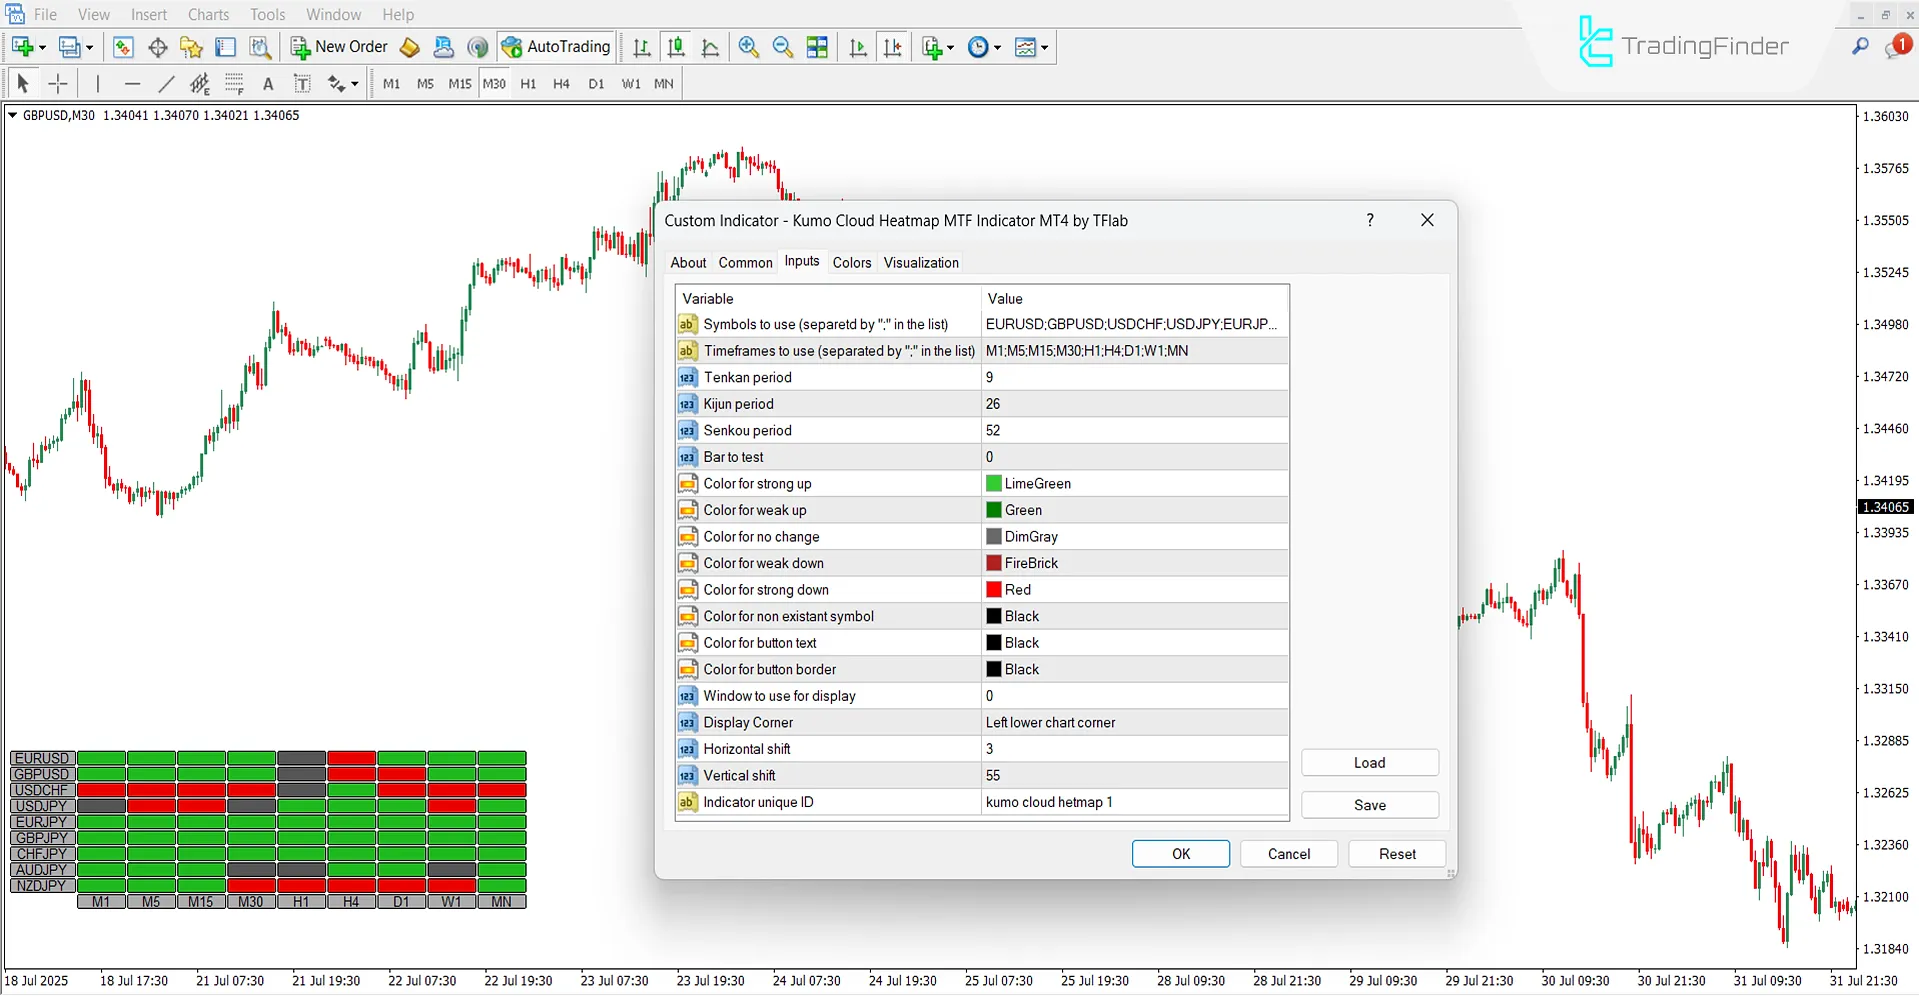
The adjustable parameters of the Kumo Cloud Heatmap Indicator are as follows:

- Symbols to use: List of trading symbols in heatmap
- Timeframes to use: Selected timeframes for heatmap
- Tenkan period: Number of periods for Tenkan-Sen line
- Kijun period: Number of periods for Kijun-Sen line
- Senkou period: Number of periods for Senkou Span
- Bar to test: Number of candles for test or display
- Color for strong up: Color of strong bullish trend
- Color for weak up: Color of weak bullish trend
- Color for no change: Color of neutral condition
- Color for weak down: Color of weak bearish trend
- Color for strong down: Color of strong bearish trend
- Color for non existant symbol: Color of non-existing symbols
- Color for button text: Color of button text
- Color for button border: Color of button border
- Window to use for display: Window number for display
- Display Corner: Indicator display position on chart
- Horizontal shift: Horizontal shift amount
- Vertical shift: Vertical shift amount
- Indicator unique ID: Unique identifier of indicator
Note: In the "Symbols to use" setting, symbol names must match the names provided by the broker.
Conclusion
The Kumo Cloud Heatmap Indicator is a powerful tool designed to simplify Ichimoku Cloud analysis by visually displaying market trends in a colored multi-timeframe heatmap.
This trading tool, through the use of green, red, and gray colors, identifies bullish, bearish, and neutral conditions while enabling the simultaneous review of multiple symbols and timeframes.
The combination of a multi-timeframe perspective and visual heatmap display facilitates the identification of strong trends and convergence points.
Kumo Cloud Heatmap Indicator MT4 PDF
Kumo Cloud Heatmap Indicator MT4 PDF
Click to download Kumo Cloud Heatmap Indicator MT4 PDFWhat does the gray color mean?
Gray color indicates a neutral or ranging market condition.
Is this indicator only useful in Forex?
No, the Kumo Cloud Heatmap Indicator can be applied to all markets.


