![Laguerre Volume Index Indicator for MT4 Download - Free - [TFlab]](https://cdn.tradingfinder.com/image/217646/4-51-en-laguerre-volume-index-mt4-1.webp)
![Laguerre Volume Index Indicator for MT4 Download - Free - [TFlab] 0](https://cdn.tradingfinder.com/image/217646/4-51-en-laguerre-volume-index-mt4-1.webp)
![Laguerre Volume Index Indicator for MT4 Download - Free - [TFlab] 1](https://cdn.tradingfinder.com/image/217615/4-51-en-laguerre-volume-index-mt4-2.webp)
![Laguerre Volume Index Indicator for MT4 Download - Free - [TFlab] 2](https://cdn.tradingfinder.com/image/217613/4-51-en-laguerre-volume-index-mt4-3.webp)
![Laguerre Volume Index Indicator for MT4 Download - Free - [TFlab] 3](https://cdn.tradingfinder.com/image/217614/4-51-en-laguerre-volume-index-mt4-4.webp)
On July 22, 2025, in version 2, alert/notification and signal functionality was added to this indicator
The Laguerre Volume Index Indicator is an effective tool among MetaTrader 4 indicators that combines the Laguerre filter and trading volume to identify potential overbought and oversold zones in the market.
The Laguerre Volume oscillates between 0 and 1 and has three horizontal lines at levels 0.25, 0.5, and 0.75. When the indicator's value rises above 0.5, it indicates buyers' dominance, while a value below 0.5 shows sellers' dominance.
Laguerre Volume Index Indicator Specifications Table
The table below outlines the details of the Laguerre Volume Index Indicator.
Indicator Categories: | Oscillators MT4 Indicators Volatility MT4 Indicators Trading Assist MT4 Indicators |
Platforms: | MetaTrader 4 Indicators |
Trading Skills: | Intermediate |
Indicator Types: | Reversal MT4 Indicators |
Timeframe: | Multi-Timeframe MT4 Indicators |
Trading Style: | Intraday MT4 Indicators |
Trading Instruments: | Stock Market MT4 Indicators Cryptocurrency MT4 Indicators Forex MT4 Indicators |
Overview of the Indicator
This indicator analyzes changes in trading volume near support and resistance levels to identify potential trend reversal zones and provide trading signals.
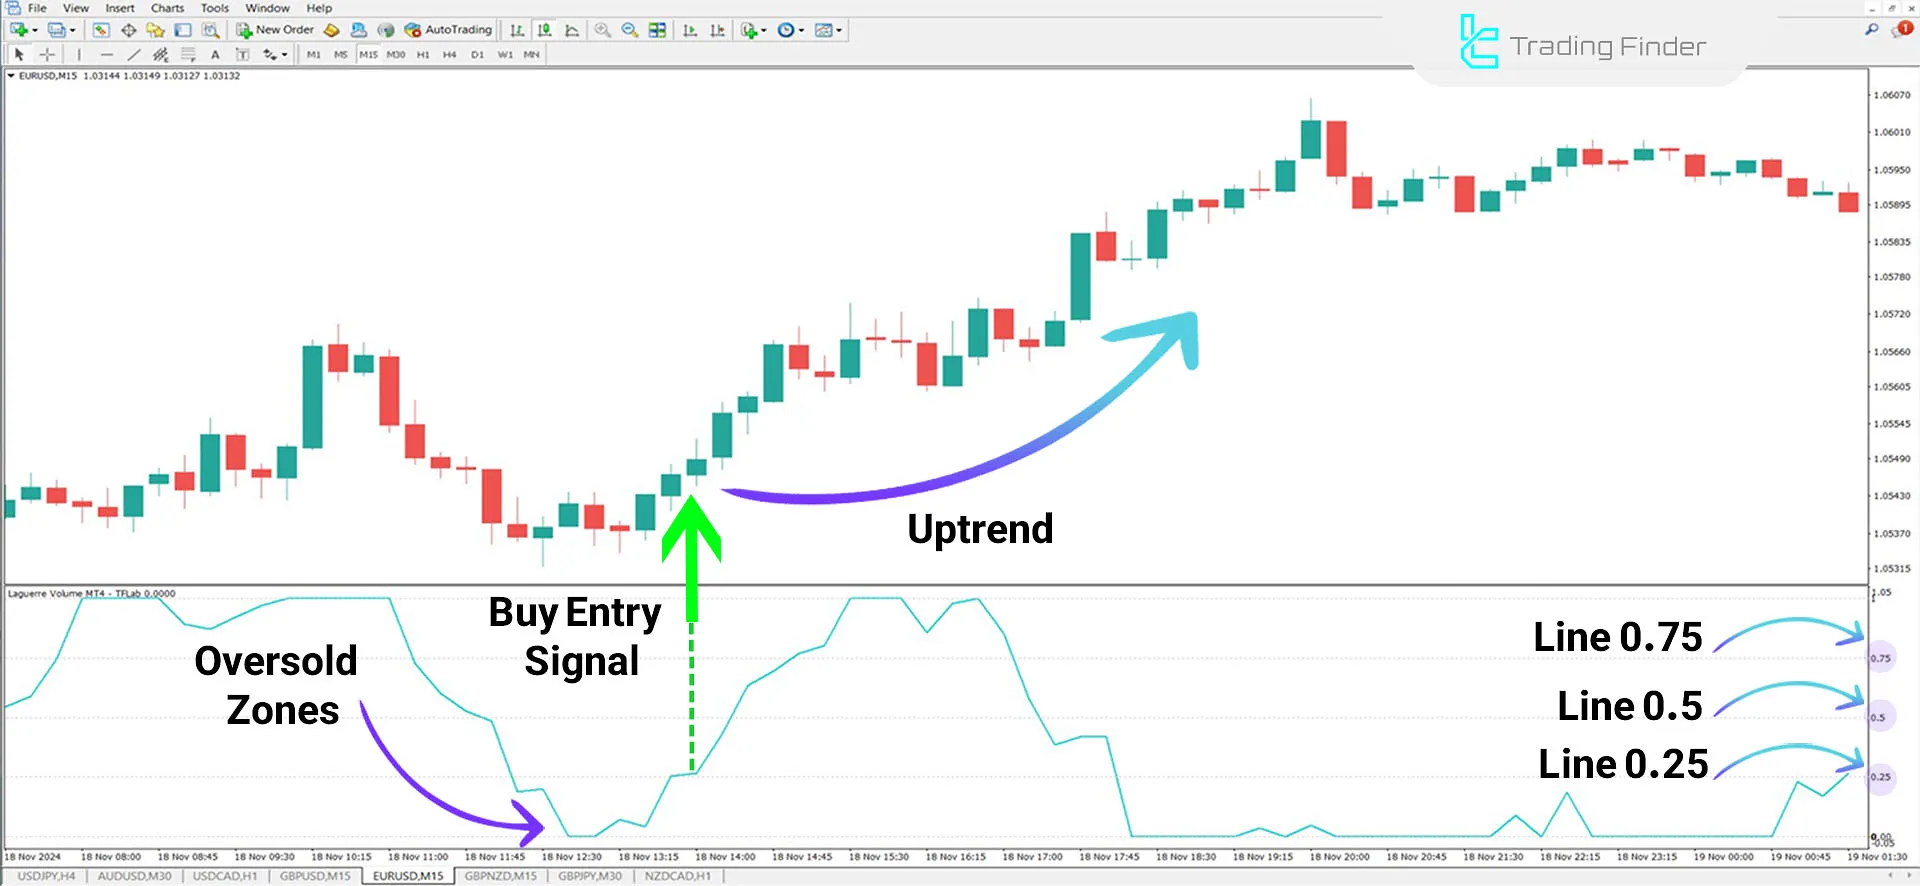
- Traders can enter a Buy trade when the indicator value breaks above 0.25.
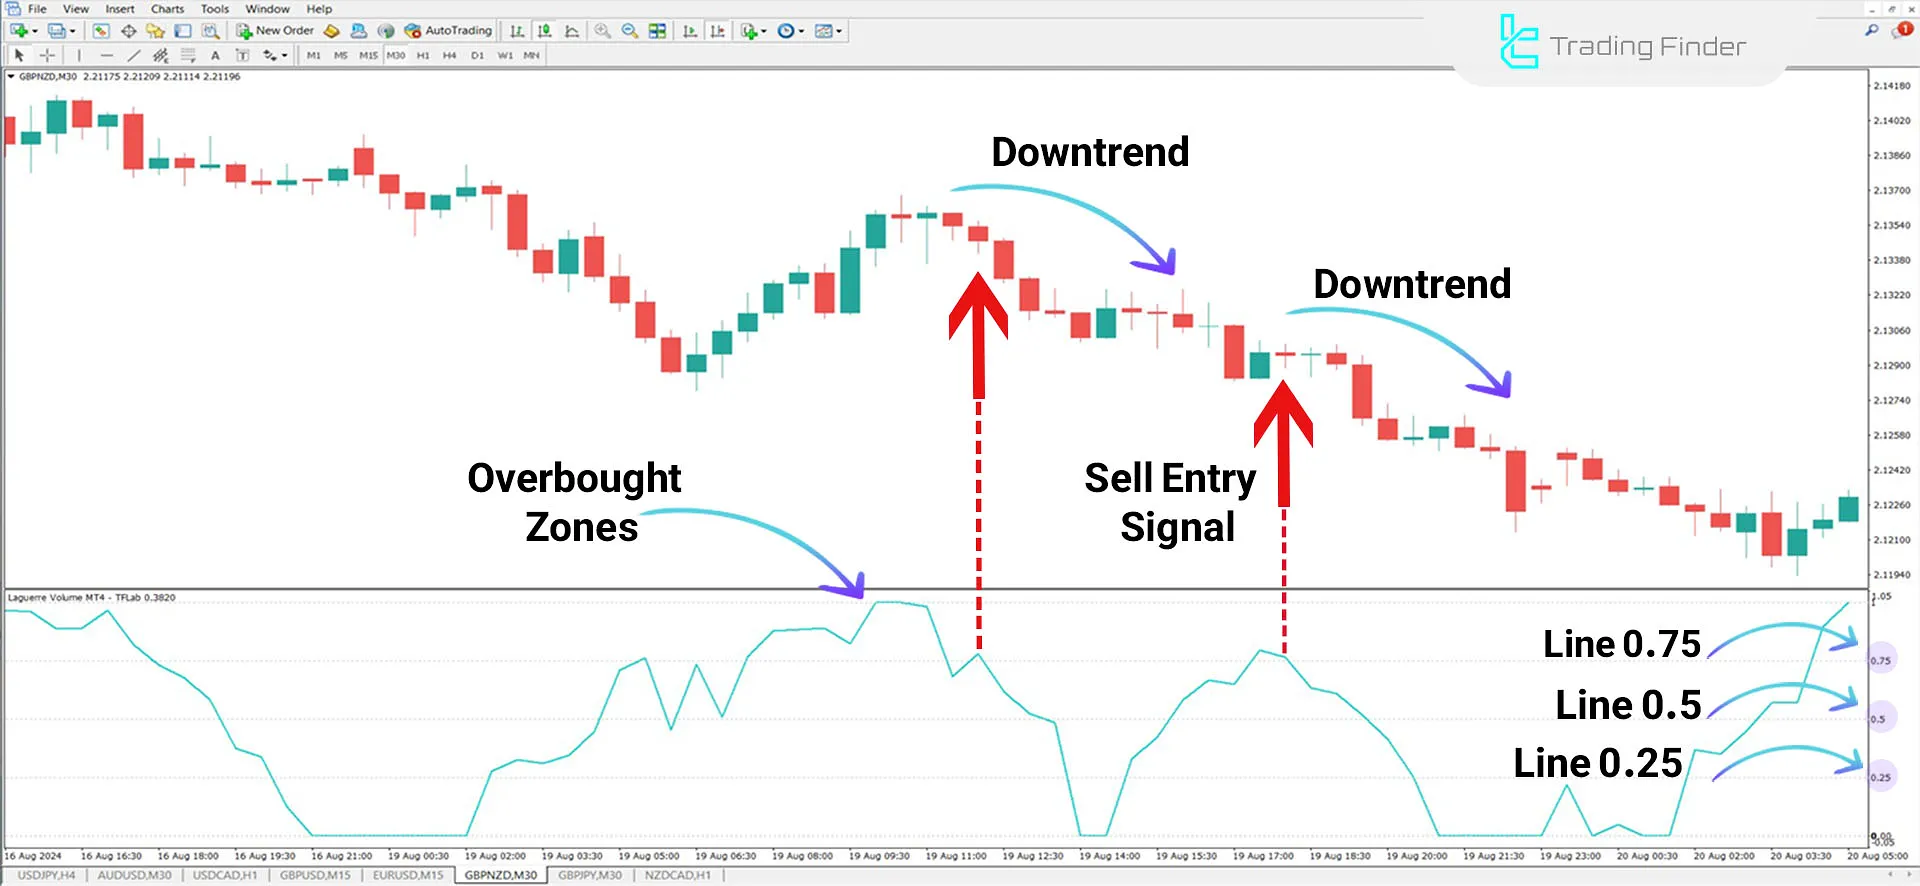
- Conversely, when the indicator value breaks below 0.75, it is considered a Sell signal.
Indicator in Uptrend
In the EUR/USD price chart, when the indicator line crosses the 0.25 level upward, the price trend enters a bullish phase. Traders can use this breakout as a signal to enter a Buy trade.
Additionally, for trade management and optimized exit, when the indicator line crosses 0.75 downward, traders can Exit the trade or secure profits.

Indicator in Downtrend
The GBP/NZD currency pair chart is displayed in the image below. When the price in the oscillator window reaches overbought zones and the blue line crosses 0.75 downward, this condition can be considered an initial Sell signal.
Traders can verify the signal with additional tools or analyses before entering a Sell trade.

Indicator Settings
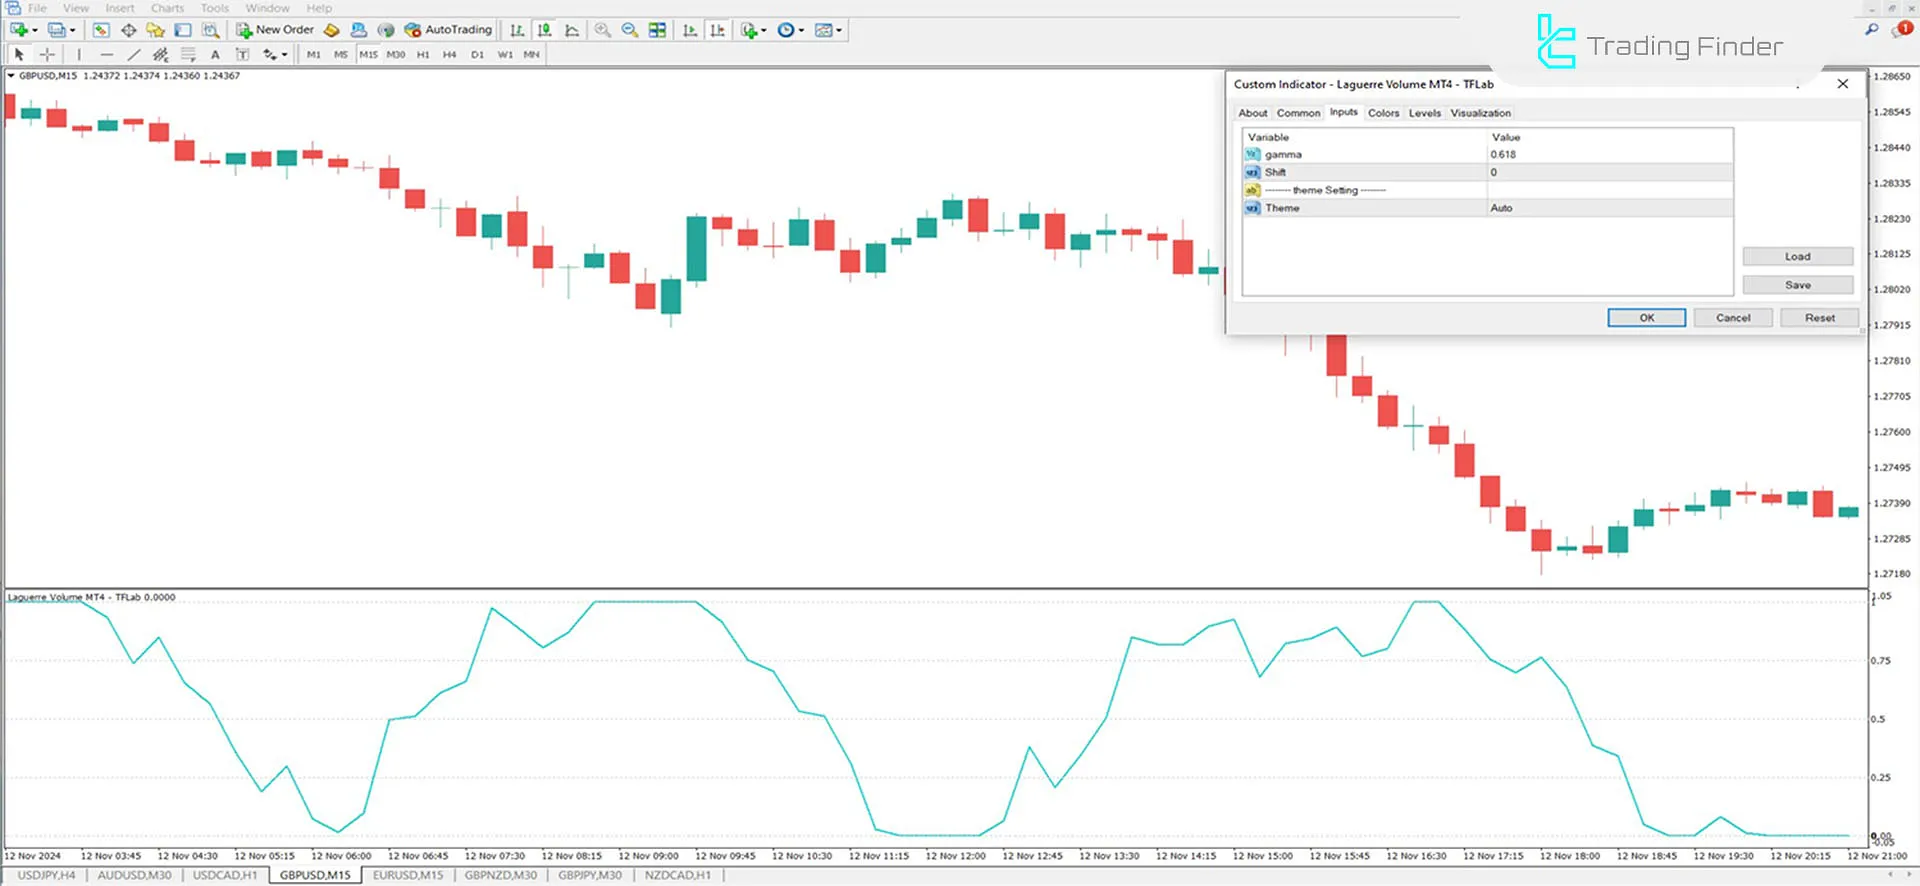
The image below provides a comprehensive view of the indicator settings:

- Gamma: Adjusts the indicator's sensitivity to price changes
- Shift: Time adjustment of the indicator relative to price data
- Theme: Background theme selection for the indicator
Conclusion
The Laguerre Volume Index Oscillator is a technical tool that analyzes trading volume and identifies overbought and oversold zones.
By combining the Laguerre filter and trading volume, this indicator predicts potential trend changes and provides suitable Entry and Exit zones for trades.
Traders can also use ICT indicators to enhance the analysis of the mentioned areas.
Laguerre Volume Index MT4 PDF
Laguerre Volume Index MT4 PDF
Click to download Laguerre Volume Index MT4 PDFWhat is the Laguerre Volume Index Indicator?
The Laguerre Volume Index Indicator is an analytical tool in MetaTrader 4 that combines the Laguerre filter and trading volume to identify overbought and oversold zones and predict trend changes.
How does the Laguerre Volume Index Indicator work?
This tool oscillates between values 0 and 1 and analyzes trading volume near support and resistance levels to identify potential trend reversal zones.


