![Linear Regression Slope Indicator MetaTrader 4 – Free Download [TradingFinder]](https://cdn.tradingfinder.com/image/532803/2-138-en-linear-regression-slope-mt4-1.webp)
![Linear Regression Slope Indicator MetaTrader 4 – Free Download [TradingFinder] 0](https://cdn.tradingfinder.com/image/532803/2-138-en-linear-regression-slope-mt4-1.webp)
![Linear Regression Slope Indicator MetaTrader 4 – Free Download [TradingFinder] 1](https://cdn.tradingfinder.com/image/532791/2-138-en-linear-regression-slope-mt4-2.webp)
![Linear Regression Slope Indicator MetaTrader 4 – Free Download [TradingFinder] 2](https://cdn.tradingfinder.com/image/532792/2-138-en-linear-regression-slope-mt4-3.webp)
![Linear Regression Slope Indicator MetaTrader 4 – Free Download [TradingFinder] 3](https://cdn.tradingfinder.com/image/532802/2-138-en-linear-regression-slope-mt4-4.webp)
The Linear Regression Slope Indicator is an analytical tool based on statistics and mathematics that calculates the slope of the linear regression line for price data.
This indicator visually displays changes in price growth rate (Slope) in the form of histogram bars.
The length of the bars indicates the strength of the movement; longer bars represent a stronger trend, while shorter bars indicate a reduction in market energy.
Linear Regression Slope Indicator Table
The general features of the Linear Regression Slope Indicator in MetaTrader 4 are shown in the table below:
Indicator Categories: | Oscillators MT4 Indicators Trading Assist MT4 Indicators Momentum Indicators in MT4 |
Platforms: | MetaTrader 4 Indicators |
Trading Skills: | Intermediate |
Indicator Types: | Reversal MT4 Indicators |
Timeframe: | Multi-Timeframe MT4 Indicators |
Trading Style: | Intraday MT4 Indicators |
Trading Instruments: | Share Stocks MT4 Indicators Indices Market MT4 Indicators Commodity Market MT4 Indicators Stock Market MT4 Indicators Cryptocurrency MT4 Indicators Forex MT4 Indicators |
Linear Regression Slope Indicator at a Glance
The Linear Regression Slope Indicator is used to detect significant levels of trend reversal or breakout in markets such as foreign exchange (Forex) and cryptocurrency. This trading tool identifies three key points for entering trades:
- Point 1: Start of the main wave, which can be a recent significant high or low;
- Point 2: End of the corrective wave or the first significant change in price direction;
- Point 3: The second corrective move, where the trend may reverse or break.
The primary difference between the Zigzag indicator and this trading tool lies in the display of fluctuations and the identification of the Trigger Point, where a price break at level 2 triggers a significant change in market momentum.
Indicator in an Uptrend
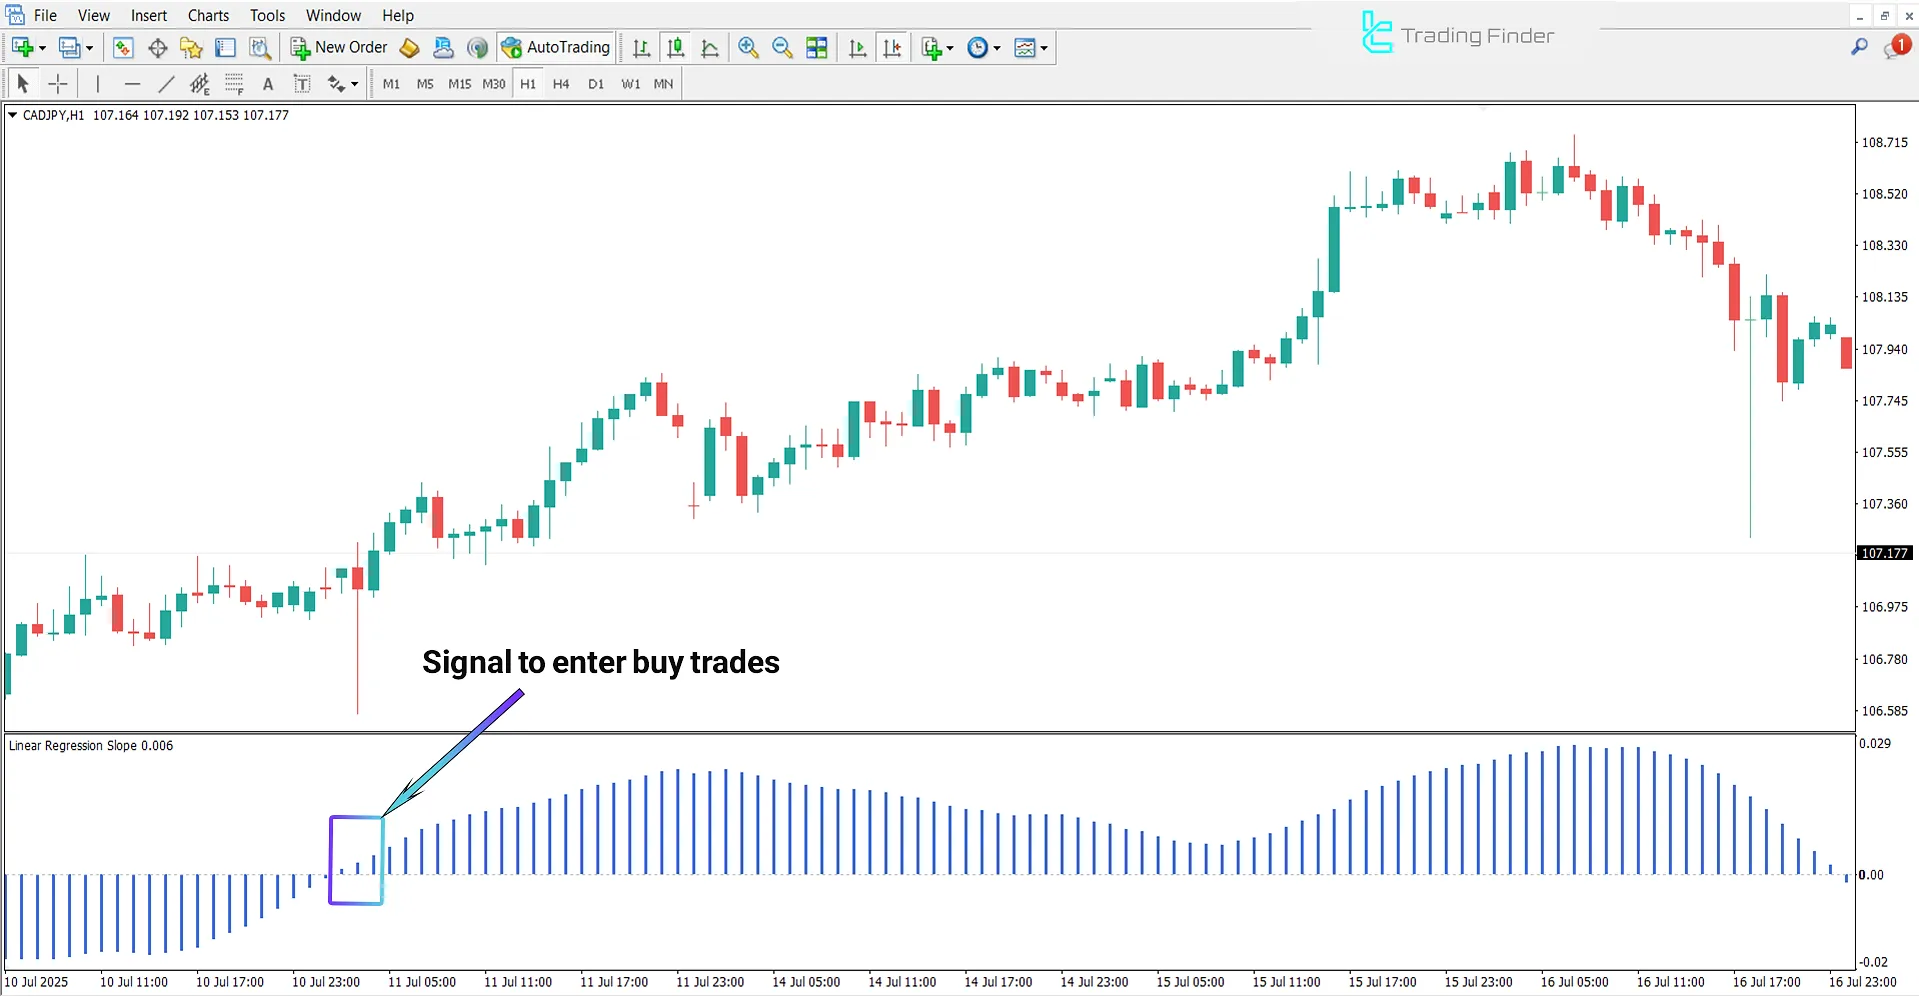
The price chart below shows the CAD/JPY currency pair on a 1-hour time frame.
In an uptrend, the Linear Regression Slope Indicator identifies three consecutive points and marks them in green. In this pattern:
- Point 1 forms at the market's recent low and shows the start of the upward movement;
- Point 2 represents the peak of the first corrective wave and acts as temporary resistance;
- Point 3 shows the downward correction after Point 2 but remains above Point 1, indicating weak selling pressure and strong buying pressure.
A buy entry signal is issued when a bullish candle closes at Point 3, confirming the market's tendency to continue upward.

Indicator in a Downtrend
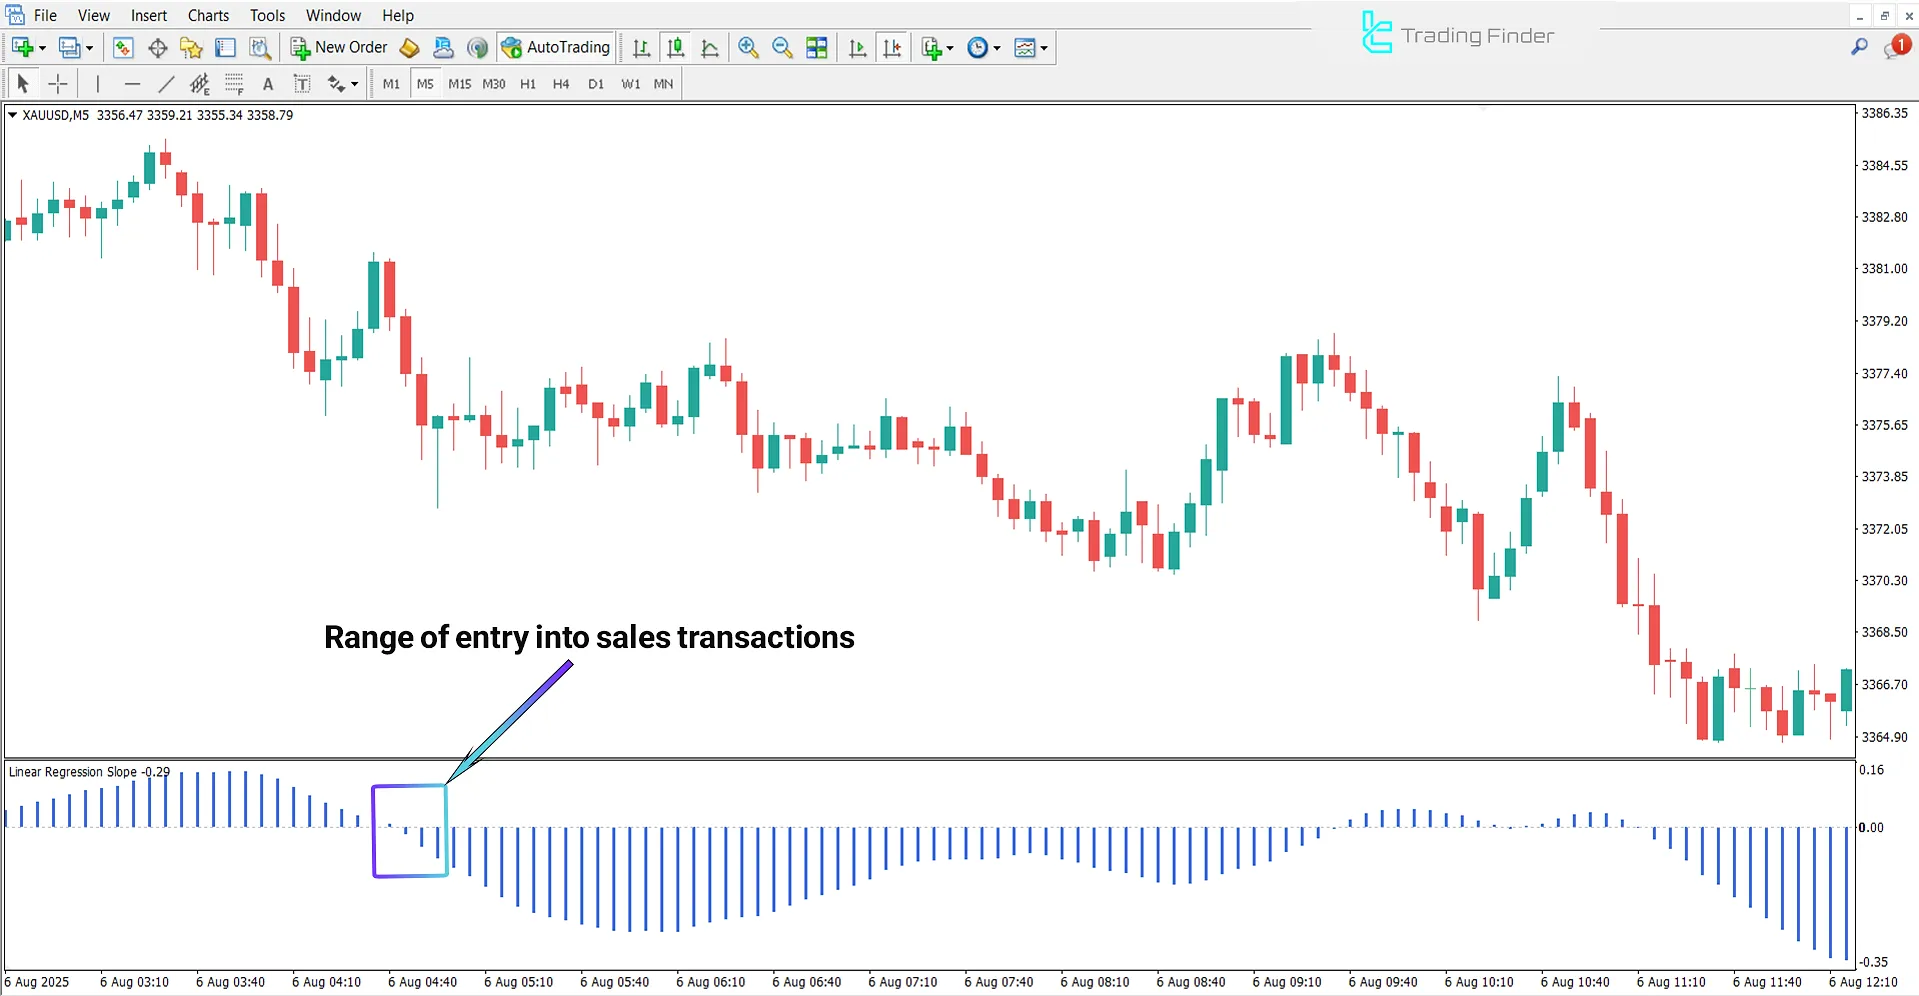
The image below shows the XAU/USD (Gold) index on a 5-minute time frame.
When the linear regression slope is negative and decreasing, it indicates strong selling pressure and a rapid price decline.
A break of the slope below zero into the negative zone signals the possible beginning of a downtrend, and its continued decline confirms the ongoing downward movement.
This signal gains more credibility when combined with bearish candlestick patterns or high trading volumes.

Linear Regression Slope Indicator Settings
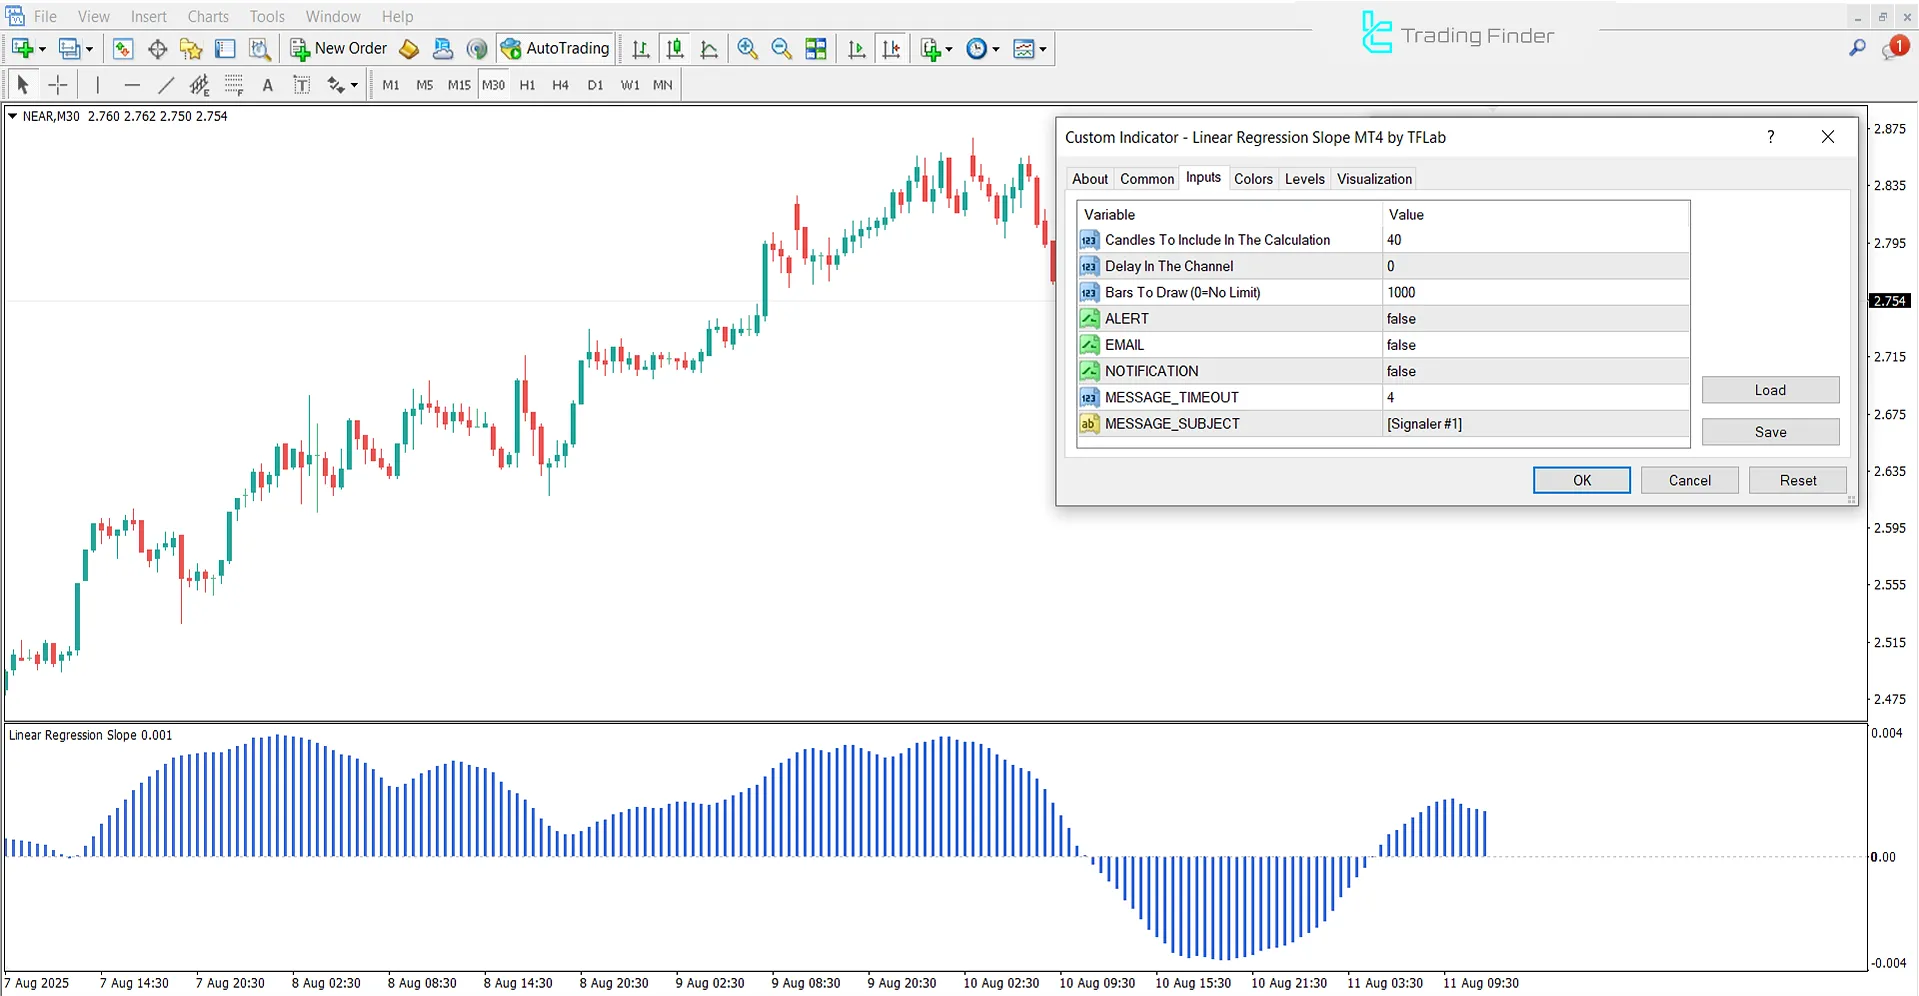
The image below displays the settings for the Linear Regression Slope Indicator in MetaTrader 4:

- Candles To Include In The Calculation: Number of candles to be included in the calculation
- Delay In The Channel: Delay in the channel
- Bars To Draw (0=No Limit): Number of bars to draw
- ALERT: Display alert
- EMAIL: Display email
- NOTIFICATION: Send notification
- MESSAGE_TIMEOUT: Message timeout period
- MESSAGE_SUBJECT: Subject of the message
Conclusion
The Linear Regression Slope Indicator, by calculating the slope of the regression line over a specified period, identifies the strength and direction of market momentum.
The output of this technical analysis indicator is displayed as a histogram, with bars above zero indicating an uptrend and bars below zero indicating a downtrend.
Linear Regression Slope Indicator MT4 PDF
Linear Regression Slope Indicator MT4 PDF
Click to download Linear Regression Slope Indicator MT4 PDFHow is the ranging market detected in the Linear Regression Slope Indicator?
In this trading tool, short bars and fluctuations near the zero line indicate a market with no clear trend.
What does the Linear Regression Slope Indicator exactly measure?
This indicator calculates the slope of the price regression line over a specific period and displays the market's momentum direction and strength.


