![Liquidity Finder Levels Indicator ICT for MT4 Download - Free - [TradingFinder]](https://cdn.tradingfinder.com/image/107273/11-2-en-liquidity-finder-mt4.webp)
![Liquidity Finder Levels Indicator ICT for MT4 Download - Free - [TradingFinder] 0](https://cdn.tradingfinder.com/image/107273/11-2-en-liquidity-finder-mt4.webp)
![Liquidity Finder Levels Indicator ICT for MT4 Download - Free - [TradingFinder] 1](https://cdn.tradingfinder.com/image/28947/11_02_en_liquidity-finder-mt4-02.avif)
![Liquidity Finder Levels Indicator ICT for MT4 Download - Free - [TradingFinder] 2](https://cdn.tradingfinder.com/image/28952/11_02_en_liquidity-finder-mt4-03.avif)
![Liquidity Finder Levels Indicator ICT for MT4 Download - Free - [TradingFinder] 3](https://cdn.tradingfinder.com/image/28967/11_02_en_liquidity-finder-mt4-04.avif)
The Liquidity Finder (LF) in MetaTrader4 indicator helps traders identify liquidity pools. The LF indicator draws the chart's dynamic trend lines (diagonal trend lines) and static trend lines (dotted lines). The static trend lines usually appear in the form of a Double Top or Double Bottom.
Indicator Table
Indicator Categories: | ICT MT4 Indicators Smart Money MT4 Indicators Currency Strength MT4 Indicators Liquidity MT4 Indicators |
Platforms: | MetaTrader 4 Indicators |
Trading Skills: | Intermediate |
Indicator Types: | Leading MT4 Indicators Breakout MT4 Indicators |
Timeframe: | M1-M5 Time MT4 Indicators M15-M30 Time MT4 Indicators H4-H1 Time MT4 Indicators |
Trading Style: | Day Trading MT4 Indicators Intraday MT4 Indicators Scalper MT4 Indicators |
Trading Instruments: | Share Stocks MT4 Indicators Indices Market MT4 Indicators Stock Market MT4 Indicators Cryptocurrency MT4 Indicators Forex MT4 Indicators |
Stop Hunt High

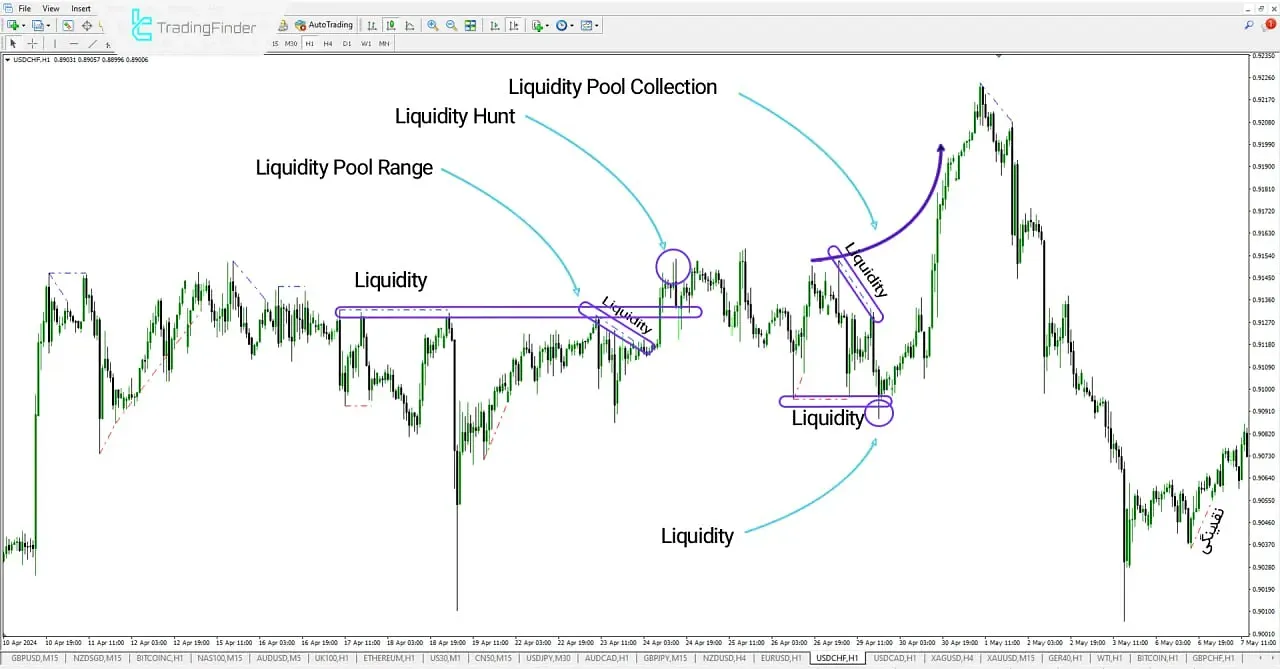
In the USD/CHF currency pair chart, after forming a liquidity pool range with equal highs, the market moved towards the liquidity pool (LF).
Following theliquidity hunt up to the 0.91525 level, the market temporarily corrected and, after gathering the remaining liquidity at the price lows, reached itslowest point at 0.90884. However, after this correction, the market began its upward trend powerfully, with sharp movements.
Stop Hunt Low

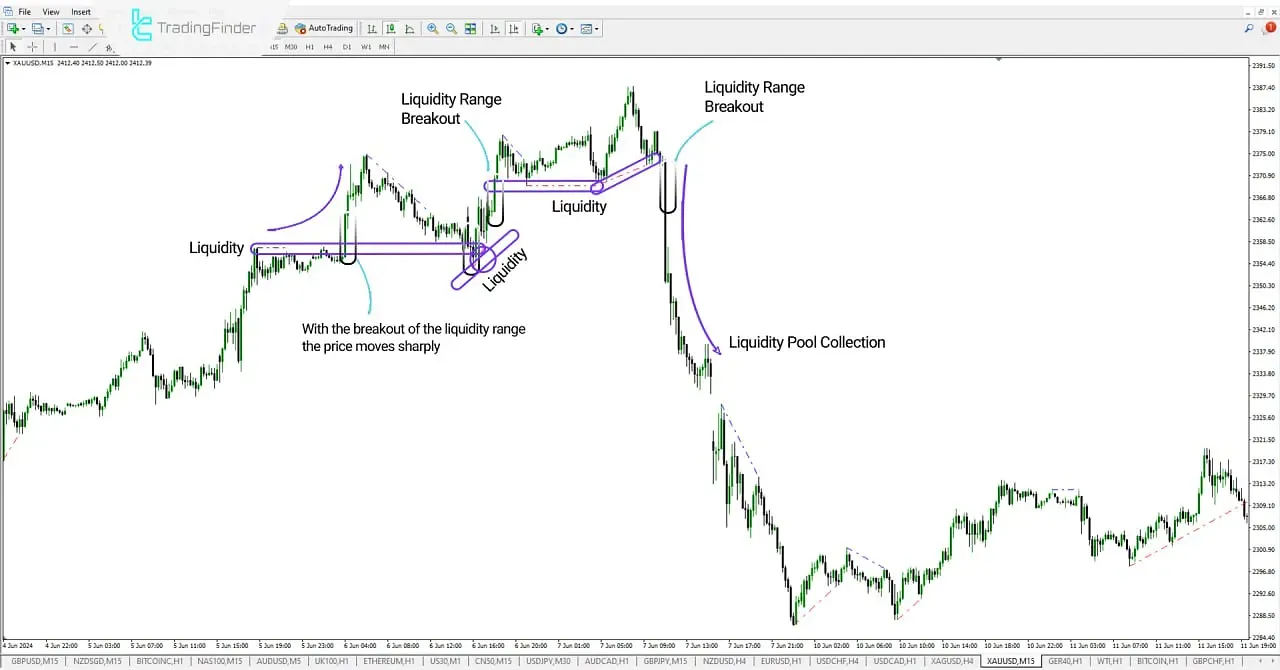
In the 15-minute (XAUUSD) chart, the market first broke through the price high of 2358.50 with a sharp upward move, capturing the necessary liquidity.
The price then retraced to the 2354.40 level, which acted as a support point. At this level, the market gathered liquidity at the low and regained strength, climbing to a new high of 2387.40.
This newlevel acted as a strong resistance, and the market began its downward trend from this point. These changes reflect the market's precise behavior in hunting liquidity and utilizing support and resistance levels.
Indicator settings

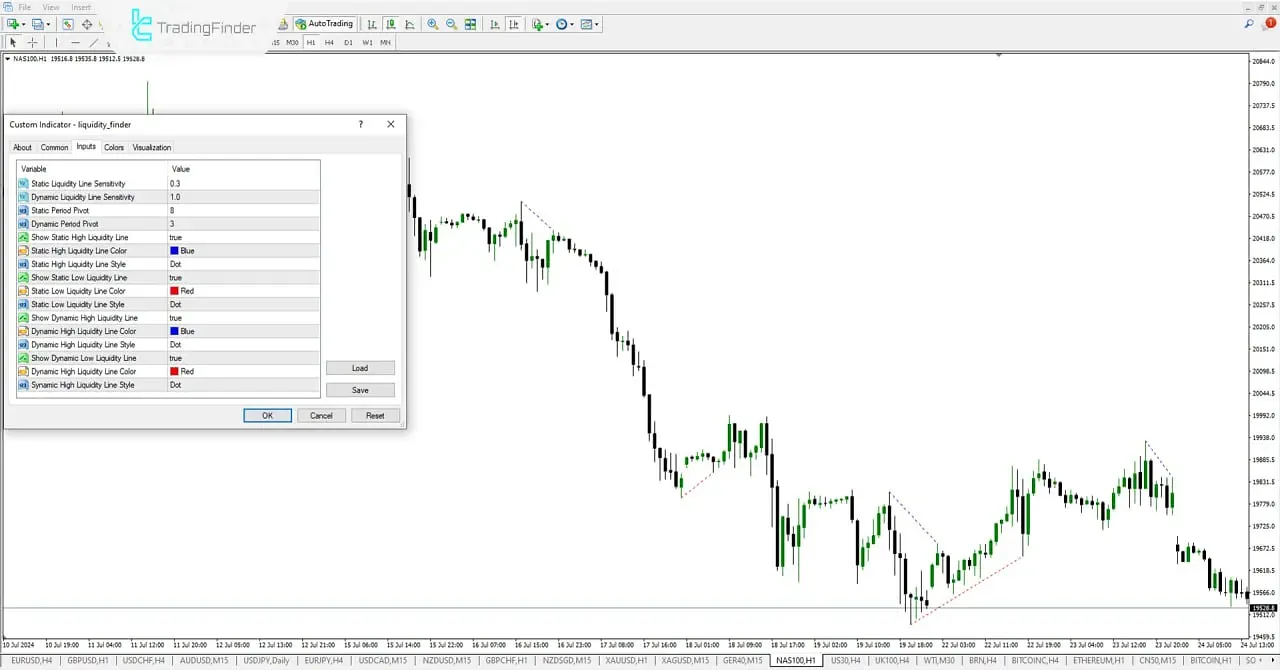
- Static Liquidity Line Sensitivity: Sensitivity of the Static Liquidity Line;
- Dynamic Liquidity Line Sensitivity: Sensitivity of the Dynamic Liquidity Line;
- Static Period Pivot: Static Pivot Period;
- Dynamic Period Pivot: Dynamic Pivot Period;
- Show Static High Liquidity Line: Show Static High Liquidity Line;
- Static High Liquidity Line Color: Color of the Static High Liquidity Line;
- Static High Liquidity Line Style: Style of the Static High Liquidity Line;
- Show Static Low Liquidity Line: Show Static Low Liquidity Line;
- Static Low Liquidity Line Color: Color Settings for the Low Liquidity Line;
- Static Low Liquidity Line Style: Style Settings for the Low Liquidity Line;
- Show Dynamic High Liquidity Line: Show Dynamic High Liquidity Line;
- Dynamic High Liquidity Line Color: Color of the Dynamic High Liquidity Line;
- Dynamic High Liquidity Line Style: Style of the Dynamic High Liquidity Line;
- Show Dynamic Low Liquidity Line: Show Dynamic Low Liquidity Line;
- Dynamic Low Liquidity Line Color: Color of the Dynamic Low Liquidity Line;
- Dynamic Low Liquidity Line Style: Style of the Dynamic Low Liquidity Line.
Summary
The Liquidity Finder (LF) indicator helps traders identify liquidity areas in the market using ICT style on the chart, including levels of retail traders' orders, financial institutions, and banks.
Liquidity Finder Levels ICT MT4 PDF
Liquidity Finder Levels ICT MT4 PDF
Click to download Liquidity Finder Levels ICT MT4 PDFWhat areas does the LF indicator show?
The LF indicator helps traders identify areas where prices have reached similar highs and lows, displaying trend lines that contain liquidity.
Which traders is the LF indicator suitable for?
This indicator is particularly suitable for traders who use ICT (Inner Circle Trader) and Smart Money trading styles.


