![MA Cross Indicator for MetaTrader 4 – Free Download [TradingFinder]](https://cdn.tradingfinder.com/image/467644/2-108-en-ma-cross-mt4-1.webp)
![MA Cross Indicator for MetaTrader 4 – Free Download [TradingFinder] 0](https://cdn.tradingfinder.com/image/467644/2-108-en-ma-cross-mt4-1.webp)
![MA Cross Indicator for MetaTrader 4 – Free Download [TradingFinder] 1](https://cdn.tradingfinder.com/image/467646/2-108-en-ma-cross-mt4-2.webp)
![MA Cross Indicator for MetaTrader 4 – Free Download [TradingFinder] 2](https://cdn.tradingfinder.com/image/467643/2-108-en-ma-cross-mt4-3.webp)
![MA Cross Indicator for MetaTrader 4 – Free Download [TradingFinder] 3](https://cdn.tradingfinder.com/image/467641/2-108-en-ma-cross-mt4-4.webp)
On aug 4, 2025, in version 2, alert/notification and signal functionality was added to this indicator
The MA Cross indicator is a crucial tool in technical analysis, based on the crossover of two moving averages with different time periods, functioning as a linear oscillator.
This indicator not only identifies the market trend direction but also accurately detects key reversal points.
MA Cross Indicator Table
The general features of the MA Cross Indicator are presented in the table below.
Indicator Categories: | Oscillators MT4 Indicators Currency Strength MT4 Indicators Momentum Indicators in MT4 |
Platforms: | MetaTrader 4 Indicators |
Trading Skills: | Elementary |
Indicator Types: | Reversal MT4 Indicators |
Timeframe: | Multi-Timeframe MT4 Indicators |
Trading Style: | Intraday MT4 Indicators |
Trading Instruments: | Stock Market MT4 Indicators Cryptocurrency MT4 Indicators Forex MT4 Indicators |
MA Cross Indicator Overview
The MA Cross indicator displays market trends as a blue linear oscillator, oscillating around the zero line.
Its behavior changes as the positions of the moving averages shift, causing the blue line to move about zero, clearly signaling the trend direction and its possible changes.
This trading tool is composed of two simple moving averages:
- Fast SMA: with a 4-period setting;
- Slow SMA: with a14-period setting.
Indicator in Uptrend
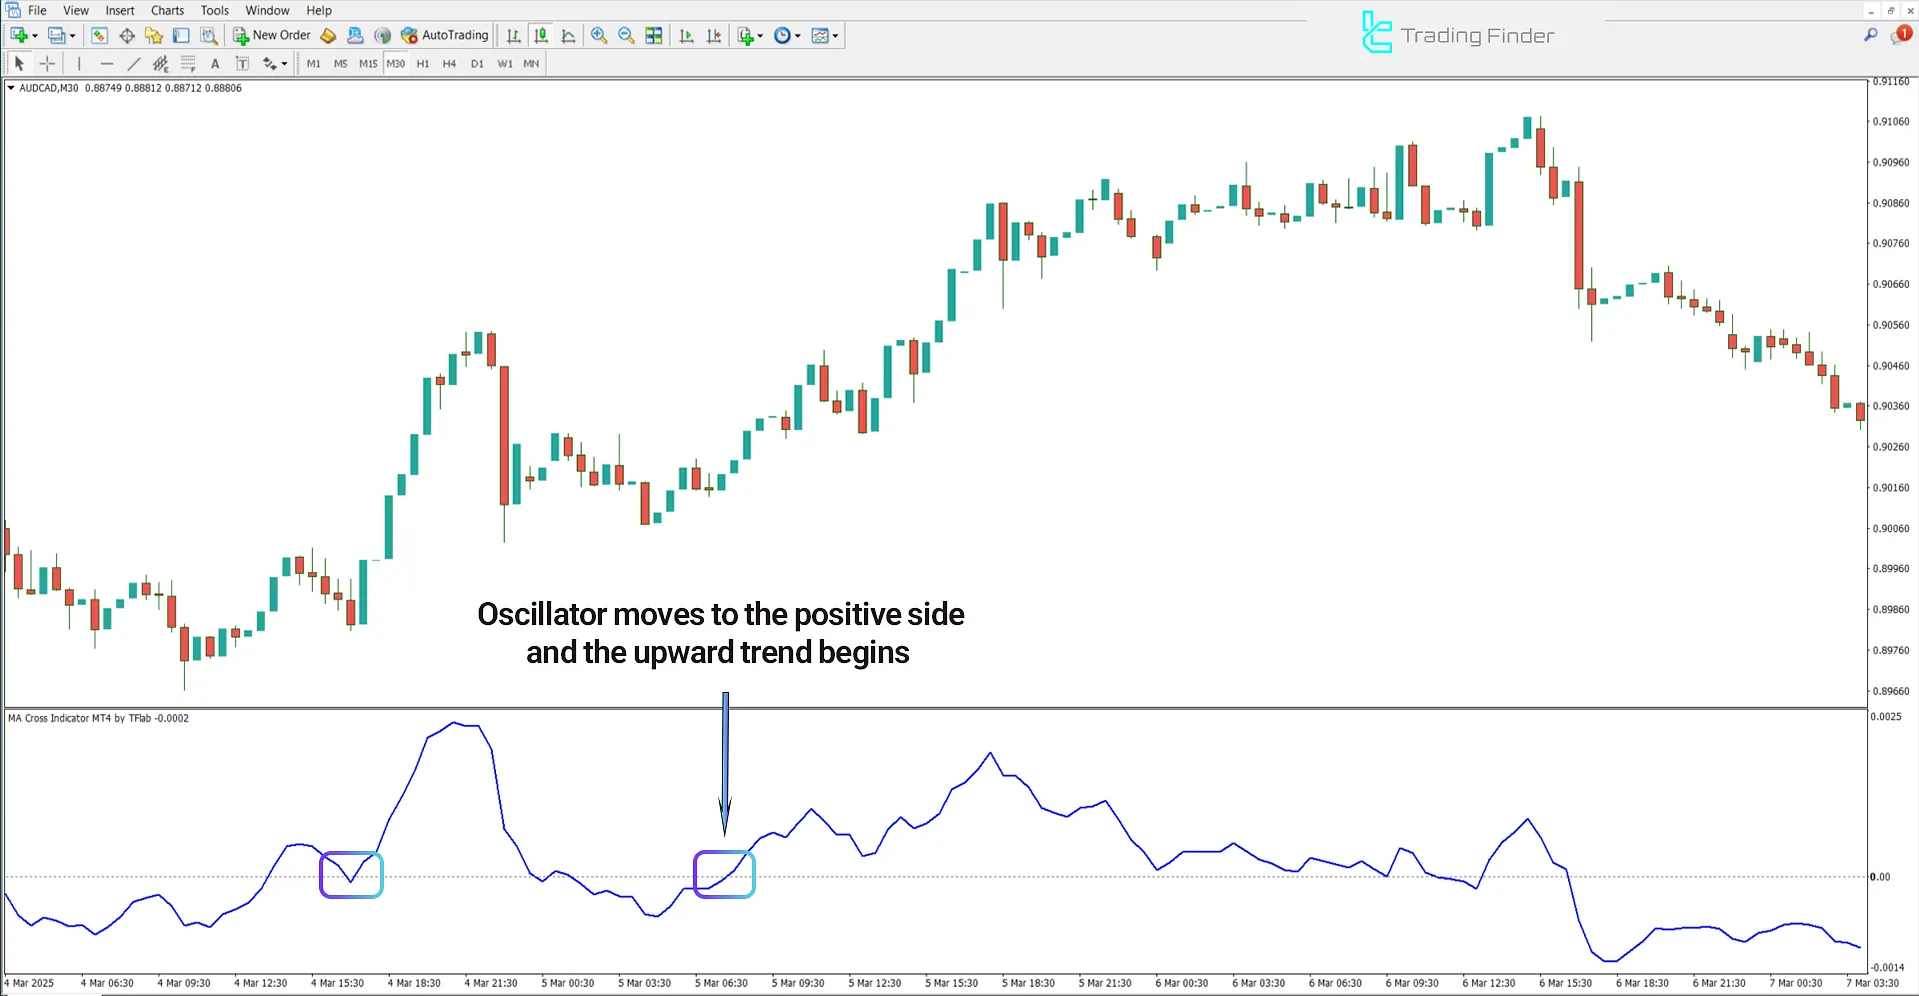
The chart below displays the AUD/CAD currency pair on a 30-minute timeframe. When the fast-moving average (4-period) crosses above the slow-moving average (14-period), the blue oscillator line moves above zero.
This behavior is considered the start of an uptrend and signals increasing buying pressure in the market.

Indicator in Downtrend
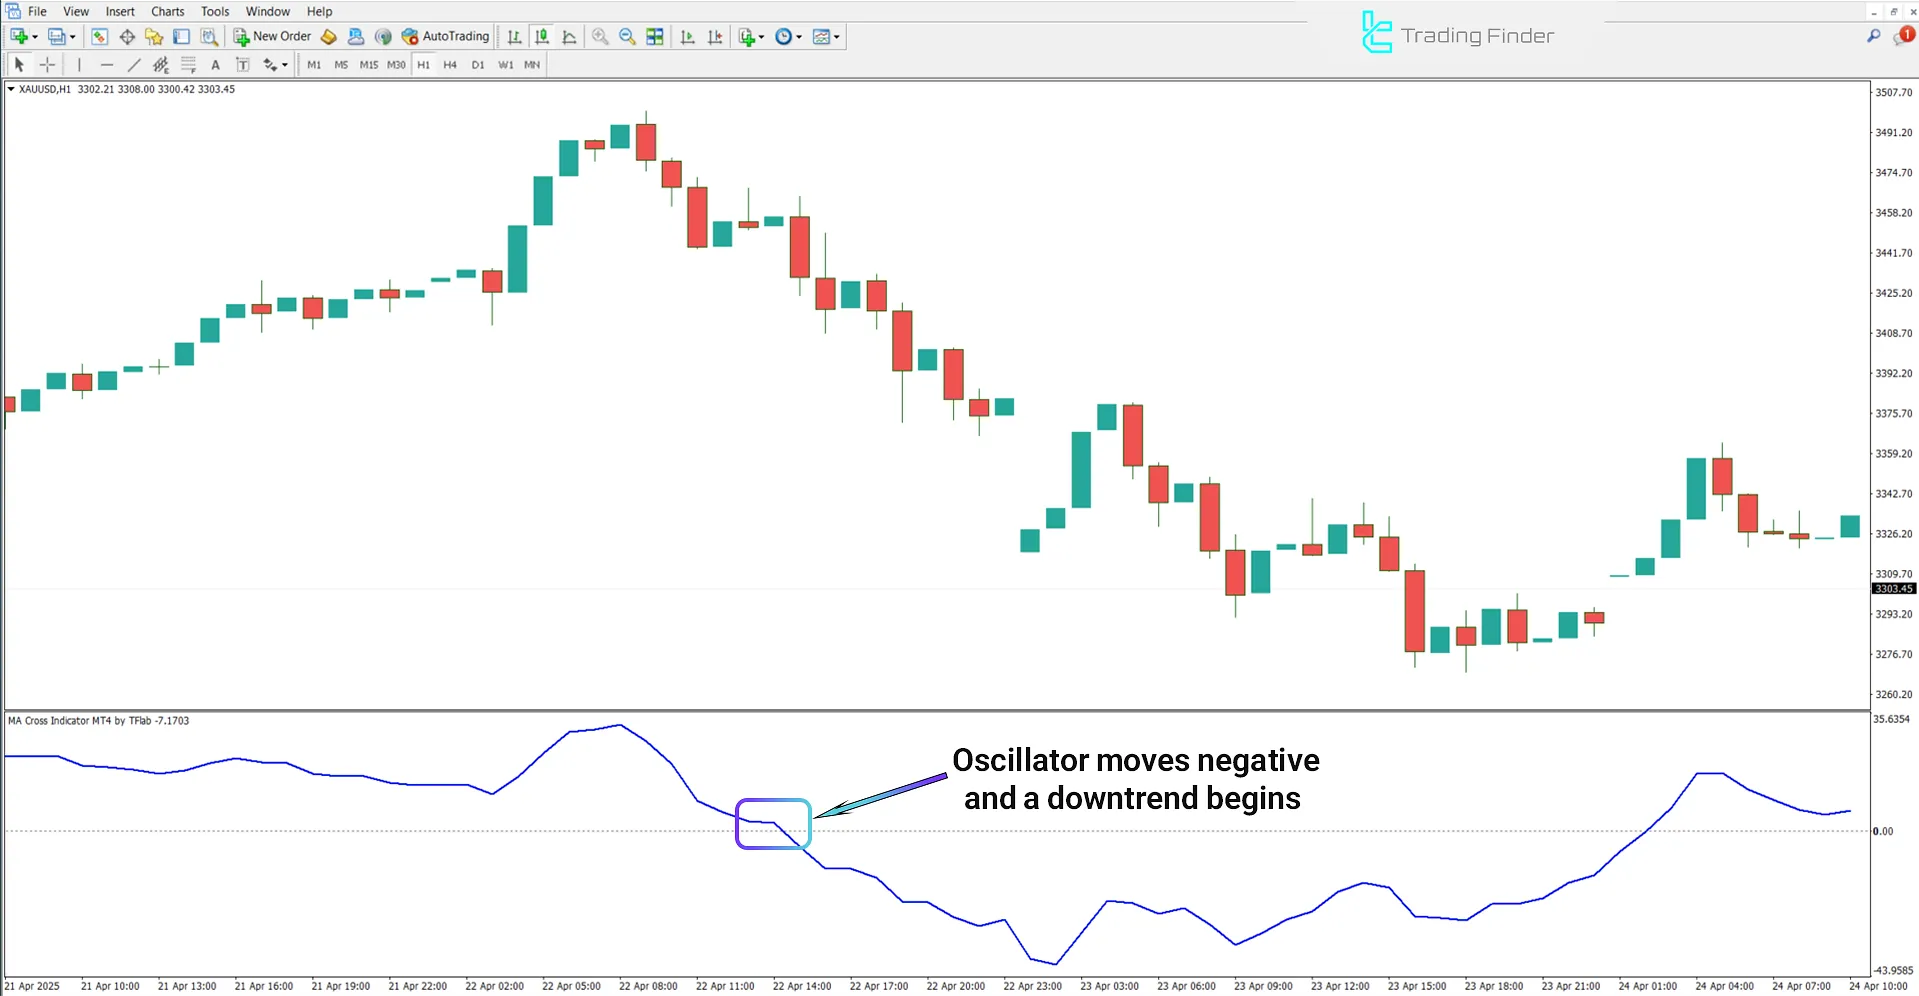
The following image shows Gold Spot (XAU/USD) on a 1-hour timeframe. When the fast-moving average (4-period) crosses below the slow-moving average (14-period), it indicates a potential trend reversal to the downside.
In this condition, the MA Cross oscillator drops below zero, marking the start of a bearish trend and offering a sell entry zone.

MA Cross Indicator Settings
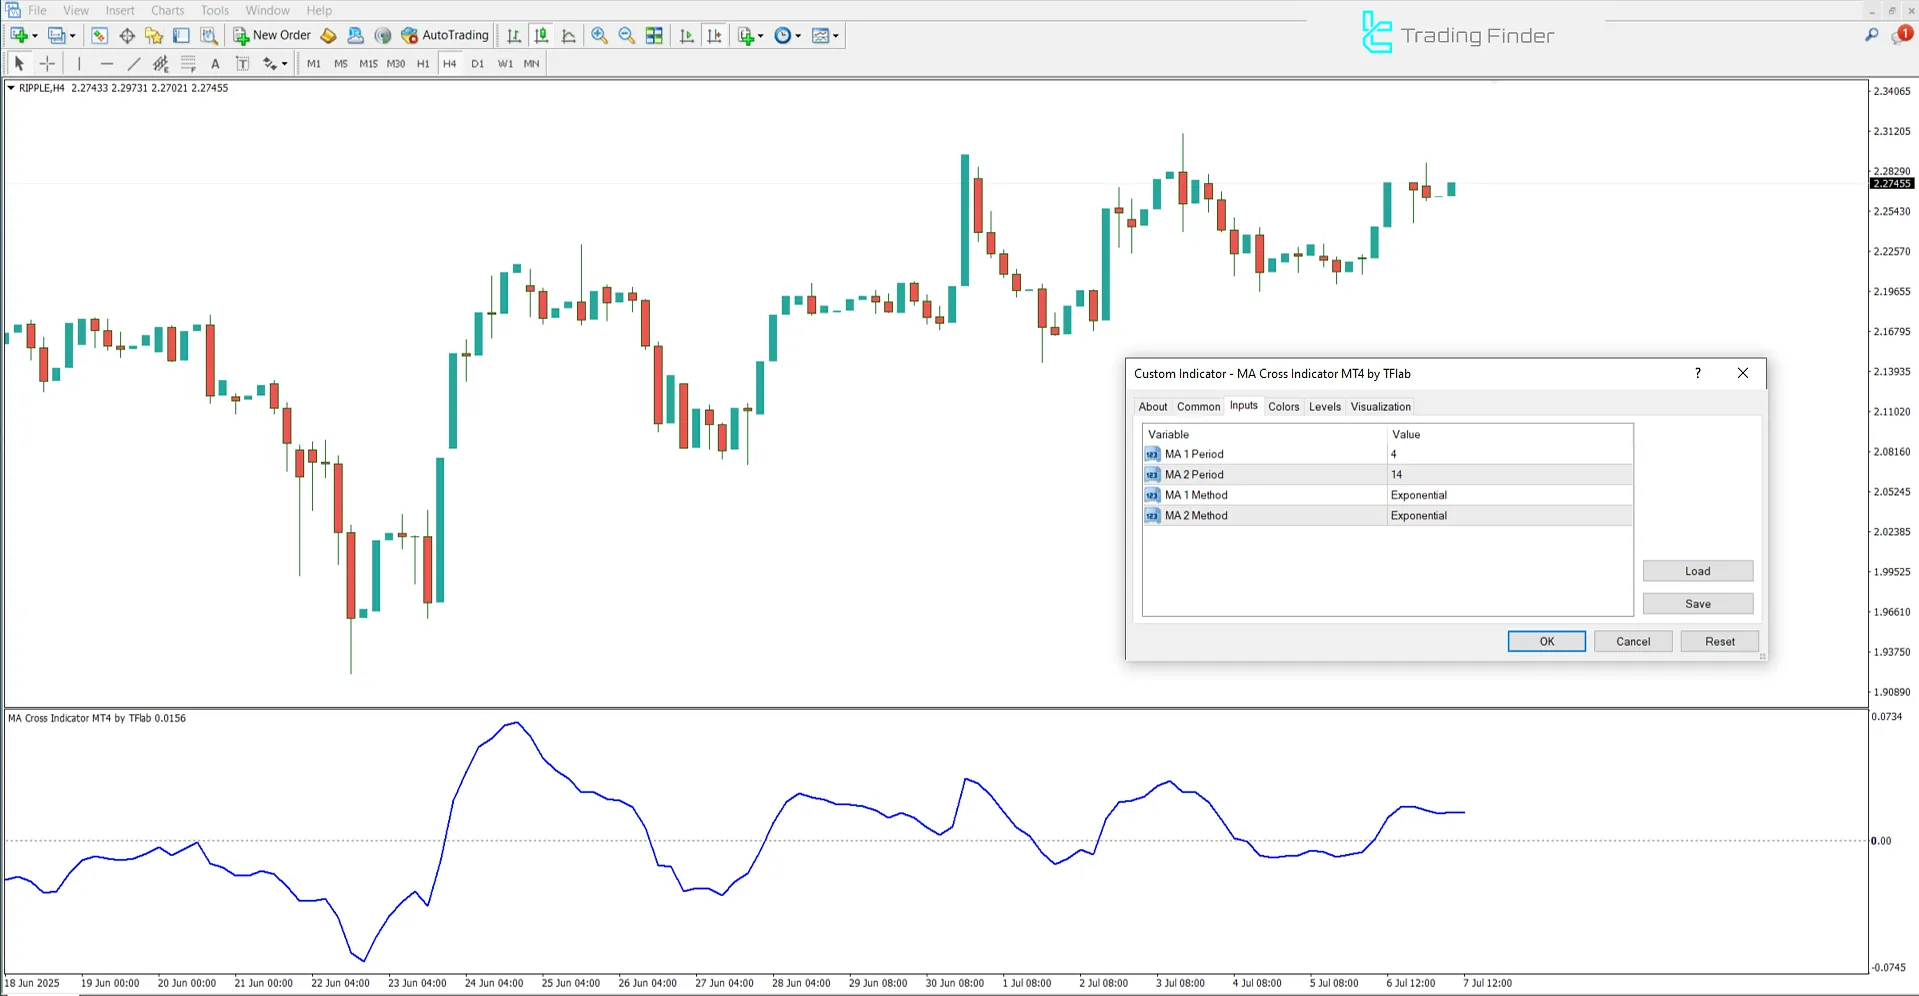
The image below shows the settings panel of the MA Cross oscillator:

- MA 1 Period: Period of the first moving average;
- MA 2 Period: Period of the second moving average;
- MA 1 Method: Type of calculation for the first moving average;
- MA 2 Method: Type of calculation for the second moving average.
Conclusion
The MA Cross indicator is a trend-following technical tool based on the crossover of two moving averages with different time periods (4 and 14 candles), functioning as a linear oscillator centered around the zero axis.
When the oscillator line crosses above zero, it indicates an uptrend; and when it crosses below zero, it signals a downtrend.
MA Cross MT4 PDF
MA Cross MT4 PDF
Click to download MA Cross MT4 PDFIn which markets can the MA Cross Indicator be used?
This indicator is suitable for all trending markets, including Forex, stocks, crypto, and commodities.
Does the MA Cross Indicator perform well in ranging markets?
No. In non-trending (sideways) markets, this tool may produce false or delayed signals.


