![MACD and Volume Indicator for MetaTrader 4 Download – [TradingFinder]](https://cdn.tradingfinder.com/image/335120/2-13-en-macd-and-volume-mt4-1.webp)
![MACD and Volume Indicator for MetaTrader 4 Download – [TradingFinder] 0](https://cdn.tradingfinder.com/image/335120/2-13-en-macd-and-volume-mt4-1.webp)
![MACD and Volume Indicator for MetaTrader 4 Download – [TradingFinder] 1](https://cdn.tradingfinder.com/image/335109/2-13-en-macd-and-volume-mt4-2.webp)
![MACD and Volume Indicator for MetaTrader 4 Download – [TradingFinder] 2](https://cdn.tradingfinder.com/image/335124/2-13-en-macd-and-volume-mt4-3.webp)
![MACD and Volume Indicator for MetaTrader 4 Download – [TradingFinder] 3](https://cdn.tradingfinder.com/image/467408/2-13-en-macd-and-volume-mt4-4.webp)
The MACD and Volume indicator is a tool for analyzing trading volume, identifying trends, and determining entry and exit points in the market. This indicator identifies optimal trading opportunities by combining MACD and volume through divergence, convergence, and volume changes.
MACD and Volume Indicator Specifications Table
Below is a table outlining the specifications of the MACD and Volume indicator in the MetaTrader 4 platform.
Indicator Categories: | Oscillators MT4 Indicators Volatility MT4 Indicators Currency Strength MT4 Indicators MACD Indicators for MetaTrader 4 |
Platforms: | MetaTrader 4 Indicators |
Trading Skills: | Intermediate |
Indicator Types: | Range MT4 Indicators Reversal MT4 Indicators |
Timeframe: | Multi-Timeframe MT4 Indicators |
Trading Style: | Day Trading MT4 Indicators |
Trading Instruments: | Binary Options MT4 Indicators Forward Market MT4 Indicators Stock Market MT4 Indicators Cryptocurrency MT4 Indicators Forex MT4 Indicators |
Uptrend Conditions
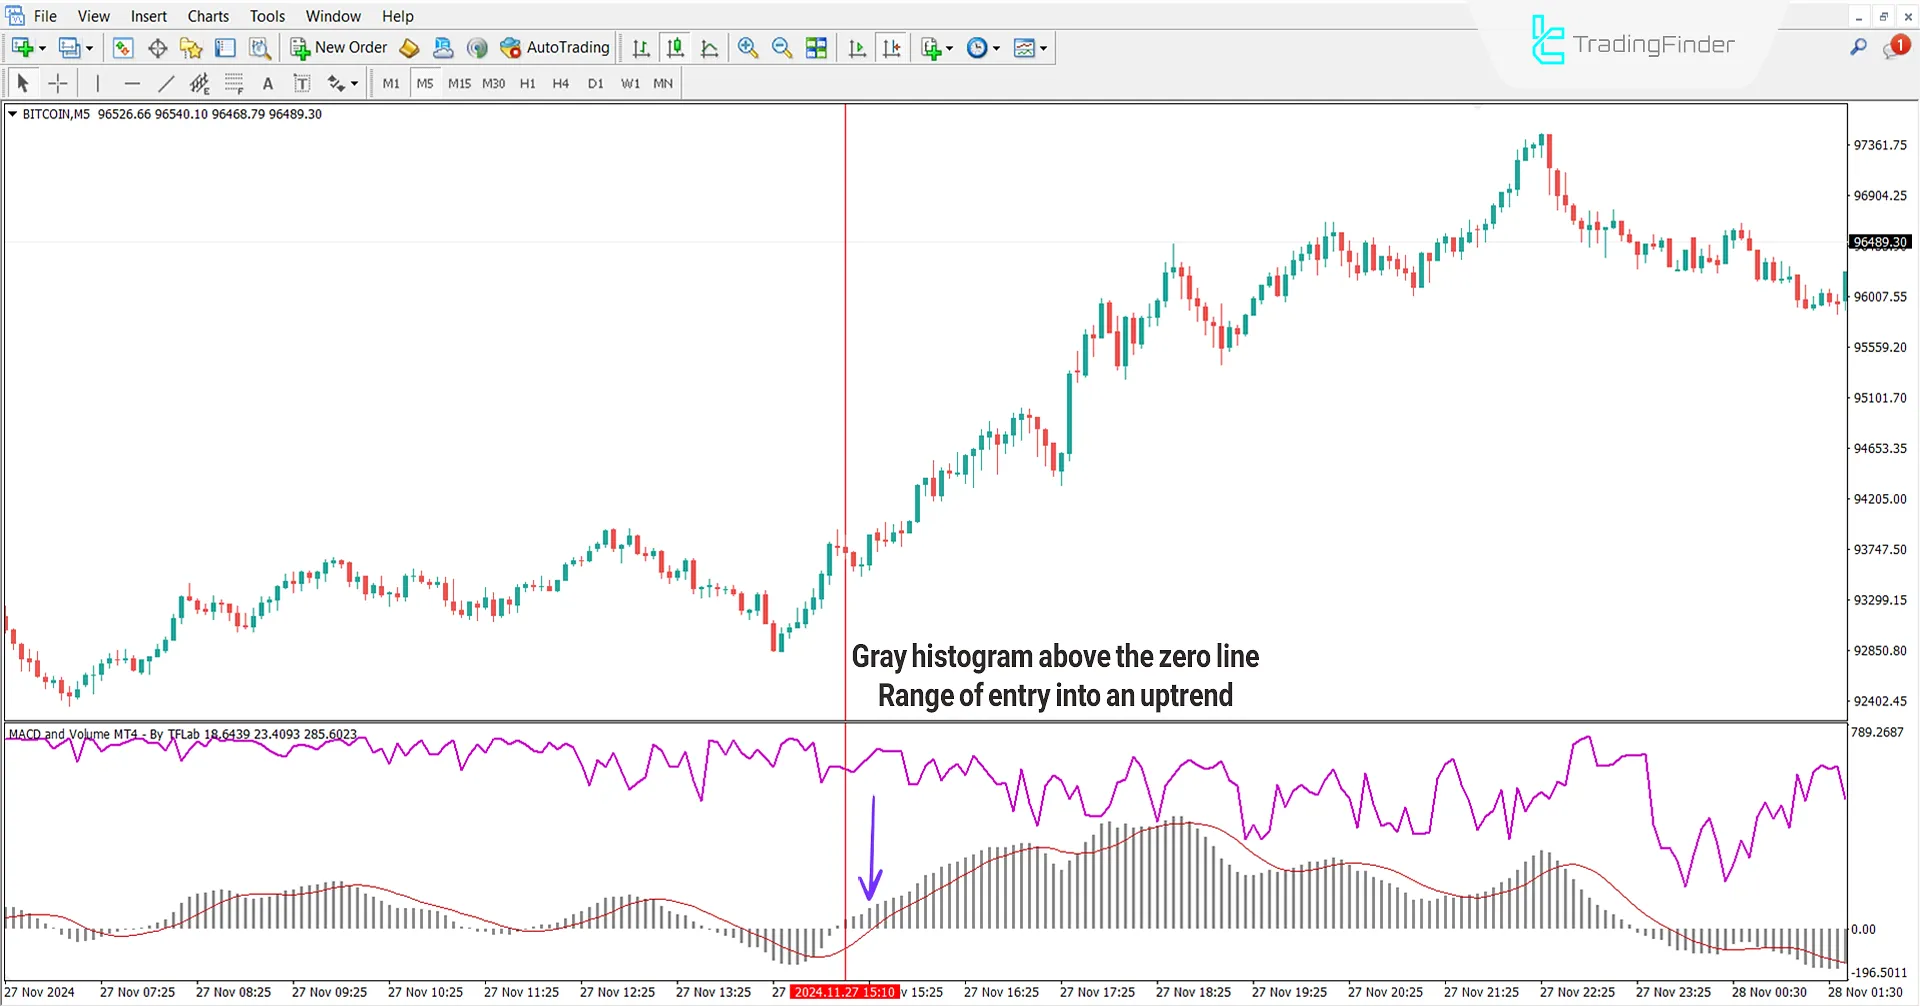
The following price chart displays Bitcoin (BTC) in a 5-minute time frame. The gray histogram bars rising above the zero line and the divergence of the pink line indicate a strong bullish trend and an entry point.

Downtrend Conditions
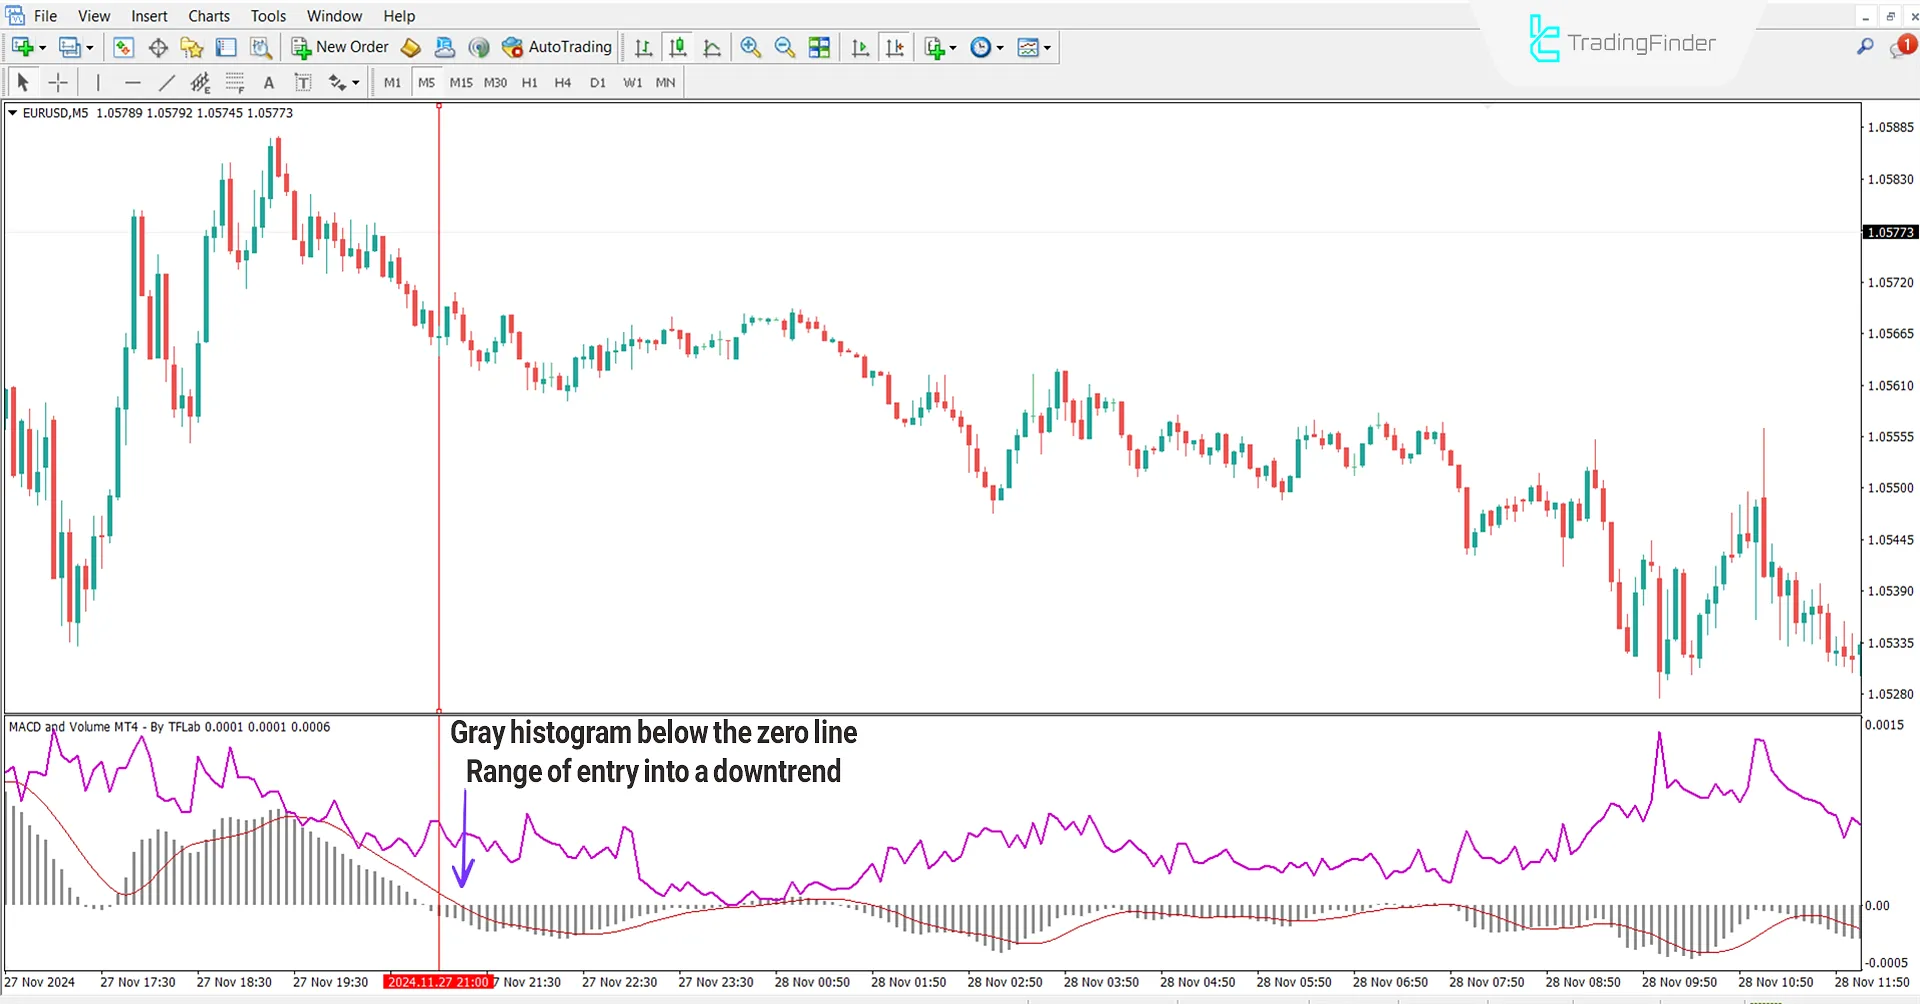
The following price chart illustrates the EUR/USD currency pair in a 5-minute time frame. The gray histogram bars moving below the zero line, combined with decreasing trading volume, indicate selling pressure, the continuation of a bearish trend, and a potential entry point.

Indicator Settings
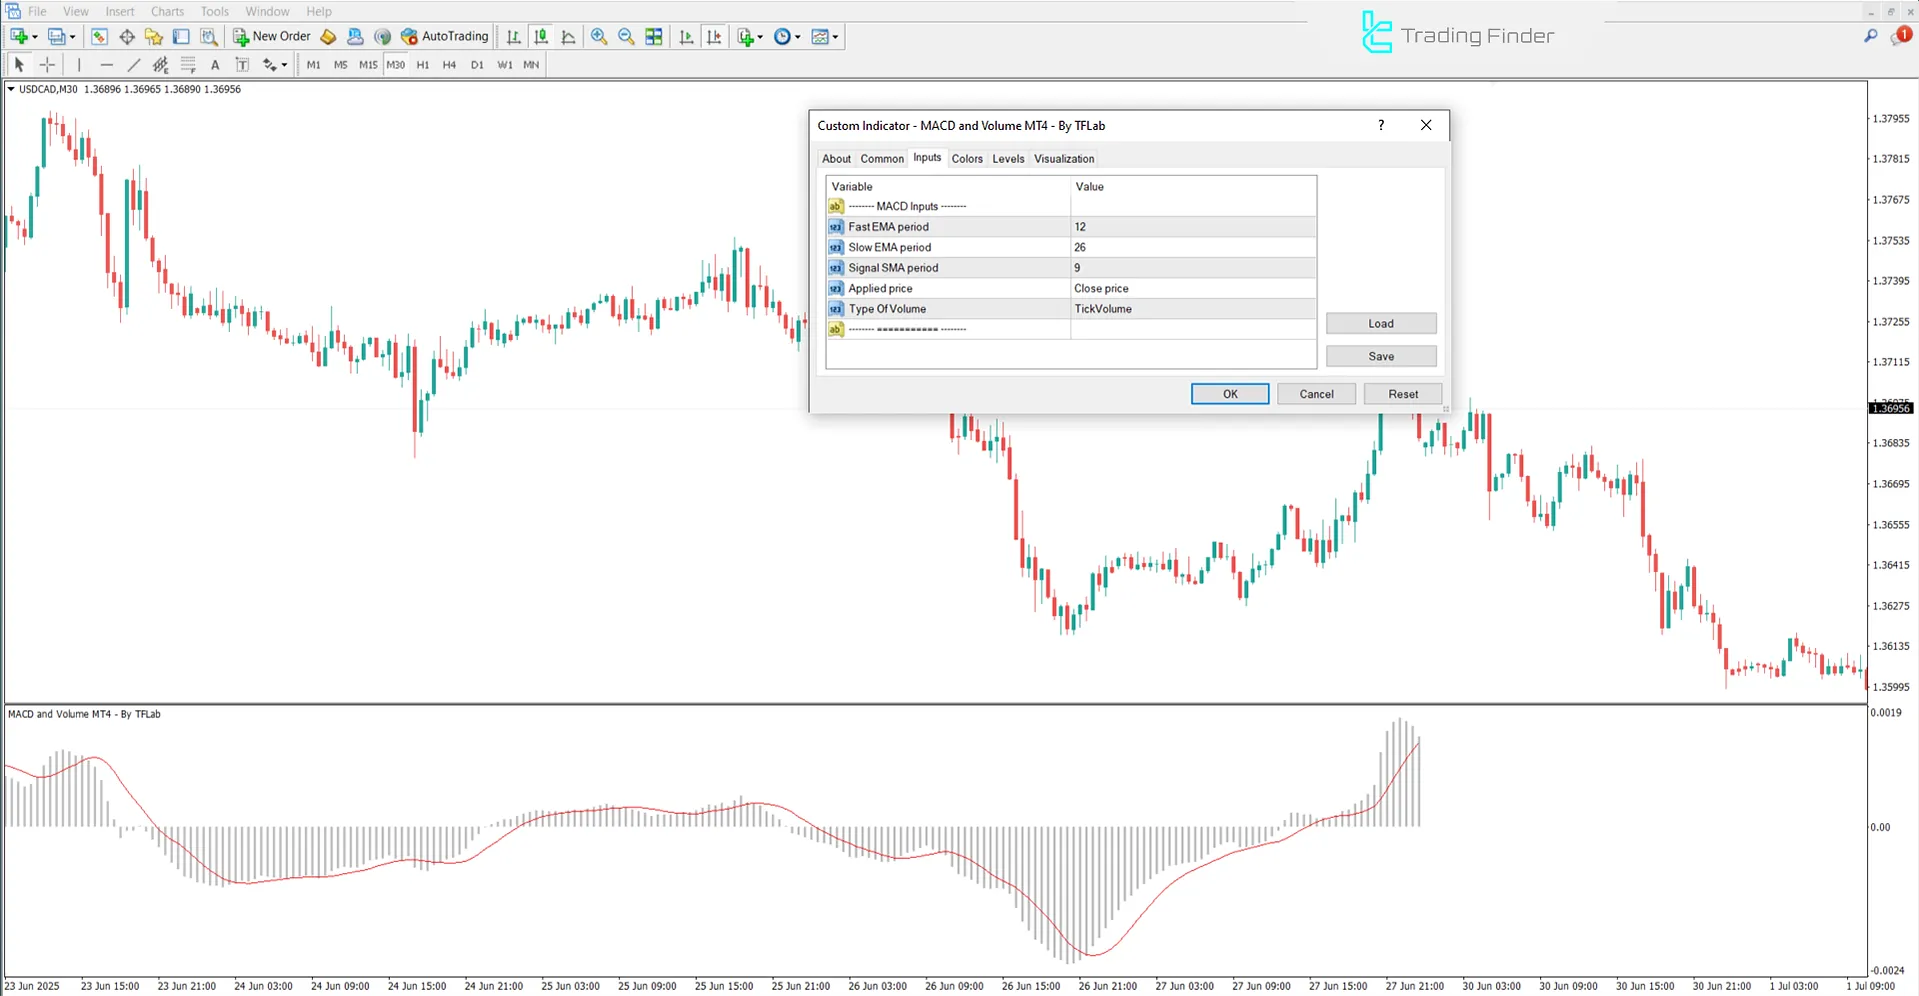
Image below showcases the adjustable settings for the MACD and Volume indicator in the MetaTrader 4 platform:

- Fast EMA Period: Fast Exponential Moving Average period to 12;
- Slow EMA Period: Slow Exponential Moving Average period to 26;
- Signal SMA Period: Signal Simple Moving Average period to 9;
- Applied Price: Applied price;
- Type of Volume: Type of volume;
- Theme: Display theme.
Conclusion
The MACD and Volume indicator combine technical analysis of price trends and trading volume changes simultaneously. By analyzing convergence and divergence in price movement, the MACD identifies trends' strengths and weaknesses. Additionally, trading volume provides insights into a trend's credibility.
MACD Volume MT4 PDF
MACD Volume MT4 PDF
Click to download MACD Volume MT4 PDFWhat is the appropriate time frame for using this MACD and Volume indicator?
This indicator is a multi-time frame and applicable to all time frames.
Which financial markets can this MACD and Volume indicator be used in?
This indicator can be applied in all financial markets.
great thanks


