![MACD Divergence Indicator for MetaTrader4 Download - Free - [TFLab]](https://cdn.tradingfinder.com/image/104952/10-2-en-macd-divergence-mt4.webp)
![MACD Divergence Indicator for MetaTrader4 Download - Free - [TFLab] 0](https://cdn.tradingfinder.com/image/104952/10-2-en-macd-divergence-mt4.webp)
![MACD Divergence Indicator for MetaTrader4 Download - Free - [TFLab] 1](https://cdn.tradingfinder.com/image/34421/10-02-en-macd-divergence-mt4-02.avif)
![MACD Divergence Indicator for MetaTrader4 Download - Free - [TFLab] 2](https://cdn.tradingfinder.com/image/34424/10-02-en-macd-divergence-mt4-03.avif)
![MACD Divergence Indicator for MetaTrader4 Download - Free - [TFLab] 3](https://cdn.tradingfinder.com/image/34430/10-02-en-macd-divergence-mt4-04.avif)
On June 22, 2025, in version 2, alert/notification functionality was added to this indicator
The Automatic MACD Divergence indicator is an essential technical analysis tool and one of the most critical signals for identifying trend reversals or continuations in MetaTrader4 indicator. It automatically detects positive divergences at lows and negative divergences at highs.
A negative divergence occurs when the price makeshigher highs, but the MACD indicator creates lower highs. Conversely, a positive divergence occurs when the price makes lower lows, but the MACD indicator creates higher lows.
Indicator Table
Indicator Categories: | Oscillators MT4 Indicators Signal & Forecast MT4 Indicators Currency Strength MT4 Indicators |
Platforms: | MetaTrader 4 Indicators |
Trading Skills: | Elementary |
Indicator Types: | Reversal MT4 Indicators Non-Repainting MT4 Indicators |
Timeframe: | Multi-Timeframe MT4 Indicators |
Trading Style: | Day Trading MT4 Indicators Fast Scalper MT4 Indicators Scalper MT4 Indicators Swing Trading MT4 Indicators |
Trading Instruments: | Share Stocks MT4 Indicators Indices Market MT4 Indicators Commodity Market MT4 Indicators Stock Market MT4 Indicators Cryptocurrency MT4 Indicators Forex MT4 Indicators |
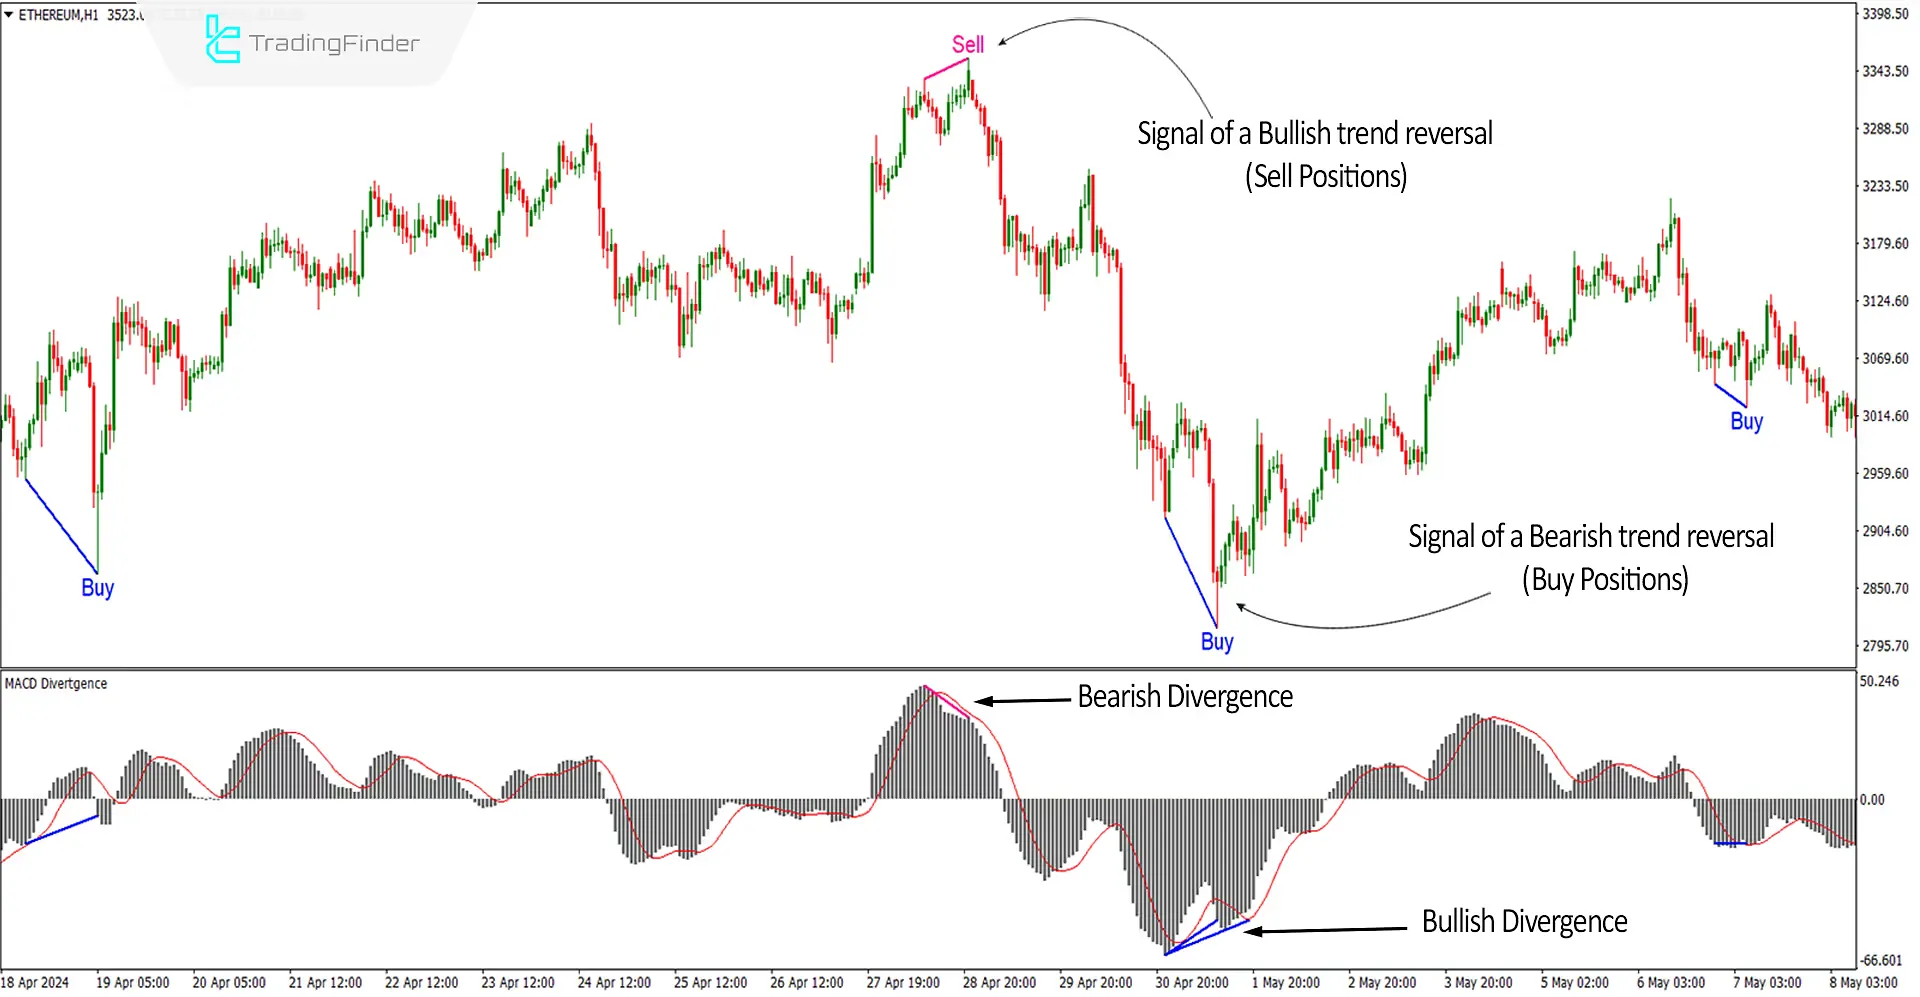
The accompanying chart depicts a 1-hour timeframe of the Ethereum [ETHEREUM] cryptocurrency. Notably, the price reached a higher high following an upward trend at the $3350 price point, indicating continued bullish momentum.
However, abearish divergence was observed in the MACD indicator, as it failed to create a higher high, suggesting a potential uptrend reversal. Conversely, after a downward trend at the $2800 price point, the price formed a lower low, indicating sustained bearish pressure.
However, the MACD indicator displayed apositive divergence by creating a higher low, signaling a possible bullish reversal and the end of the downtrend.

Overview
The automated MACD Divergence indicator is a valuable tool for identifying trend continuations or reversals and can be incorporated into various trading strategies.
It efficiently detects divergences on price charts, providing signals for contrarian and trend-following trades.
Uptrend Signals
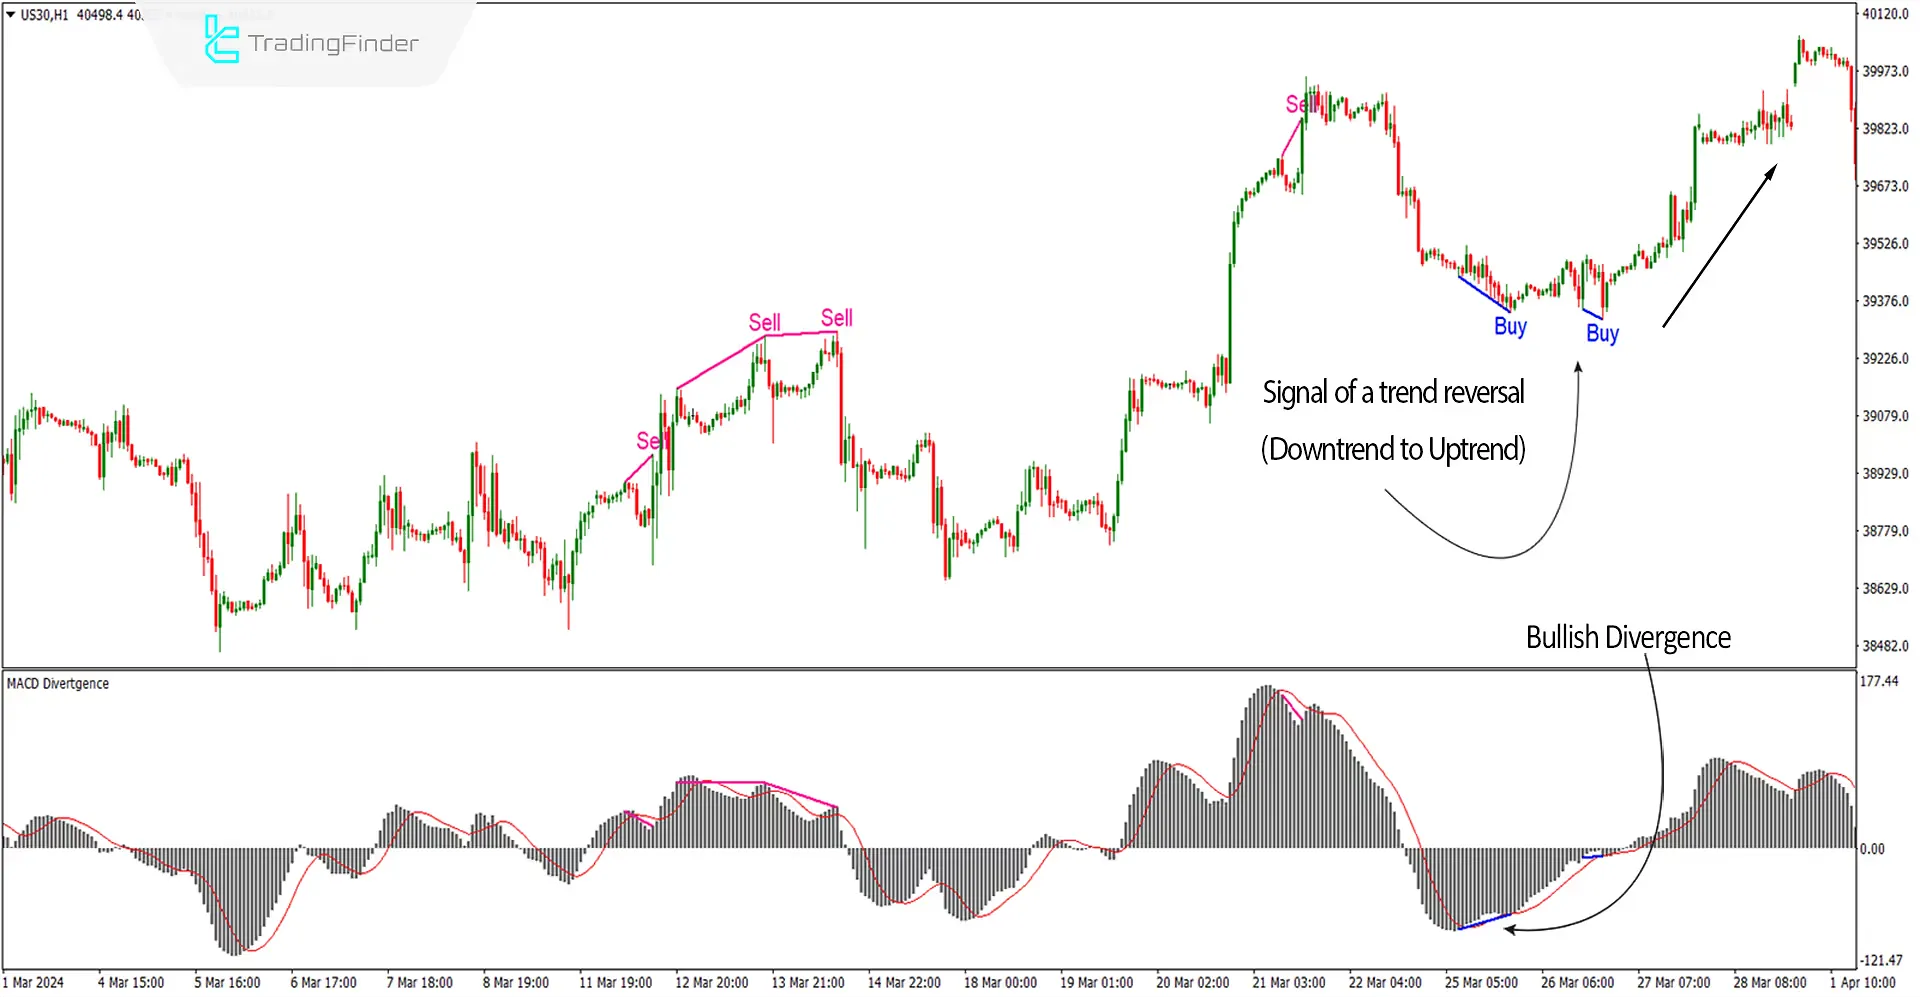
The chart depicts a 1-hour Dow Jones Industrial Average (US30) timeframe. The MACD indicator has identified a positive divergence between two successive swing lows.
Thisdivergence, often seen as a bullish signal, suggests that the downward price momentum may weaken, and a potential upward trend reversal is on the horizon.
The indicator has generated a buy signal on the chart, providing a possible entry point for long positions. However, traders are advised to seek additional confirmation from their specific trading strategy before executing a trade.

Downtrend Signals
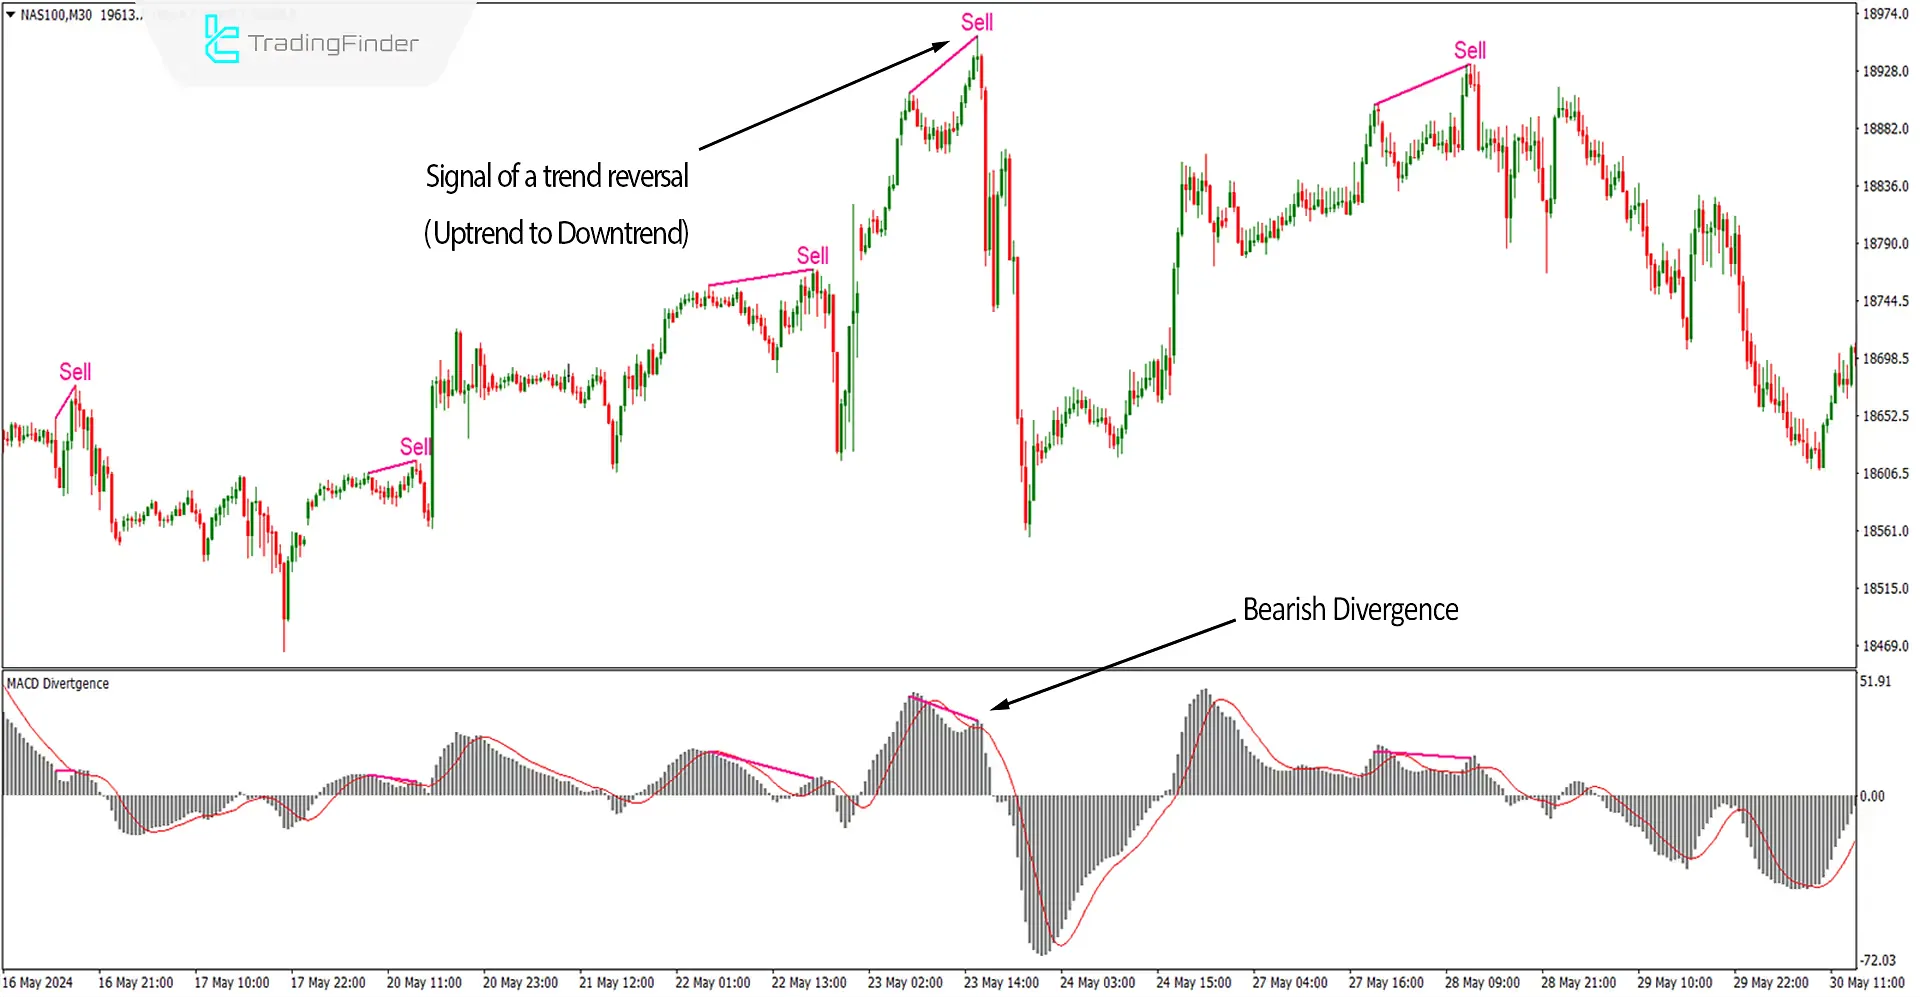
The accompanying chart depicts a 30-minute NASDAQ 100 index (NAS100) timeframe. The MACD indicator has identified a negative divergence between two successive swing highs.
This divergence, often seen as abearish signal, suggests that upward price momentum may weaken and that a potential downward trend reversal is on the horizon. The indicator has generated a sell signal on the chart, providing a possible entry point for short positions.
However, traders are advised to seek additional confirmation from their specific trading strategy before executing a trade.

Settings of the MACD Divergence Indicator

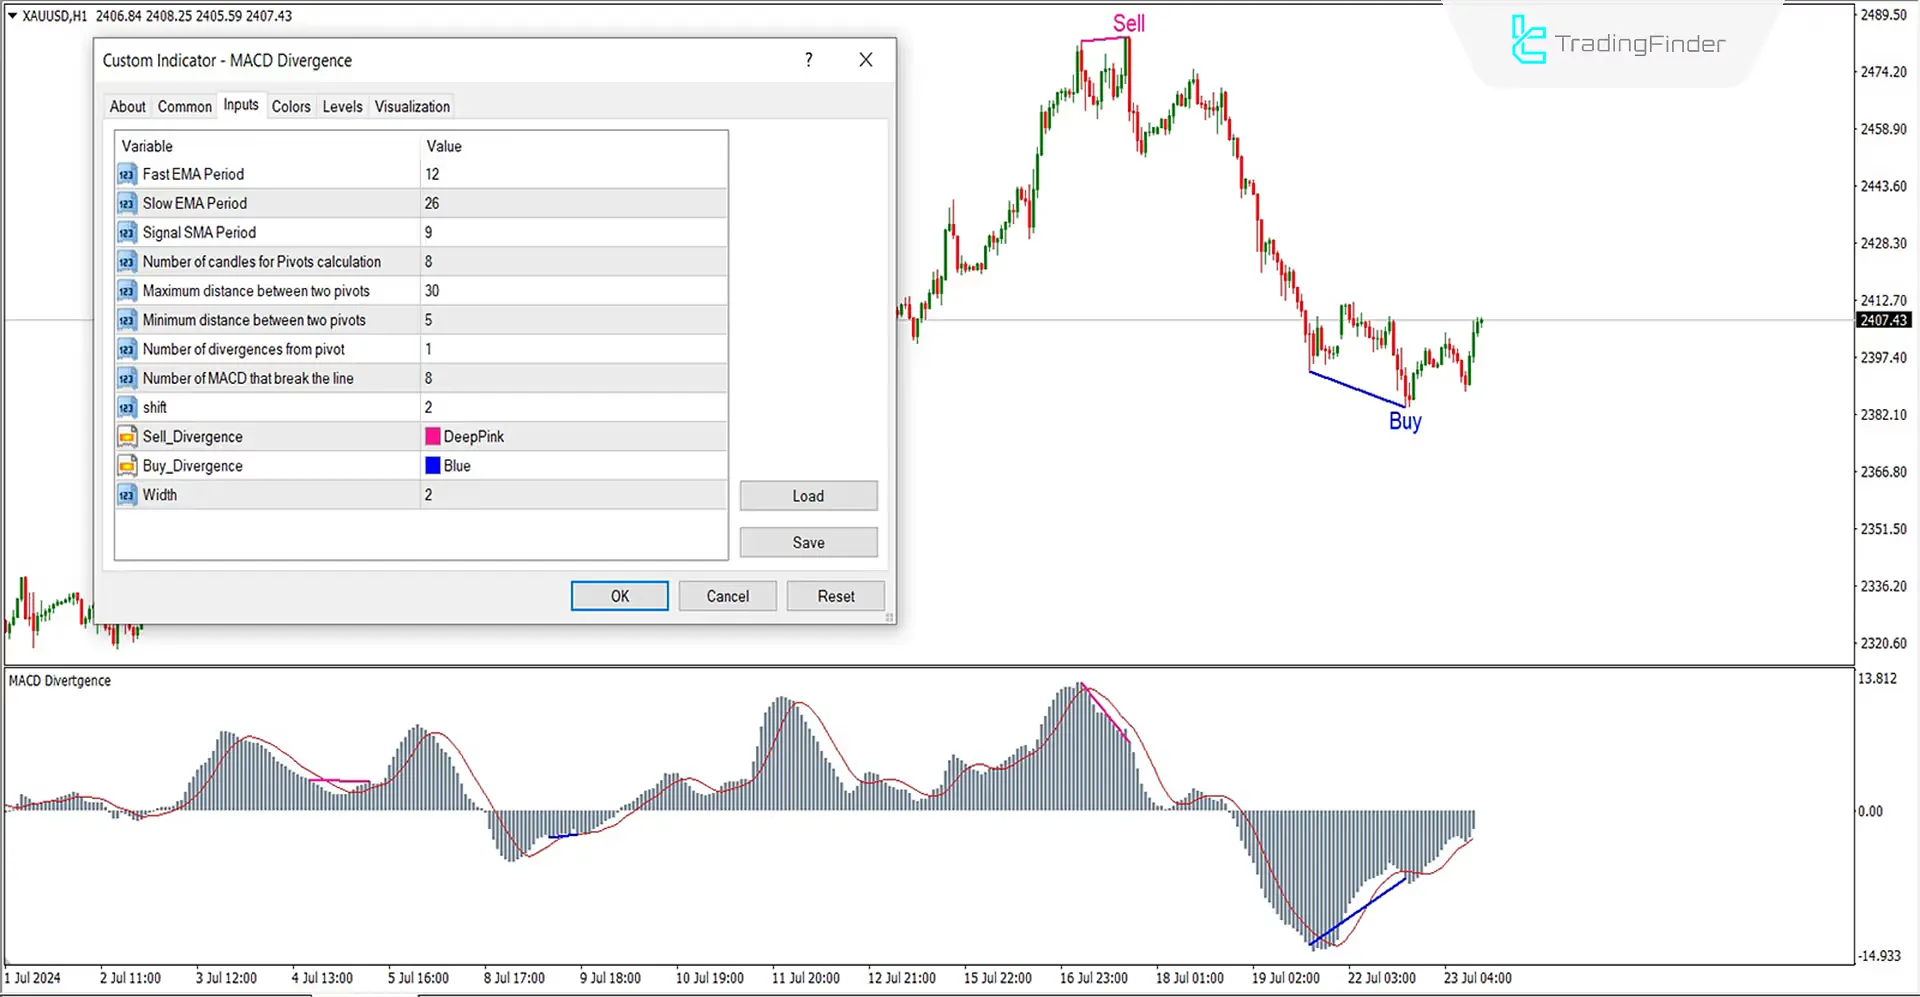
- Fast EMA Period: Use a 12-period Exponential Moving Average;
- Slow EMA Period: Use a 26-period Exponential Moving Average;
- Signal SMA Period: The signal line (in red) is a 9-period Simple Moving Average;
- Number of candles for Pivots calculation: Calculate pivots using 8 candles;
- Maximum distance between two pivots: The maximum distance between two pivots is 30;
- Minimum distance between two pivots: The minimum distance between two pivots is 5;
- Number of divergences from pivot: There should be 1 divergence from each pivot;
- Number of MACD that break the line: 8 MACD lines should break;
- Shift: Set the shift value to 2;
- Sell Divergence: Color the sell signals pink or any color of your choice;
- Buy Divergence: Color the buy signals blue or any color of your choice;
- Width: Set the width of the divergence line to 2.
Conclusion
Most trend reversals on price charts occur in conjunction with divergences. Consequently, one of the most critical applications of the MACD is its ability to identify divergences.
Traders leverage this indicator to detect potential trend reversals or continuations within their trading strategies. A divergence occurs when the price and the indicator move in opposite directions. This discrepancy can signal a possibletrend reversal or a shift in momentum.
Automated divergence oscillator indicator can filter out many of the errors that traders might make when manually identifying divergences.
MACD Divergence MT4 PDF
MACD Divergence MT4 PDF
Click to download MACD Divergence MT4 PDFWhat is the use of an automatic Divergence detection indicator?
This indicator automatically identifies divergences on price charts, which can help traders avoid making mistakes in divergence detection.
Does the MACD Divergence indicator significantly impact price direction?
Yes, this indicator can effectively identify key reversal points or trend continuations.


