![Mouteki Indicator for MT4 Download – Free – [TradingFinder]](https://cdn.tradingfinder.com/image/434813/13-145-en-mouteki-mt4-01.webp)
![Mouteki Indicator for MT4 Download – Free – [TradingFinder] 0](https://cdn.tradingfinder.com/image/434813/13-145-en-mouteki-mt4-01.webp)
![Mouteki Indicator for MT4 Download – Free – [TradingFinder] 1](https://cdn.tradingfinder.com/image/434791/13-145-en-mouteki-mt4-02.webp)
![Mouteki Indicator for MT4 Download – Free – [TradingFinder] 2](https://cdn.tradingfinder.com/image/434802/13-145-en-mouteki-mt4-03.webp)
![Mouteki Indicator for MT4 Download – Free – [TradingFinder] 3](https://cdn.tradingfinder.com/image/434814/13-145-en-mouteki-mt4-04.webp)
The Mouteki Indicator is designed to recognize historical price structures. This tool focuses on trendlines and market reversal points, visually highlighting areas where price has shown significant reaction.
The indicator draws two dynamic trendlines by connecting previous highs and lows. Additionally, it displays two horizontal lines representing key support and resistance levels.
One of its features is displaying information, such as UTDand LTD, at the top-left corner of the chart under the "Comment" section.
Mouteki Indicator Specifications Table
The technical specifications of the indicator are as follows:
Indicator Categories: | Support & Resistance MT4 Indicators Trading Assist MT4 Indicators Levels MT4 Indicators |
Platforms: | MetaTrader 4 Indicators |
Trading Skills: | Elementary |
Indicator Types: | Breakout MT4 Indicators Reversal MT4 Indicators |
Timeframe: | Multi-Timeframe MT4 Indicators |
Trading Style: | Day Trading MT4 Indicators Scalper MT4 Indicators Swing Trading MT4 Indicators |
Trading Instruments: | Share Stocks MT4 Indicators Indices Market MT4 Indicators Commodity Market MT4 Indicators Stock Market MT4 Indicators Cryptocurrency MT4 Indicators Forex MT4 Indicators |
Mouteki Indicator at a Glance
During price movements, intersections or proximity to these lines can signal a shift in the market phase. As the price approaches these lines, traders can monitor the trend's reaction and act accordingly.
For better clarity, the Mouteki Indicator uses two distinct colors (red and green) for plotting lines on the chart.
Uptrend
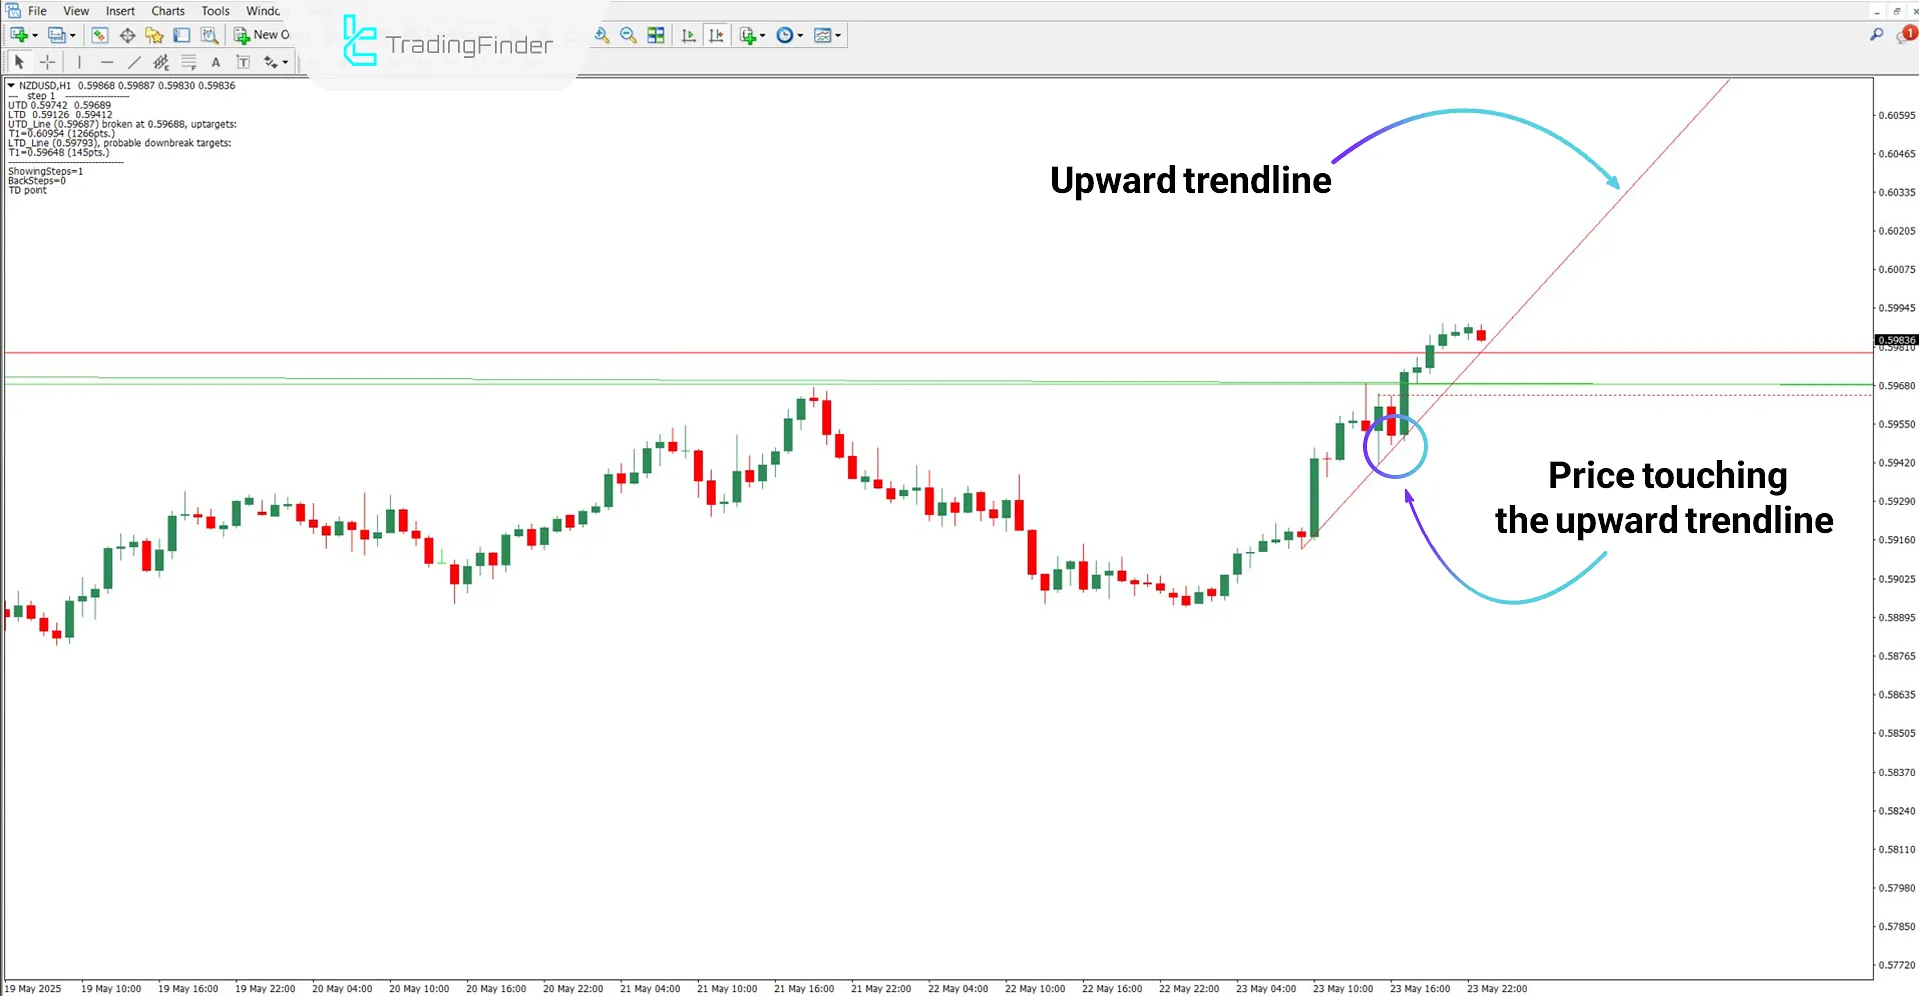
Based on the NZD/USD currency pair chart in the 1-hour timeframe, the Mouteki Indicator plots an upward trendline in red.
As shown in the image, the price reacts to this line, providing an opportunity to enter buy trades.

Downtrend
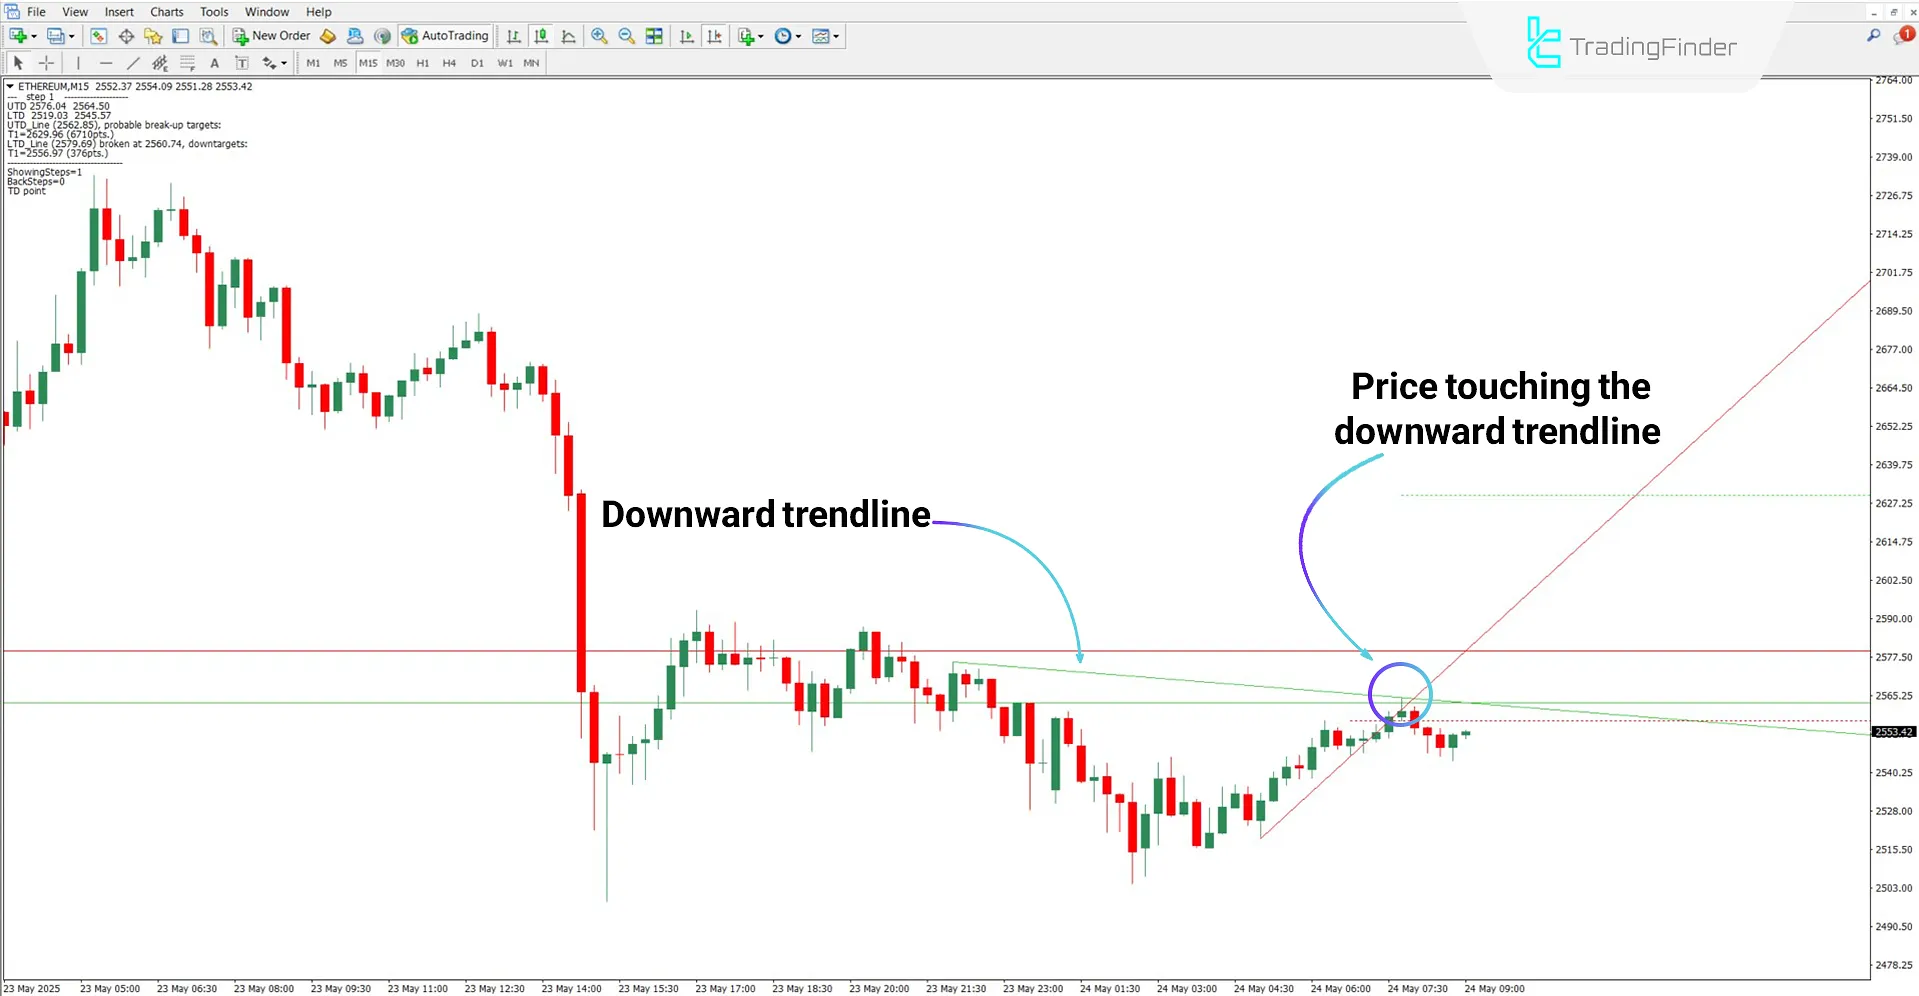
According to the 15-minute timeframe chart of Ethereum (ETH), the price hits the downward dynamic trendline.
Additionally, it breaks the upward dynamic trendline (red), which could be a sign of a bearish tendency.

Mouteki Indicator Settings
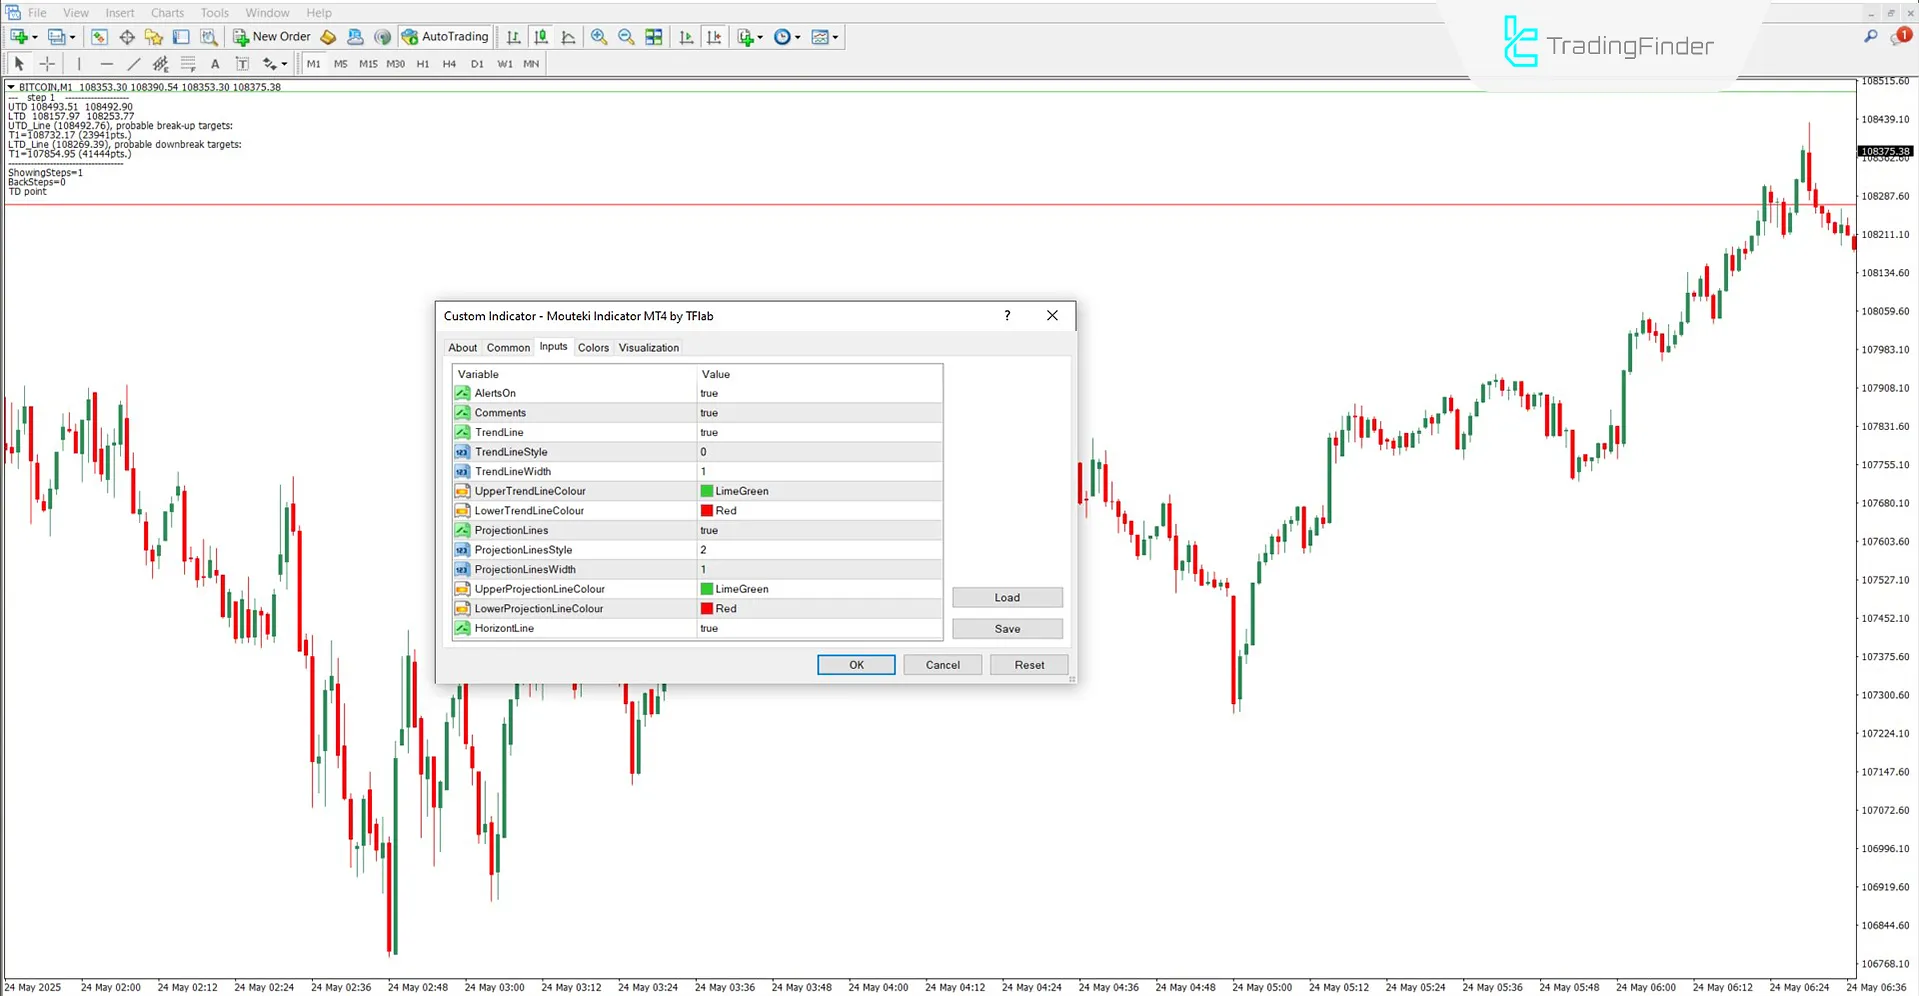
Adjustable settings in the Mouteki Indicator are shown in the following image:

- AlertsOn: Enable alerts
- Comments: Enable comment display
- TrendLine: Show main trendline
- TrendLineStyle: Trendline style
- TrendLineWidth: Set trendline width
- UpperTrendLineColour: Set the color of the upper trendline
- LowerTrendLineColour: Set the color of the lower trendline
- ProjectionLines: Enable projection lines
- ProjectionLineStyle: Projection line style
- ProjectionLinesWidth: Projection line width
- UpperProjectionLineColour: The color of the upper projection line
- LowerProjectionLineColour: The color of the lower projection line
- HorizontLine: Enable horizontal lines
Conclusion
The Mouteki Indicator, relying on historical price highs and lows, automatically plots trendlines and support and resistance levels.
The goal of this trading tool is to identify high-reaction zones, such as trend continuation or structure breakouts.
Traders can analyze bullish or bearish scenarios based on the price's position relative to these lines to determine entry points.
Mouteki MT4 PDF
Mouteki MT4 PDF
Click to download Mouteki MT4 PDFDoes the Mouteki Indicator provide entry signals?
No, this indicator does not issue any entry or exit signals.
Is this indicator only applicable to cryptocurrency charts?
No, this indicator can be used freely across all markets without limitation.
Congratulations on all the indicators. Will you make the Mouteki indicator available for tradingView?
Thanks a lot . We’ll consider adding it in the future.


