


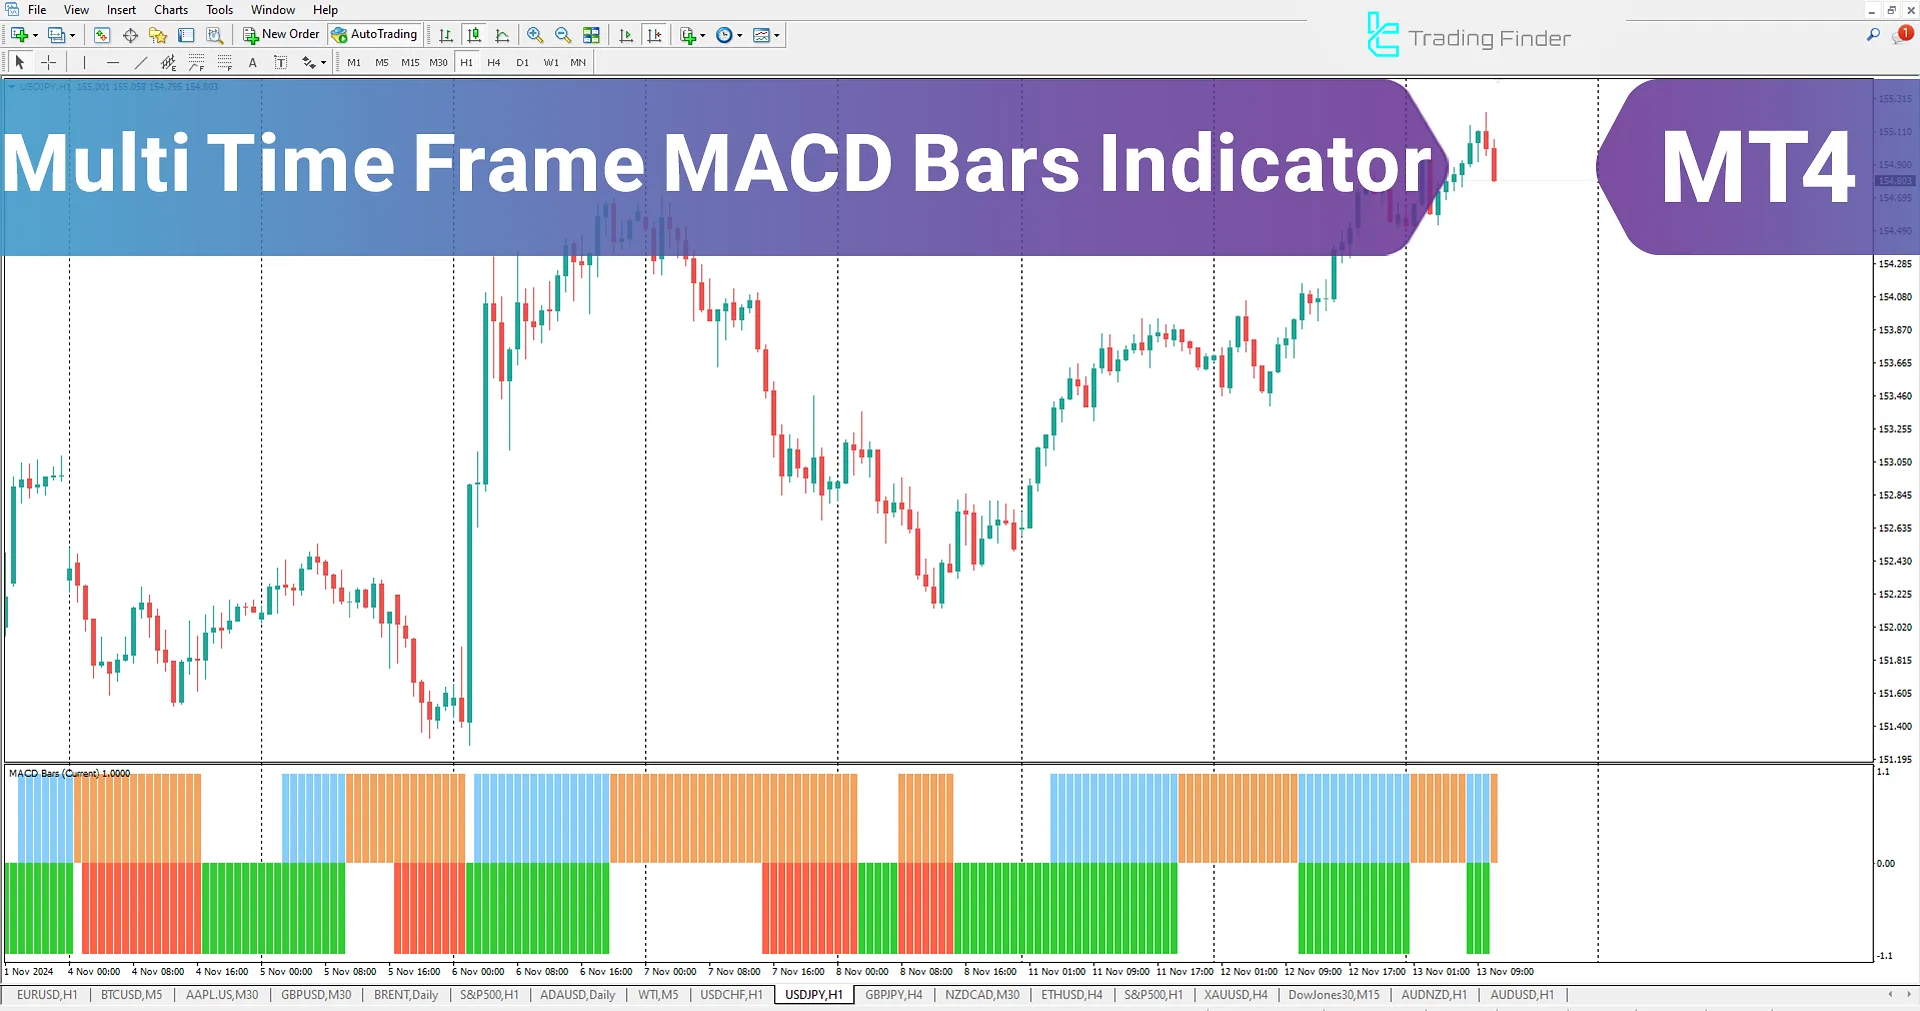
The Multi-Timeframe MACD Bars Indicator is a MetaTrader 4 indicator designed based on the MACD indicator, providing traders with the ability to analyze across multiple timeframes.
This indicator displays the MACD status in the form of a histogram with four colors.
These features help traders to better understand the price trends and reversal points, allowing them to determine their trading positions with greater precision.
Additionally, the indicator can be configured to display the MACD status on different timeframes, enabling traders to perform accurate multi-timeframe analysis.
Indicator Table
The specifications of the indicator are shown in the table below.
Indicator Categories: | Oscillators MT4 Indicators Signal & Forecast MT4 Indicators Trading Assist MT4 Indicators MACD Indicators for MetaTrader 4 |
Platforms: | MetaTrader 4 Indicators |
Trading Skills: | Elementary |
Indicator Types: | Entry and Exit MT4 Indicators Lagging MT4 Indicators |
Timeframe: | Multi-Timeframe MT4 Indicators |
Trading Style: | Day Trading MT4 Indicators Intraday MT4 Indicators Scalper MT4 Indicators |
Trading Instruments: | Indices Market MT4 Indicators Cryptocurrency MT4 Indicators Forex MT4 Indicators |
Indicator Overview
This indicator enables the analysis of the MACD across different timeframes and utilizes four colors (green, blue, red, and orange) to display various MACD conditions. When the MACD is above both the signal line and the zero level, the histogram in green and blue indicates an uptrend; and when the MACD is below the signal line or under the zero level, the histogram in red and orange indicates weakness in the uptrend or a downtrend. Additionally, setting a custom timeframe allows traders to accurately analyze the MACD status without changing the chart.
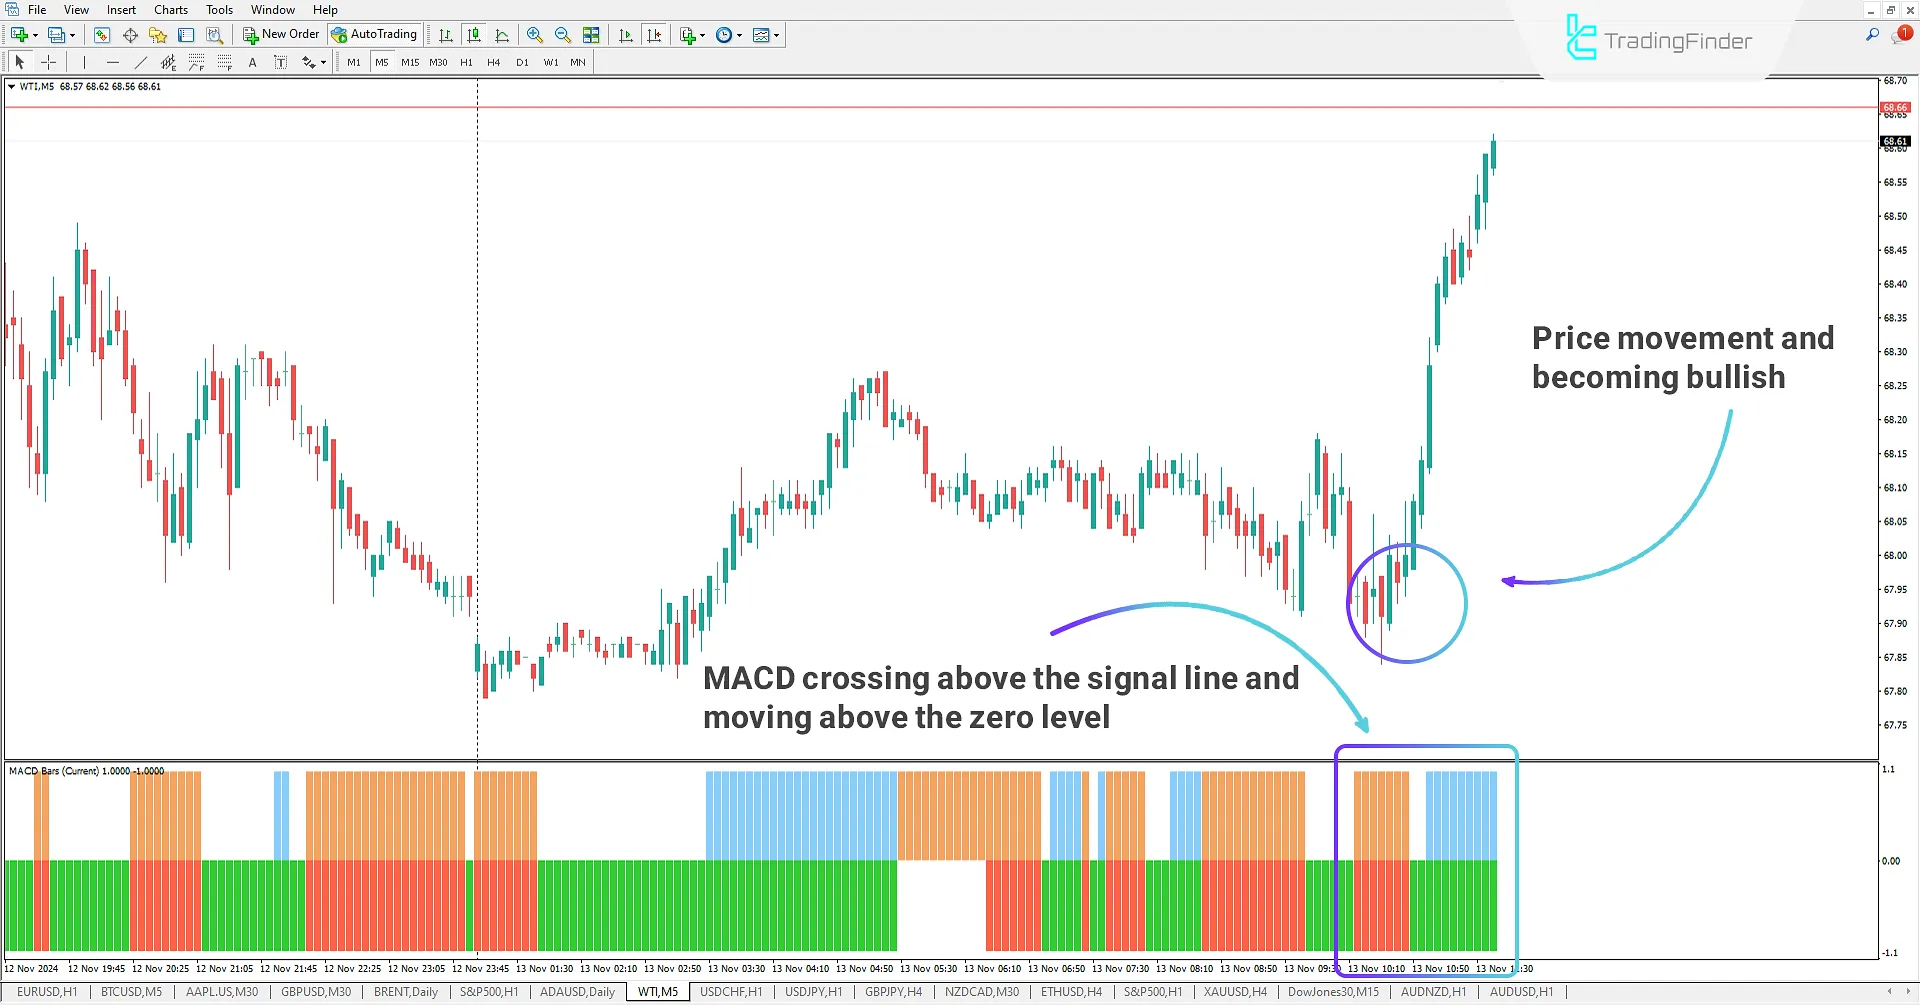
Uptrend
In the 5-minute WTI chart, the Multi Time Frame MACD Bars indicator shows green and blue histograms.
The green histogram signals buyer strength (MACD above its signal line), while the blue histogram confirms the uptrend (MACD crossing above zero).
These signals indicate the beginning of an uptrend, providing a favorable entry point for traders.
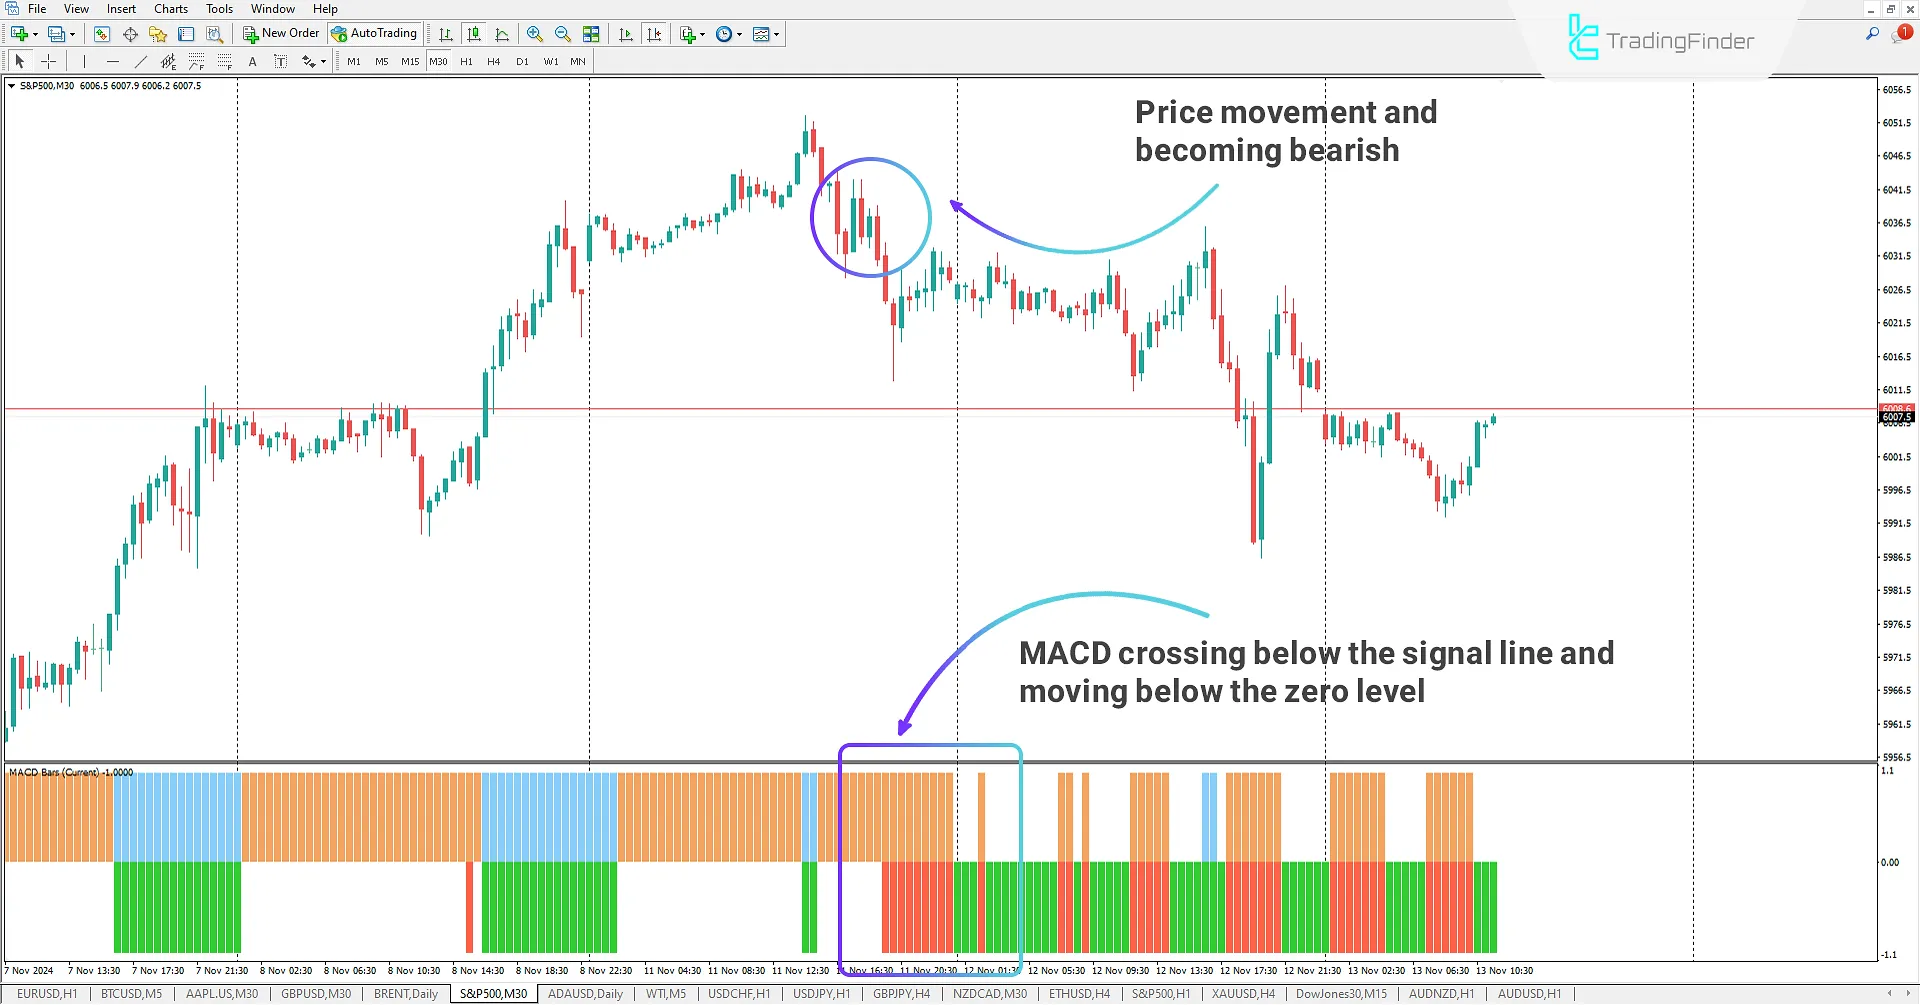
Downtrend
On the 30-minute S&P 500 chart, the Multi Time Frame MACD Bars indicator shows red and orange histograms.
The red histogram indicates strong selling pressure (MACD below its signal line), while the orange histogram confirms the downtrend (MACD crossing below zero).
Together, these signals mark the start of a downtrend, offering traders a promising sell entry.
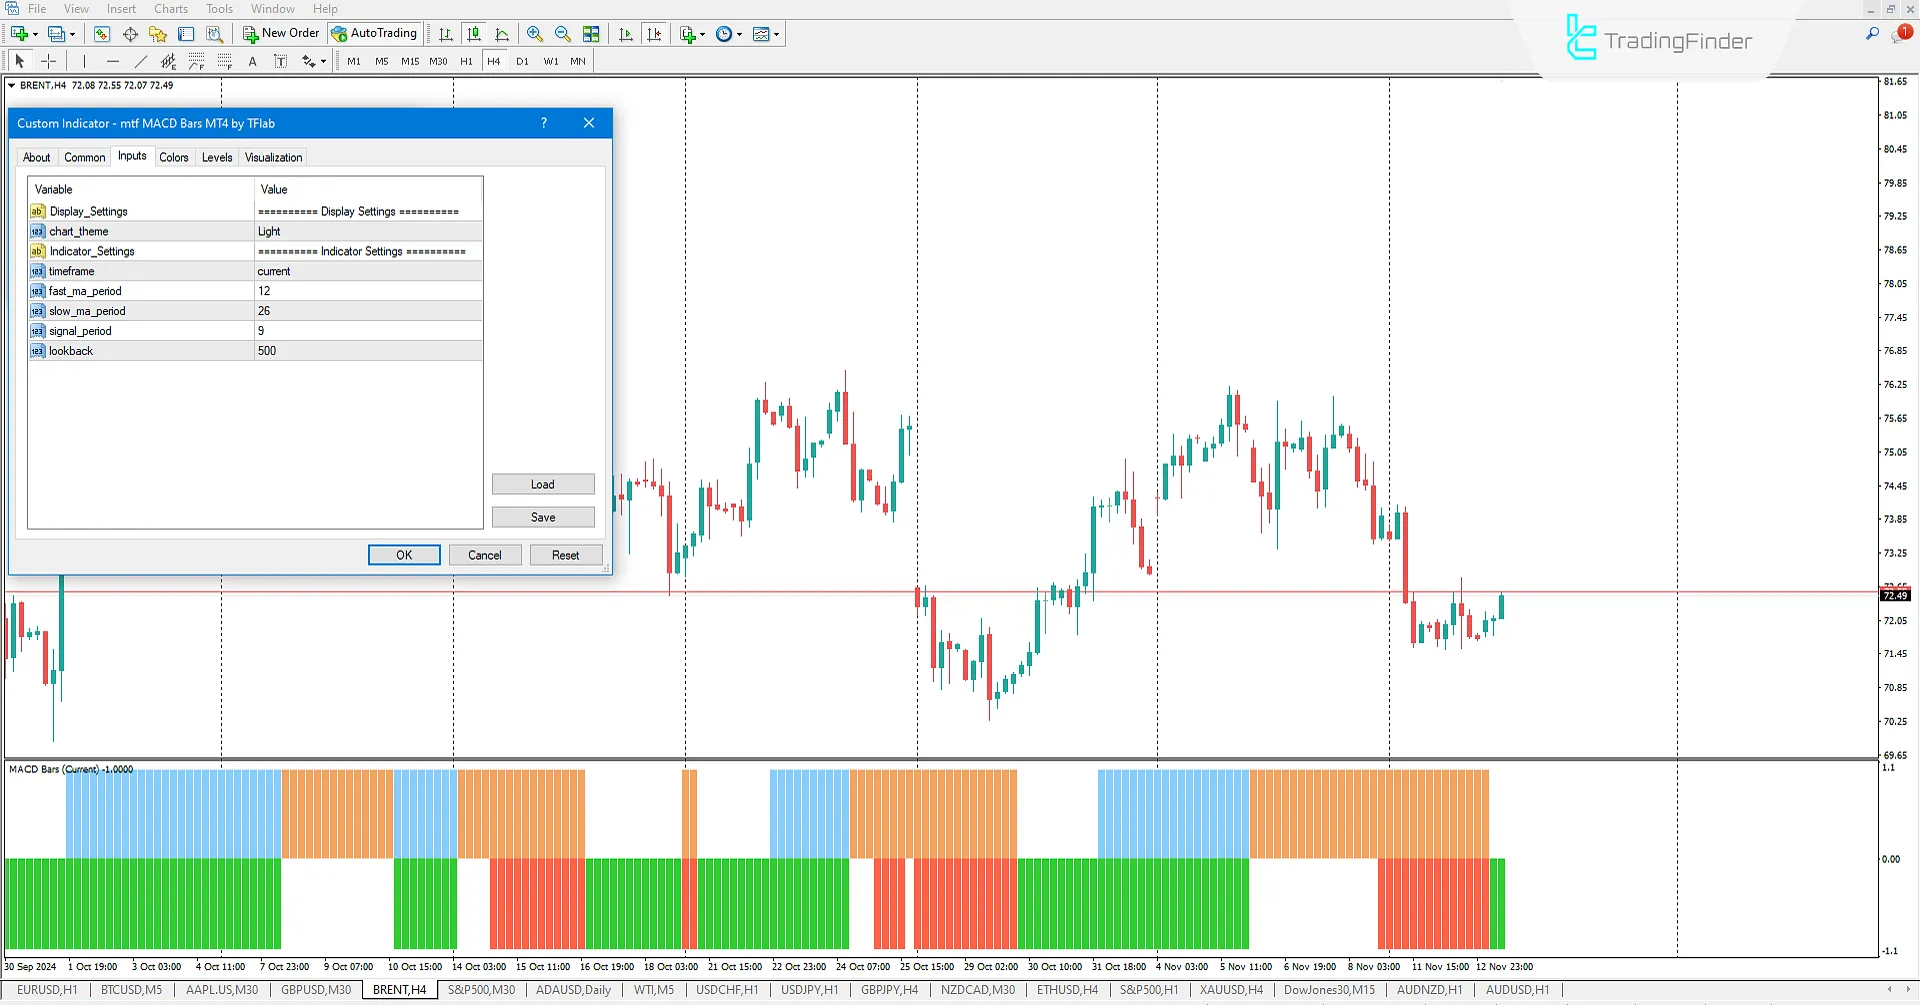
Indicator Settings
Below are the settings related to the indicator:
Display Settings
- Chart theme: Select a custom theme for the indicator;
Indicator Settings
- Timeframe: Set the MACD timeframe;
- Fast ma period: Set the fast-moving average period for MACD;
- Slow ma period: Set the slow-moving average period for MACD;
- Signal period: Set the MACD signal line period;
- Lookback: Set the number of candles for calculation and display.
Conclusion
The Multi-Timeframe MACD Bar Oscillator is a practical and effective tool for traders who The Multi-Timeframe MACD Bar Oscillator is a practical tool for traders using MACD in their analysis, providing a Signal and Prediction trading tool in MetaTrader 4
to identify trading opportunities. With four colors displaying MACD conditions, it helps traders recognize key market points. Additionally, its adjustable timeframe feature allows seamless multi-timeframe analysis for precise trading decisions.
Multi Time Frame MACD MT4 PDF
Multi Time Frame MACD MT4 PDF
Click to download Multi Time Frame MACD MT4 PDFWhat is the Multi Time Frame MACD Bars indicator?
The Multi Time Frame MACD Bars indicator is an advanced tool for MetaTrader 4 (MT4), designed based on the MACD indicator. It displays MACD status as a four-color histogram, allowing traders to perform multi-timeframe analyses.
What signals does this indicator show?
The indicator’s histogram uses four different colors to represent MACD status:
- Green: When MACD bars are above the signal line, indicating bullish strength
- Blue: The uptrend is confirmed when MACD is above the zero level
- Red: When MACD is below the signal line, signaling a weakening uptrend or potential downturn
- Orange: When MACD is below the zero level, indicating a downtrend


