


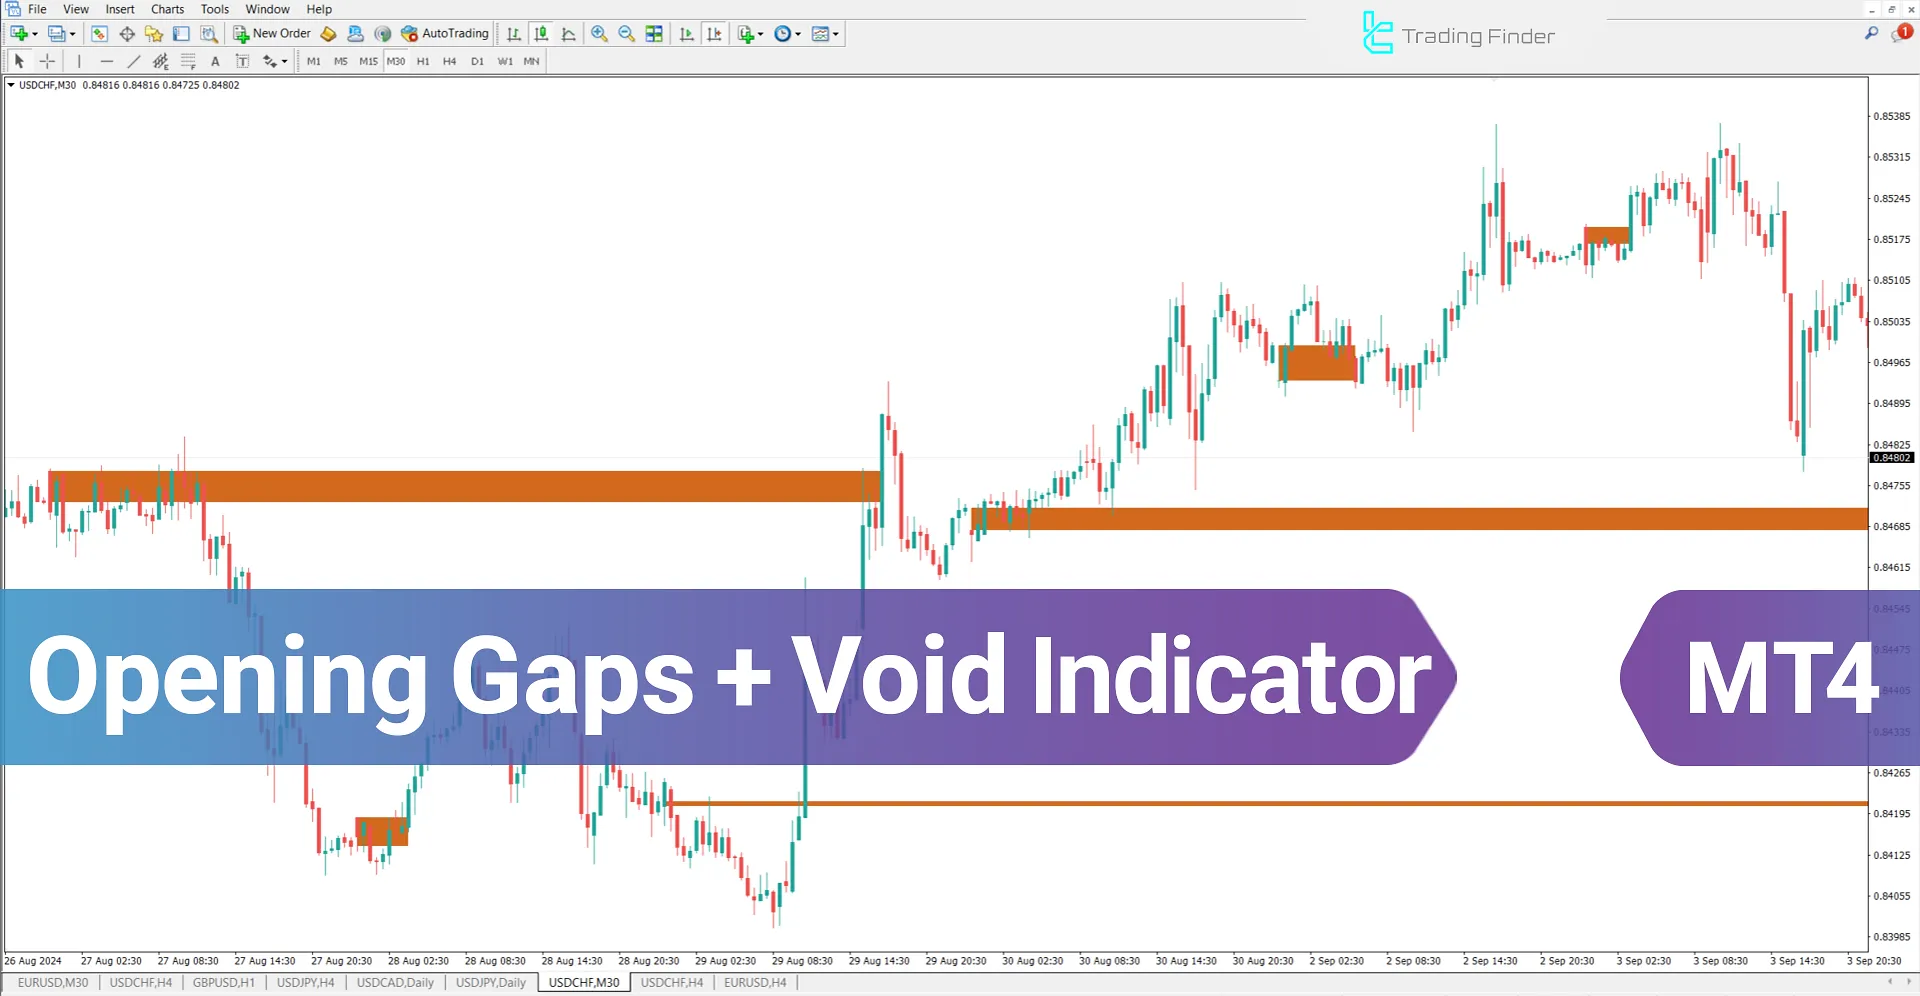

The Opening Gap + Void Indicator in MetaTrader 4 indicators is one of the essential tools for identifying price differences at market open between two trading sessions. A gap occurs when the opening price of a new candlestick is higher or lower than the closing price of the previous candlestick.
This indicator automatically detects price gaps and displays them on the chart. Additionally, if any of these gaps are filled by the price, the indicator removes those areas from the chart and clearly highlights the remaining empty space.
Indicator Specifications Table
The table below provides a summary of the specifications of the Gap + Void Indicator:
Indicator Categories: | ICT MT4 Indicators Smart Money MT4 Indicators Liquidity MT4 Indicators |
Platforms: | MetaTrader 4 Indicators |
Trading Skills: | Intermediate |
Indicator Types: | Reversal MT4 Indicators |
Timeframe: | Multi-Timeframe MT4 Indicators |
Trading Style: | Intraday MT4 Indicators |
Trading Instruments: | Share Stocks MT4 Indicators Forward Market MT4 Indicators Commodity Market MT4 Indicators Stock Market MT4 Indicators Cryptocurrency MT4 Indicators Forex MT4 Indicators |
Overview of the Indicator
When a gap occurs between two candles, it indicates sudden market changes. This indicator displays gaps resulting from important news, significant price volatility, or shifts in market sentiment. Gaps can provide traders with insights into market conditions.
Initially, the gap appears in green. Once the price reaches and breaks this area, it turns red.
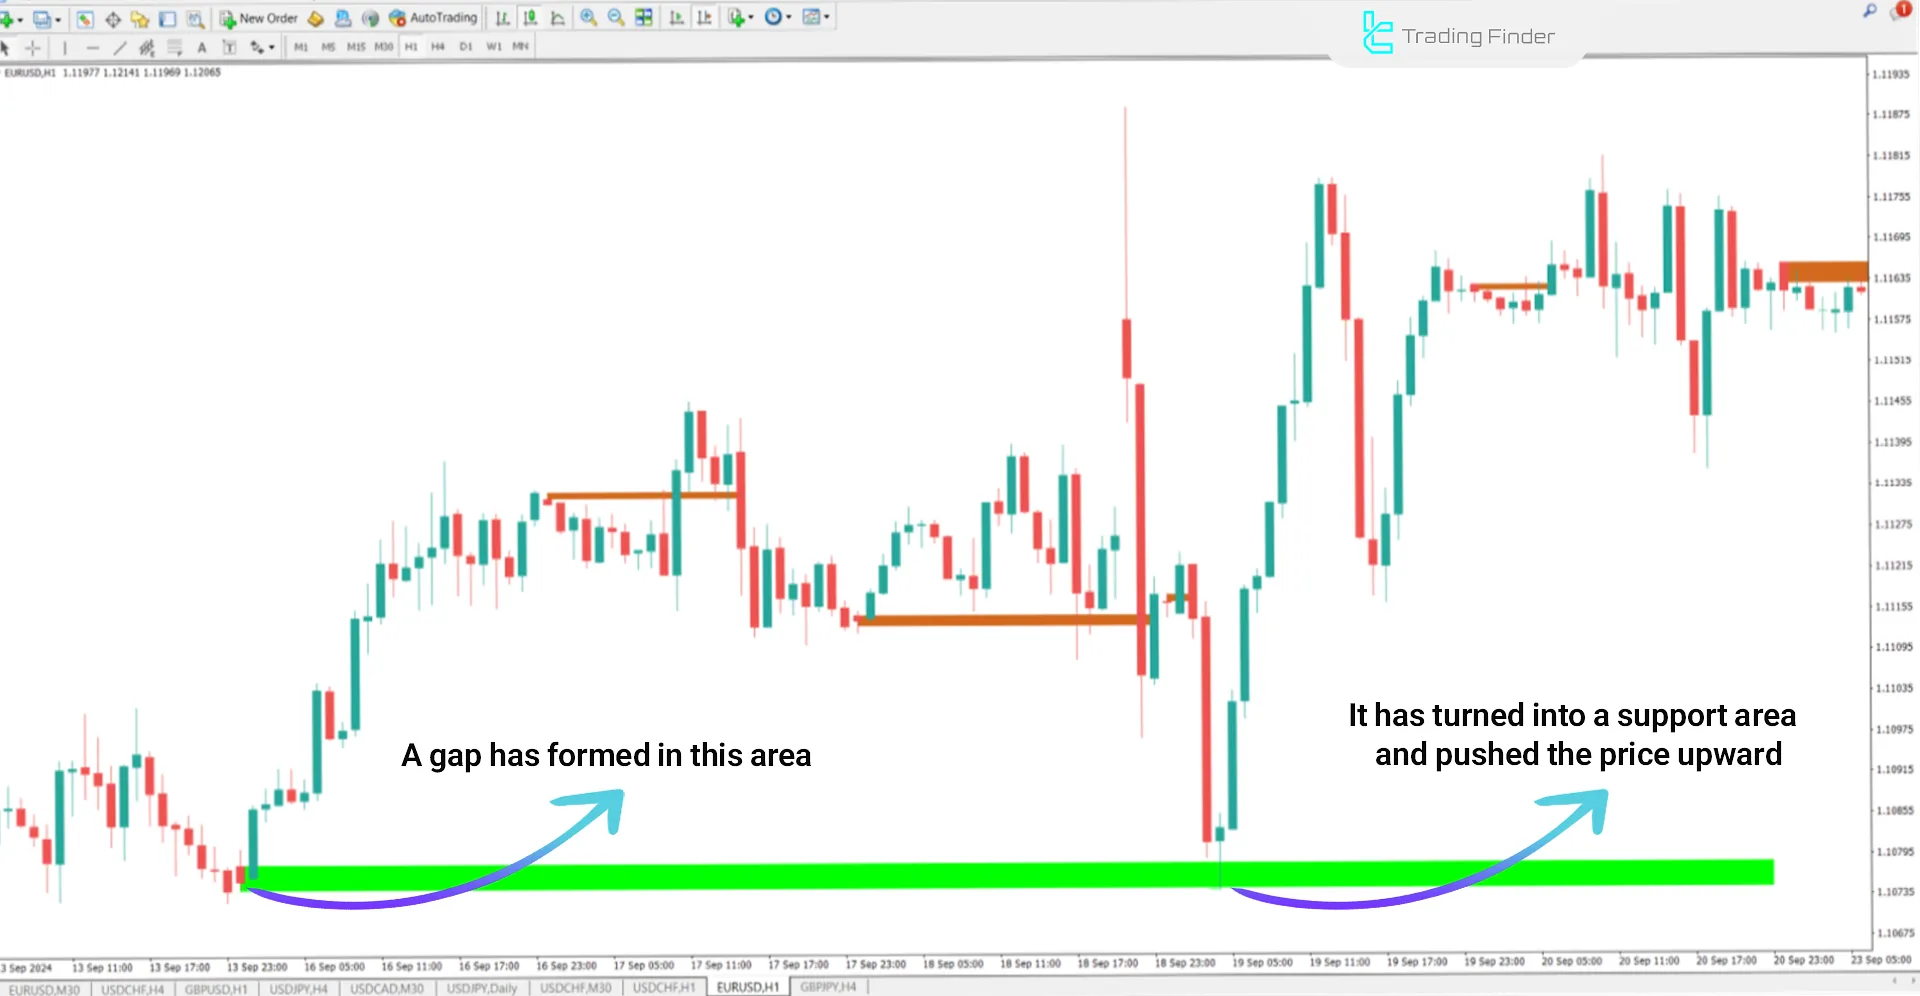
Opening Gap + Void Indicator in an Uptrend
In the 1-hour chart of the EUR/USD currency pair, after the formation of a gap, the price has increased. These gaps act as support levels and, with a shift in market direction, prevent further price decline.

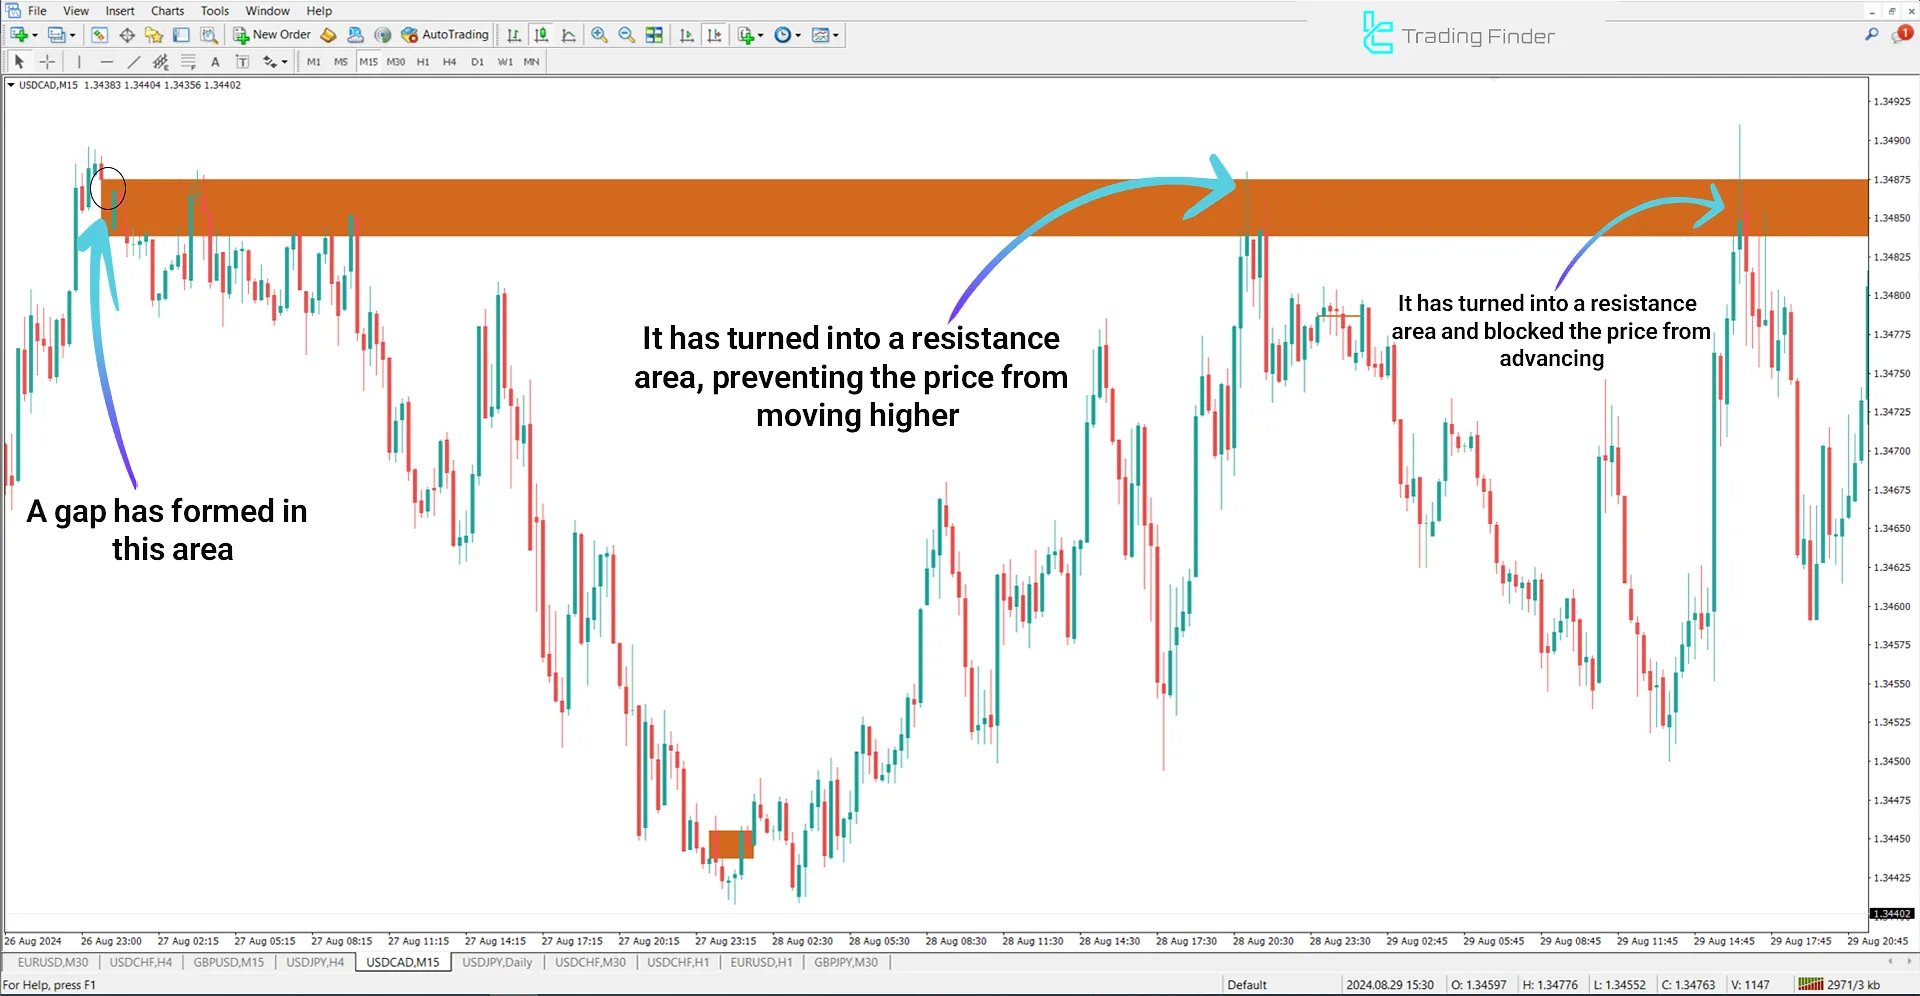
Opening Gap + Void Indicator in a Downtrend
Gaps identified by the Opening Gap indicator act as resistance levels (Resistance) and typically trigger a price reaction and decline. In these areas, the price tends to correct or drop after reaching the specified level.
The price chart below represents the USD/CAD currency pair on a 15-minute timeframe, showing that after reaching the resistance gap level, the price reacted and entered a downtrend.
Indicator Settings
The Gap Indicator settings section is displayed in the image below:
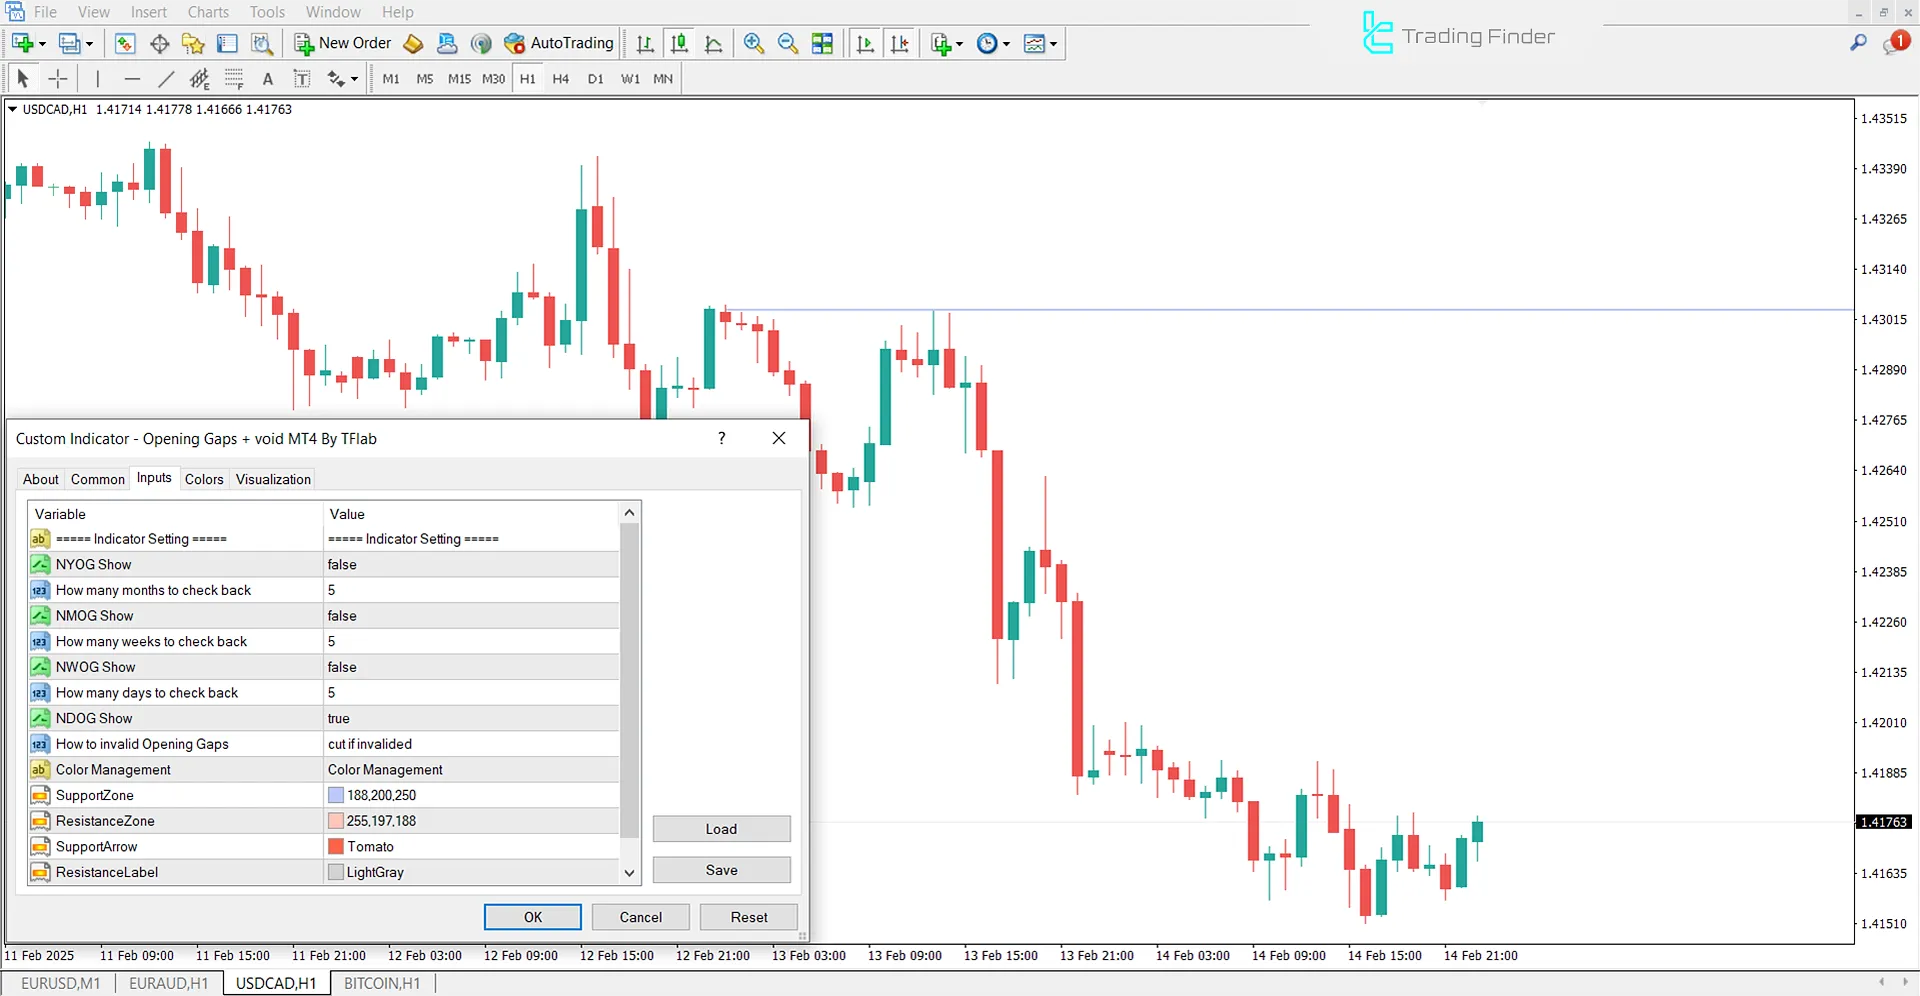
- NYOG_Show: Annual gap indicator
- NYOG_LookBack: Default period for showing annual gap
- NMOG_Show: Monthly gap indicator
- NMOG_LookBack: Default period for showing monthly gap
- NWOG_Show: Weekly gap indicator
- NWOG_LookBack: Default period for showing weekly gap
- NDOG_Show: Daily gap indicator
- NDOG_LookBack: Default period for showing daily gap
- NDOH_Show: Gap indicator
- Invalidation: Indicates broken past levels
Conclusion
The Opening Gap + Void Indicator is a valuable tool for detecting sudden price changes in financial markets. The gaps identified by this indicator serve as support and resistance levels.
Traders using the ICT style, Smart Money concepts, and other trading strategies can leverage this indicator to refine their market analysis and trade execution.
Opening Gap Void ICT MT4 PDF
Opening Gap Void ICT MT4 PDF
Click to download Opening Gap Void ICT MT4 PDFWhat is the purpose of the Opening Gap + Void Indicator in trading?
The Opening Gap Indicator identifies gap prices and helps traders determine entry and exit points.
How does the Opening Gap + Void Indicator function in an uptrend?
In an uptrend, the Opening Gap Indicator identifies gap prices as support levels, allowing traders to spot potential price reversal points and opportunities for Buy trades.


