![Pivot Points All-in-One Indicator for MetaTrader 4 Download - Free - [TradingFinder]](https://cdn.tradingfinder.com/image/143751/11-52-en-pivot-points-all-in-one-mt4-01.webp)
![Pivot Points All-in-One Indicator for MetaTrader 4 Download - Free - [TradingFinder] 0](https://cdn.tradingfinder.com/image/143751/11-52-en-pivot-points-all-in-one-mt4-01.webp)
![Pivot Points All-in-One Indicator for MetaTrader 4 Download - Free - [TradingFinder] 1](https://cdn.tradingfinder.com/image/143744/11-52-en-pivot-points-all-in-one-mt4-02.webp)
![Pivot Points All-in-One Indicator for MetaTrader 4 Download - Free - [TradingFinder] 2](https://cdn.tradingfinder.com/image/143747/11-52-en-pivot-points-all-in-one-mt4-03.webp)
![Pivot Points All-in-One Indicator for MetaTrader 4 Download - Free - [TradingFinder] 3](https://cdn.tradingfinder.com/image/143745/11-52-en-pivot-points-all-in-one-mt4-04.webp)
The Pivot Points All-in-One Indicator is a practical tool for identifying pivot points and MT4 Support and resistance indicator, designed for the MetaTrader 4 (MT4) platform. This indicator calculates pivot points based on the previous day’s high, low, and close prices and plots the pivot point line (displayed in blue).
- Resistance levels are displayed as red lines.
- Support levels are displayed as green lines.
These levels serve as high-priority areas on the chart where prices often react. Traders can use this indicator to identify entry and exit points and analyze price behavior near these levels.
Pivot Points Indicator Table
Indicator Categories: | Pivot Points & Fractals MT4 Indicators Support & Resistance MT4 Indicators Levels MT4 Indicators |
Platforms: | MetaTrader 4 Indicators |
Trading Skills: | Intermediate |
Indicator Types: | Leading MT4 Indicators Entry and Exit MT4 Indicators Reversal MT4 Indicators |
Timeframe: | M1-M5 Time MT4 Indicators M15-M30 Time MT4 Indicators |
Trading Style: | Day Trading MT4 Indicators Intraday MT4 Indicators Scalper MT4 Indicators |
Trading Instruments: | Indices Market MT4 Indicators Cryptocurrency MT4 Indicators Forex MT4 Indicators |
Bullish Trading Levels

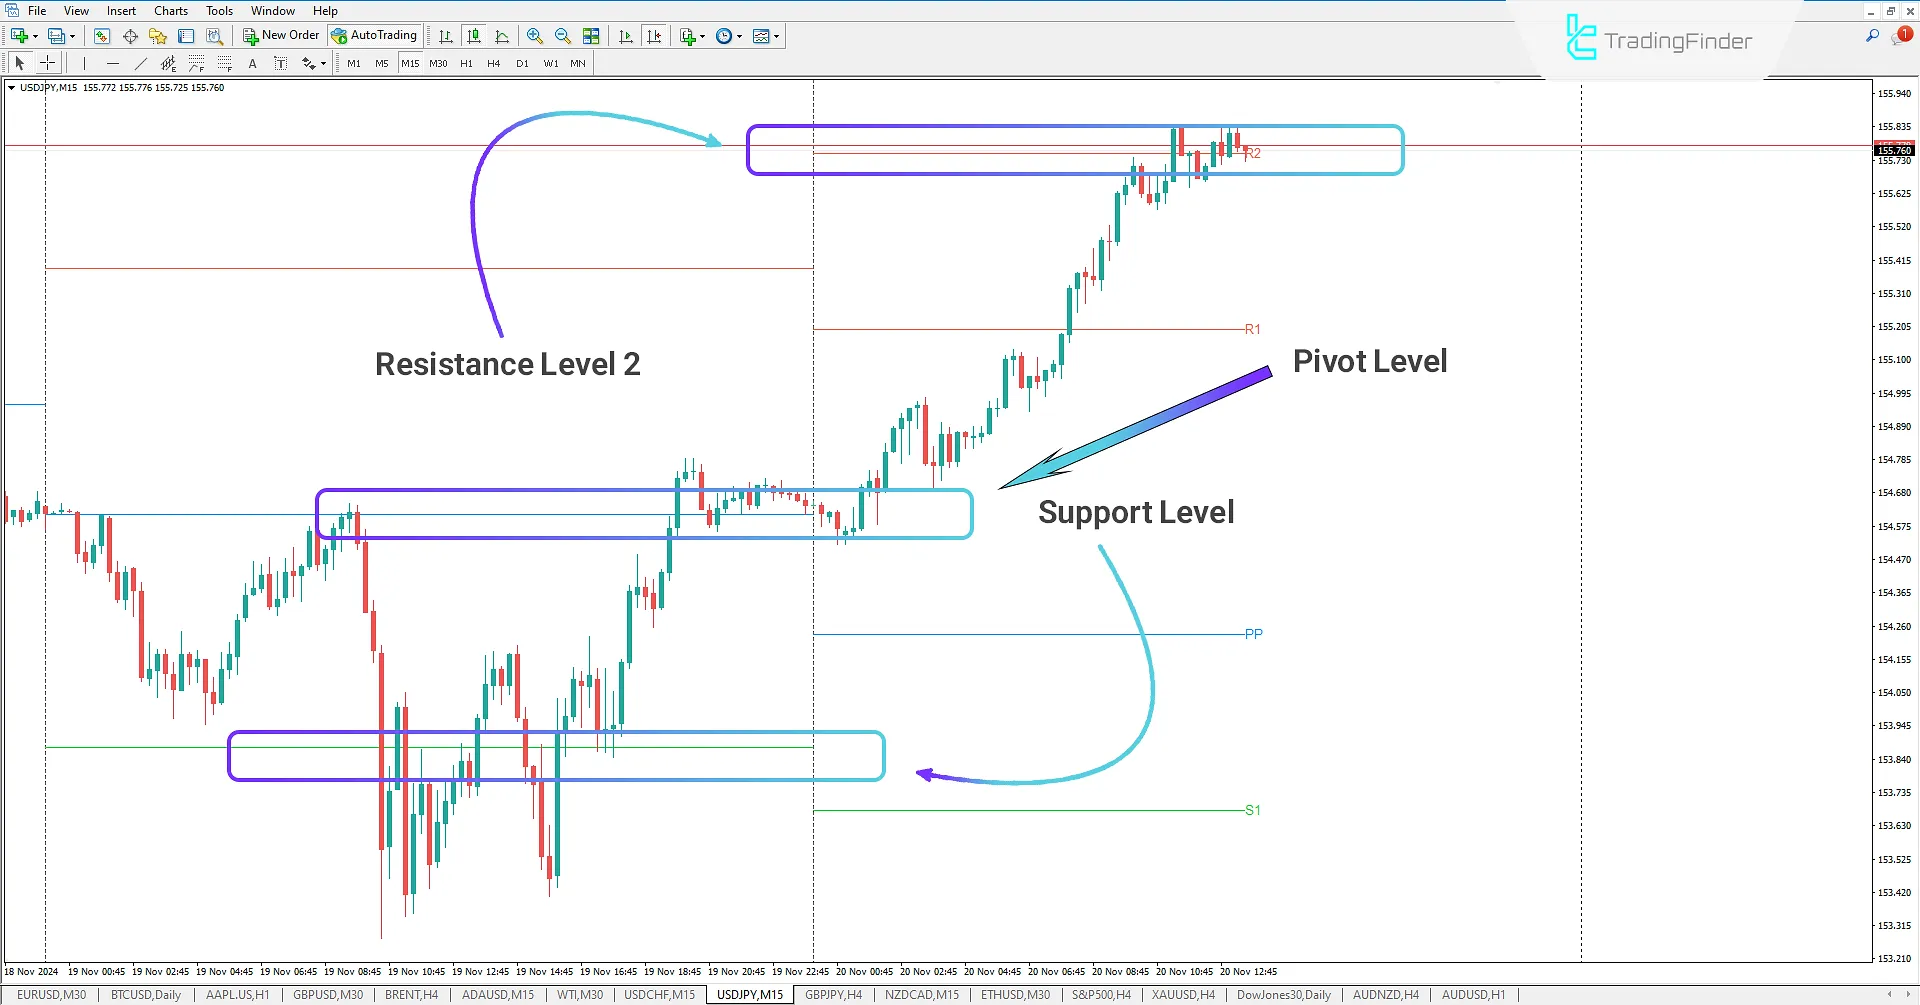
In the 15-minute USD/JPY chart, the price breaks above the pivot level pulls back to it, and then resumes its upward trend.
The Pivot Points All-in-One Indicator:
- Accurately plots support (green) and resistance (red) levels.
- Displays reaction zones.
In this case:
- The price crossing above the pivot indicates a shift to an uptrend.
- A pullback to the pivot confirms its strength and provides an opportunity for entering buy trades.
Traders can:
- Use subsequent resistance levels as price targets (take profit).
- Anticipate potential price reactions around these levels.
Due to its simplicity and effectiveness, this indicator is a valuable tool for making decisions in short-term trades and leveraging key price levels.
Bearish Trading Levels

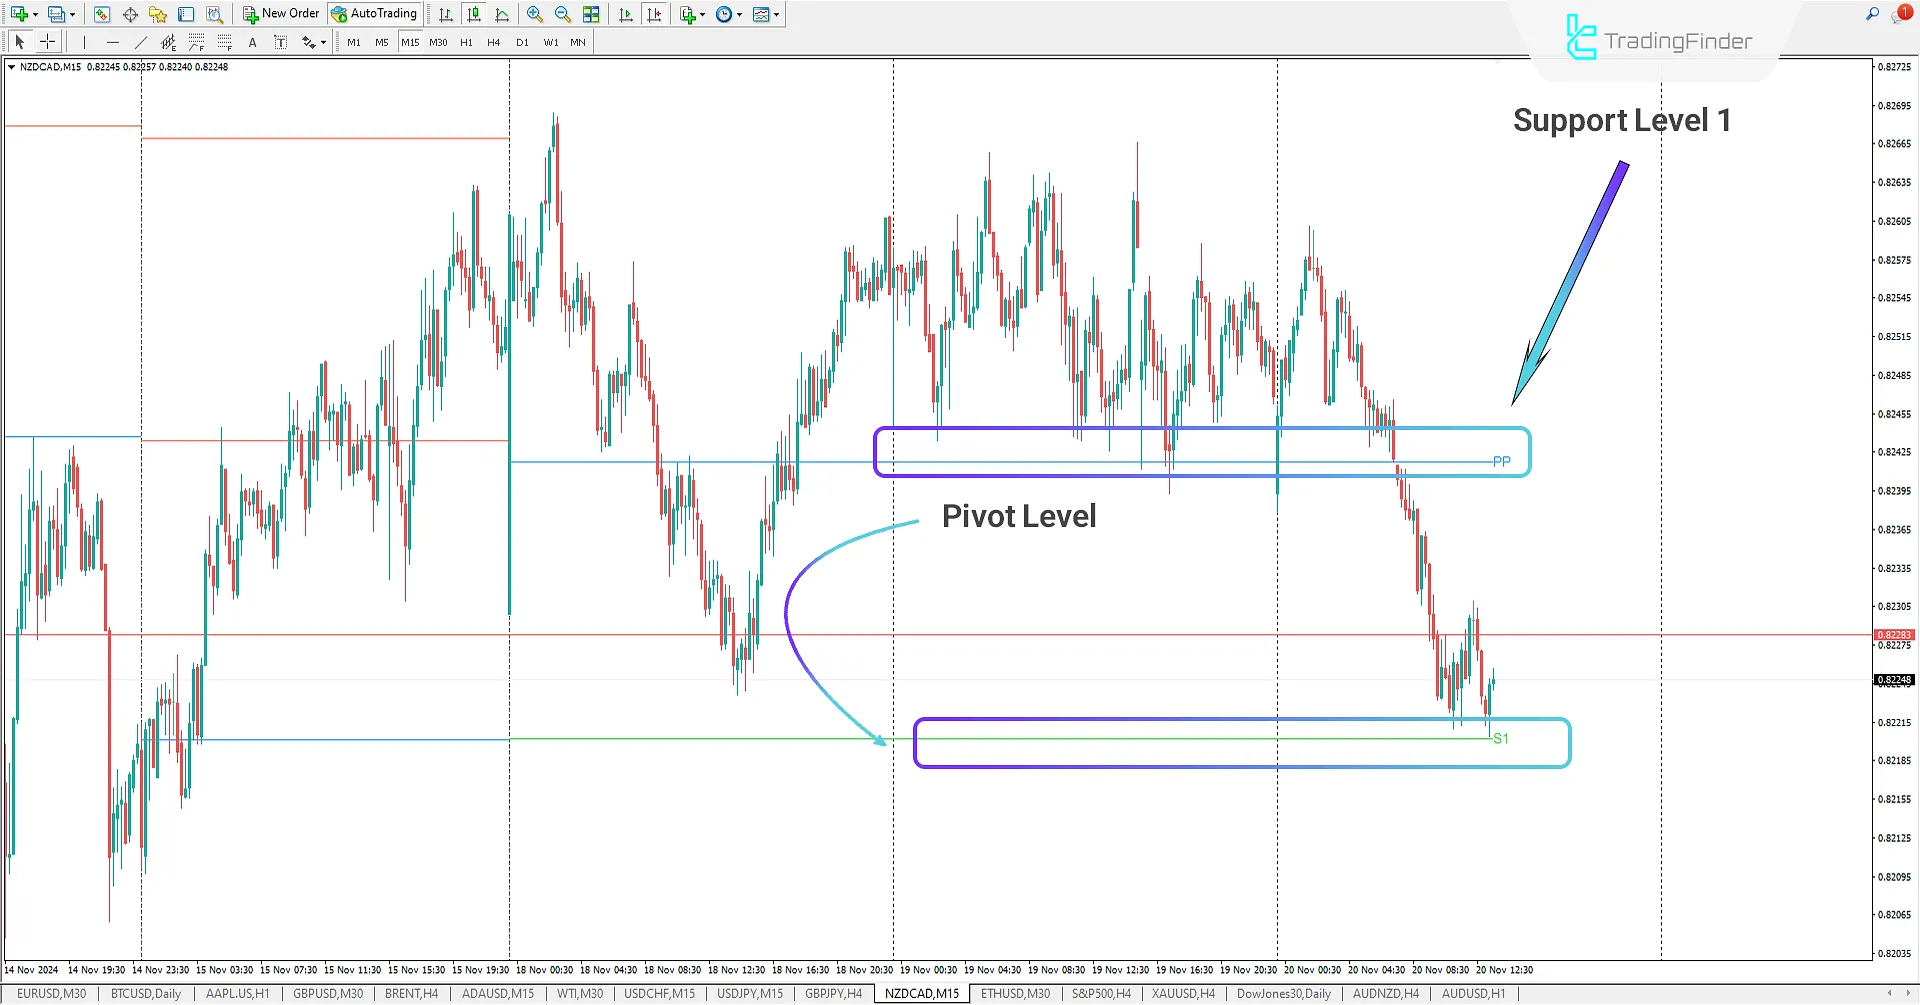
In the 15-minute NZD/CAD chart, the price initially touches the pivot level and, failing to break through, begins a downward trend. After breaking below the pivot level, the downtrend sharply continues.
The Pivot Points All-in-One Indicator:
- Highlights the pivot level as a critical zone, with its breach confirming a trend reversal.
- Displays support and resistance levels where the price is likely to react.
In this scenario:
- The initial rejection at the pivot level signals early signs of price weakness.
- After breaking below the pivot, the downtrend intensifies.
- The price eventually reacts positively to one of the support levels displayed by the indicator.
This indicator:
- It helps traders identify high-risk and high-potential zones by highlighting key levels.
- It is a simple yet effective tool for making trading decisions, setting price targets, and placing stop-loss orders.
Indicator Settings

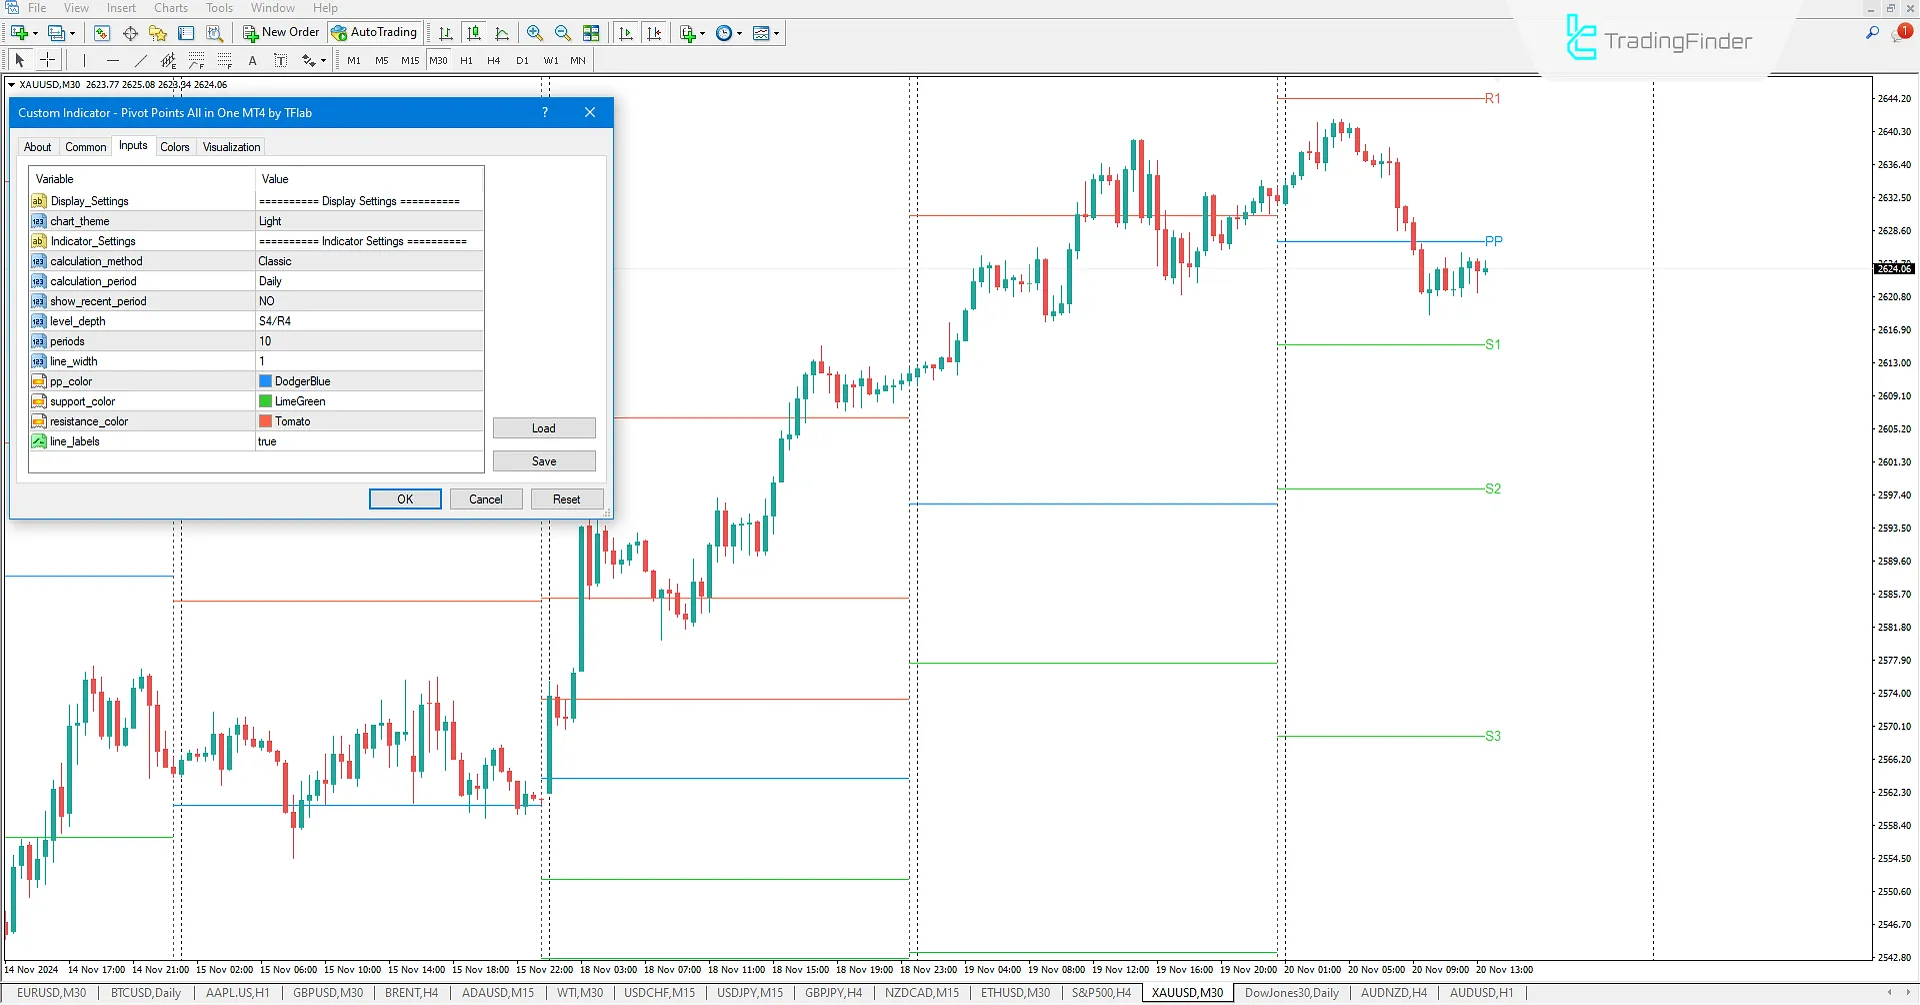
Display_Settings: Customizes graphical and visual chart settings;
- Chart_Theme: Select a chart theme (e.g., light or dark);
Indicator_Settings: General indicator operation settings;
- Calculation_Method: Select pivot point calculation methods (e.g., Classic, Fibonacci, or Camarilla);
- Calculation_Period: Choose the calculation period (daily, weekly, or monthly);
- Show_Recent_Period: Display levels for recent periods;
- Level_Depth: Determine the number of support and resistance levels displayed;
- Periods: Set time frame settings (e.g., number of displayed periods);
- Line_Width: Adjust line thickness (support, resistance, and pivot);
- Pp_Color: Set the pivot line color;
- Support_Color: Set support line colors;
- Resistance_Color: Set resistance line colors;
- Line_Labels: Toggle label display on lines.
Conclusion
The Pivot Points All-in-One Indicator is a practical and effective tool for traders seeking to identify key market levels. This Metatrader4 indicator allows traders to pinpoint support and resistance levels and use them to set take-profit and stop-loss levels. By calculating pivot points and visually displaying these levels on the chart, traders can perform more accurate analyses and identify better trading opportunities.
Pivot Points All-in-One MT4 PDF
Pivot Points All-in-One MT4 PDF
Click to download Pivot Points All-in-One MT4 PDFWhat is the Pivot Points All-in-One Indicator?
The Pivot Points Indicator is a practical tool for identifying pivot points and support/resistance levels based on the previous day’s data (high, low, and close) and plotting the corresponding lines on the chart.
How are support and resistance levels displayed?
- Resistance levels: Displayed as red lines.
- Support levels: Displayed as green lines.
- The main pivot line is displayed in blue.


