![Power Dynamite Areas Indicator MetaTrader 4 - Free Download [TradingFinder]](https://cdn.tradingfinder.com/image/583347/2-166-en-power-dynamite-areas-mt4-1.webp)
![Power Dynamite Areas Indicator MetaTrader 4 - Free Download [TradingFinder] 0](https://cdn.tradingfinder.com/image/583347/2-166-en-power-dynamite-areas-mt4-1.webp)
![Power Dynamite Areas Indicator MetaTrader 4 - Free Download [TradingFinder] 1](https://cdn.tradingfinder.com/image/583345/2-166-en-power-dynamite-areas-mt4-2.webp)
![Power Dynamite Areas Indicator MetaTrader 4 - Free Download [TradingFinder] 2](https://cdn.tradingfinder.com/image/583323/2-166-en-power-dynamite-areas-mt4-3.webp)
![Power Dynamite Areas Indicator MetaTrader 4 - Free Download [TradingFinder] 3](https://cdn.tradingfinder.com/image/583324/2-166-en-power-dynamite-areas-mt4-4.webp)
The Power Dynamite Areas Indicator uses advanced analytical algorithms to examine historical price data and identify previous price reaction zones.
These zones represent dynamic supports and resistances that are determined based on the number and strength of price touches at a specific level, and are displayed with colored lines.
Power Dynamite Areas Indicator Table
The general specifications of the Power Dynamite Areas Indicator are presented in the table below:
Indicator Categories: | Support & Resistance MT4 Indicators Trading Assist MT4 Indicators Levels MT4 Indicators |
Platforms: | MetaTrader 4 Indicators |
Trading Skills: | Intermediate |
Indicator Types: | Reversal MT4 Indicators |
Timeframe: | Multi-Timeframe MT4 Indicators |
Trading Style: | Day Trading MT4 Indicators |
Trading Instruments: | Share Stocks MT4 Indicators Indices Market MT4 Indicators Commodity Market MT4 Indicators Stock Market MT4 Indicators Cryptocurrency MT4 Indicators Forex MT4 Indicators |
Power Dynamite Areas Indicator at a Glance
The main function of the Power Dynamite Areas Indicator is based on the “Memory Effect” of the market; meaning that if the price strongly reacted to a level in the past, the probability of repeating that reaction in the future is high.
Traders often place their Stop Loss behind the Power Dynamite Areas, since breaking these levels usually signals a Market Structure Shift.
Indicator in an Uptrend
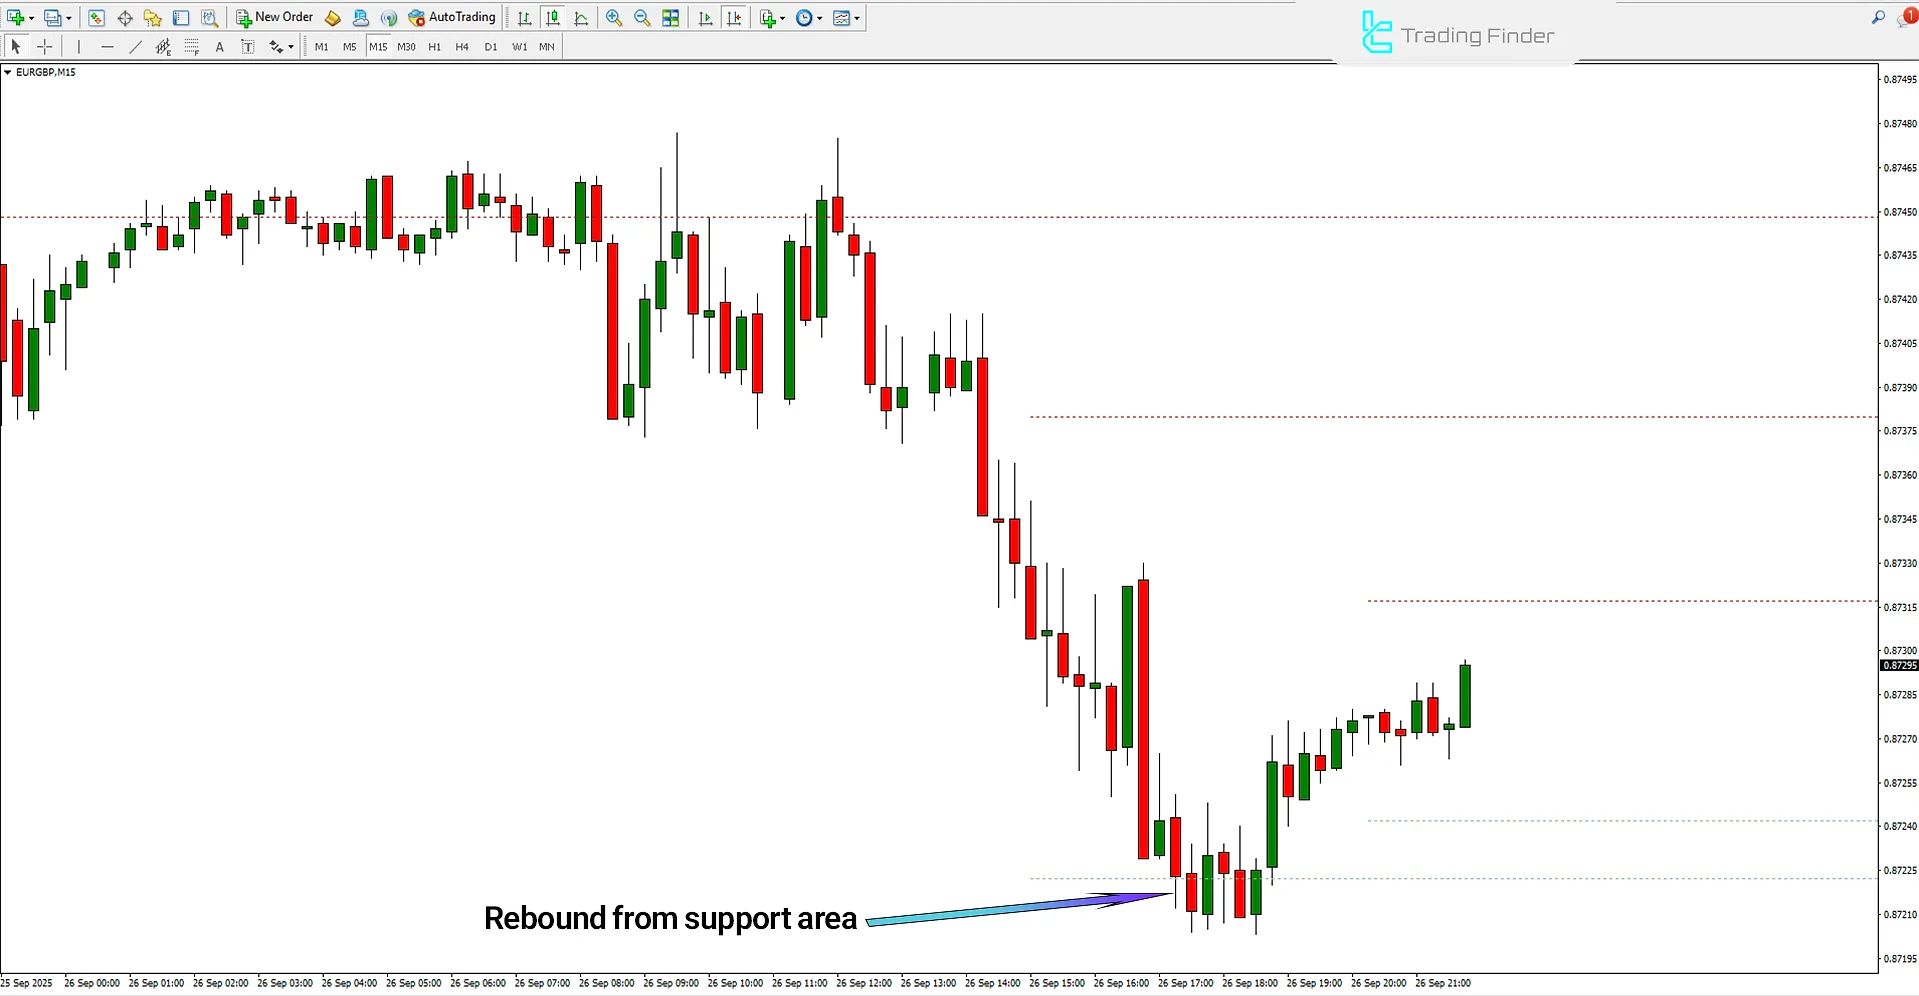
When the price approaches a support zone identified by the Power Dynamite Areas and confirming candlesticks (such as a bullish Pin Bar or bullish Engulfing) appear, the indicator highlights the ability of that level to prevent further decline.
In addition, a breakout above this level accompanied by higher trading volume strengthens the buy entry signal.

Indicator in a Downtrend
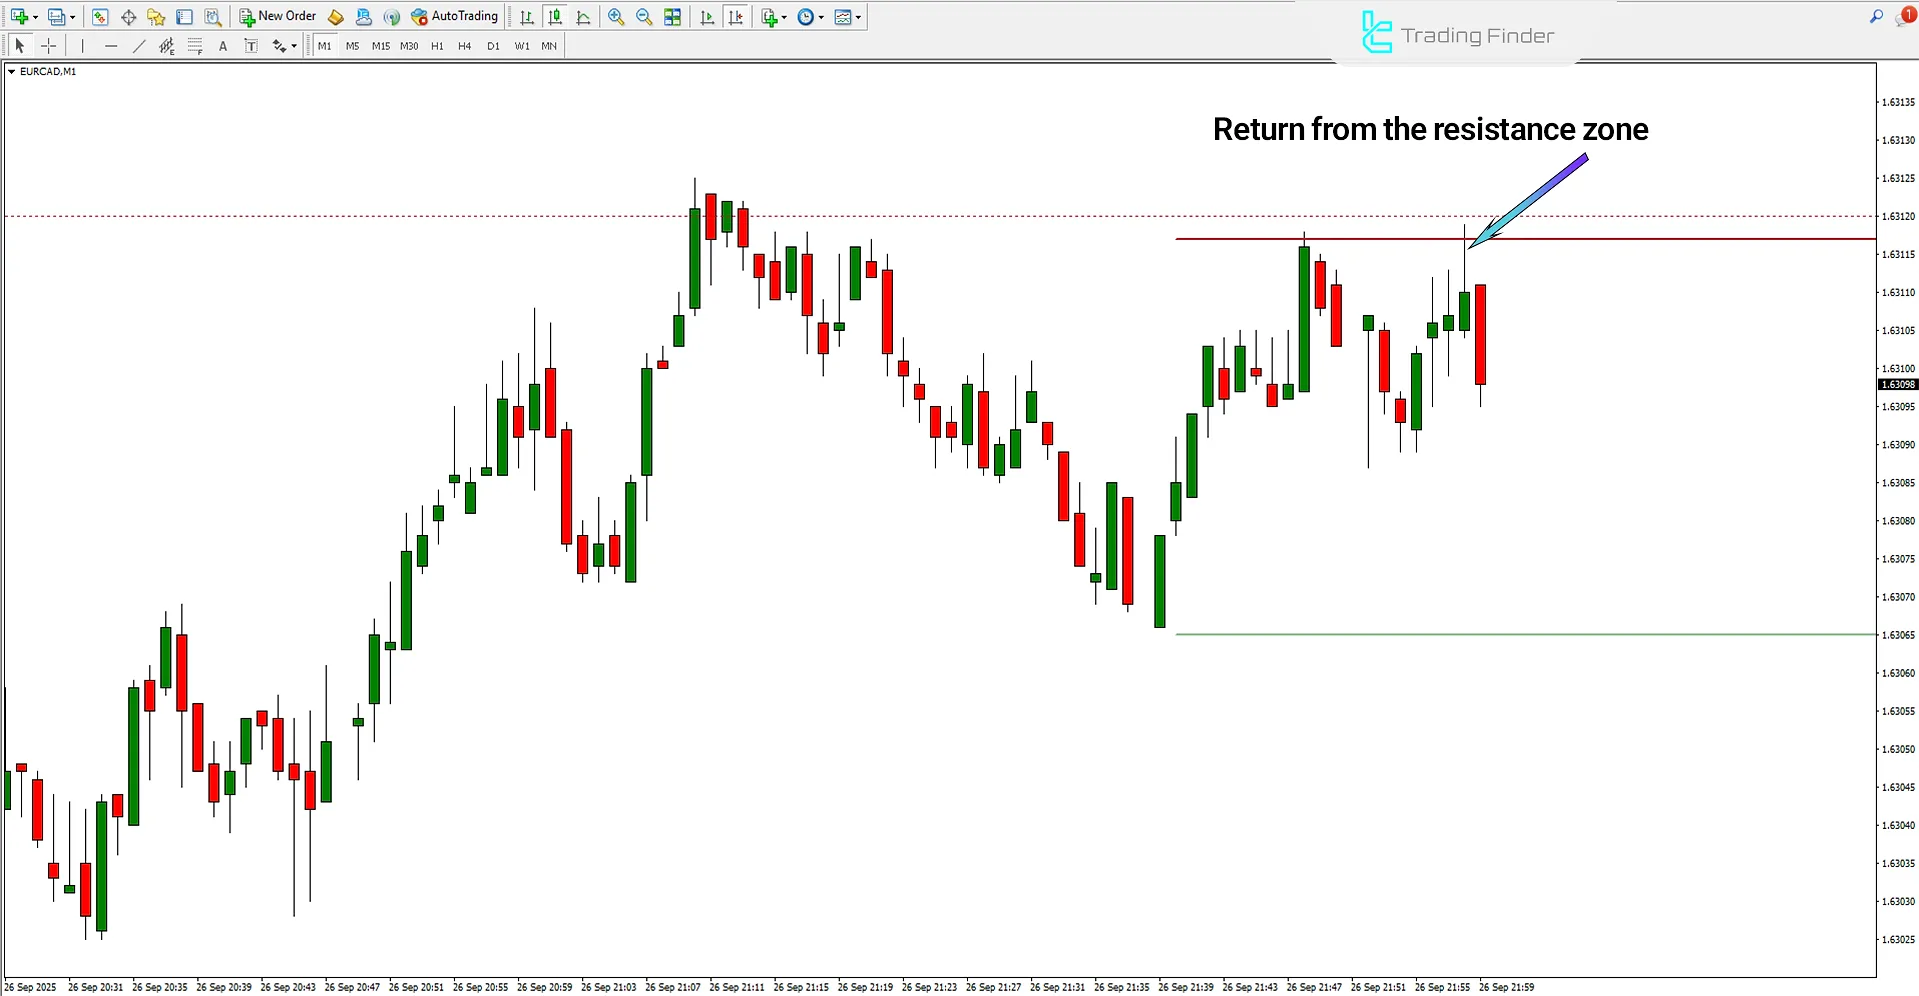
If the price reaches a resistance zone and bearish reversal candlesticks (such as Shooting Star or bearish Engulfing) form, the indicator warns of a possible trend reversal.
If the resistance level is confirmed with significant trading volume, a sell signal or Sell entry is generated.

Power Dynamite Areas Indicator Settings
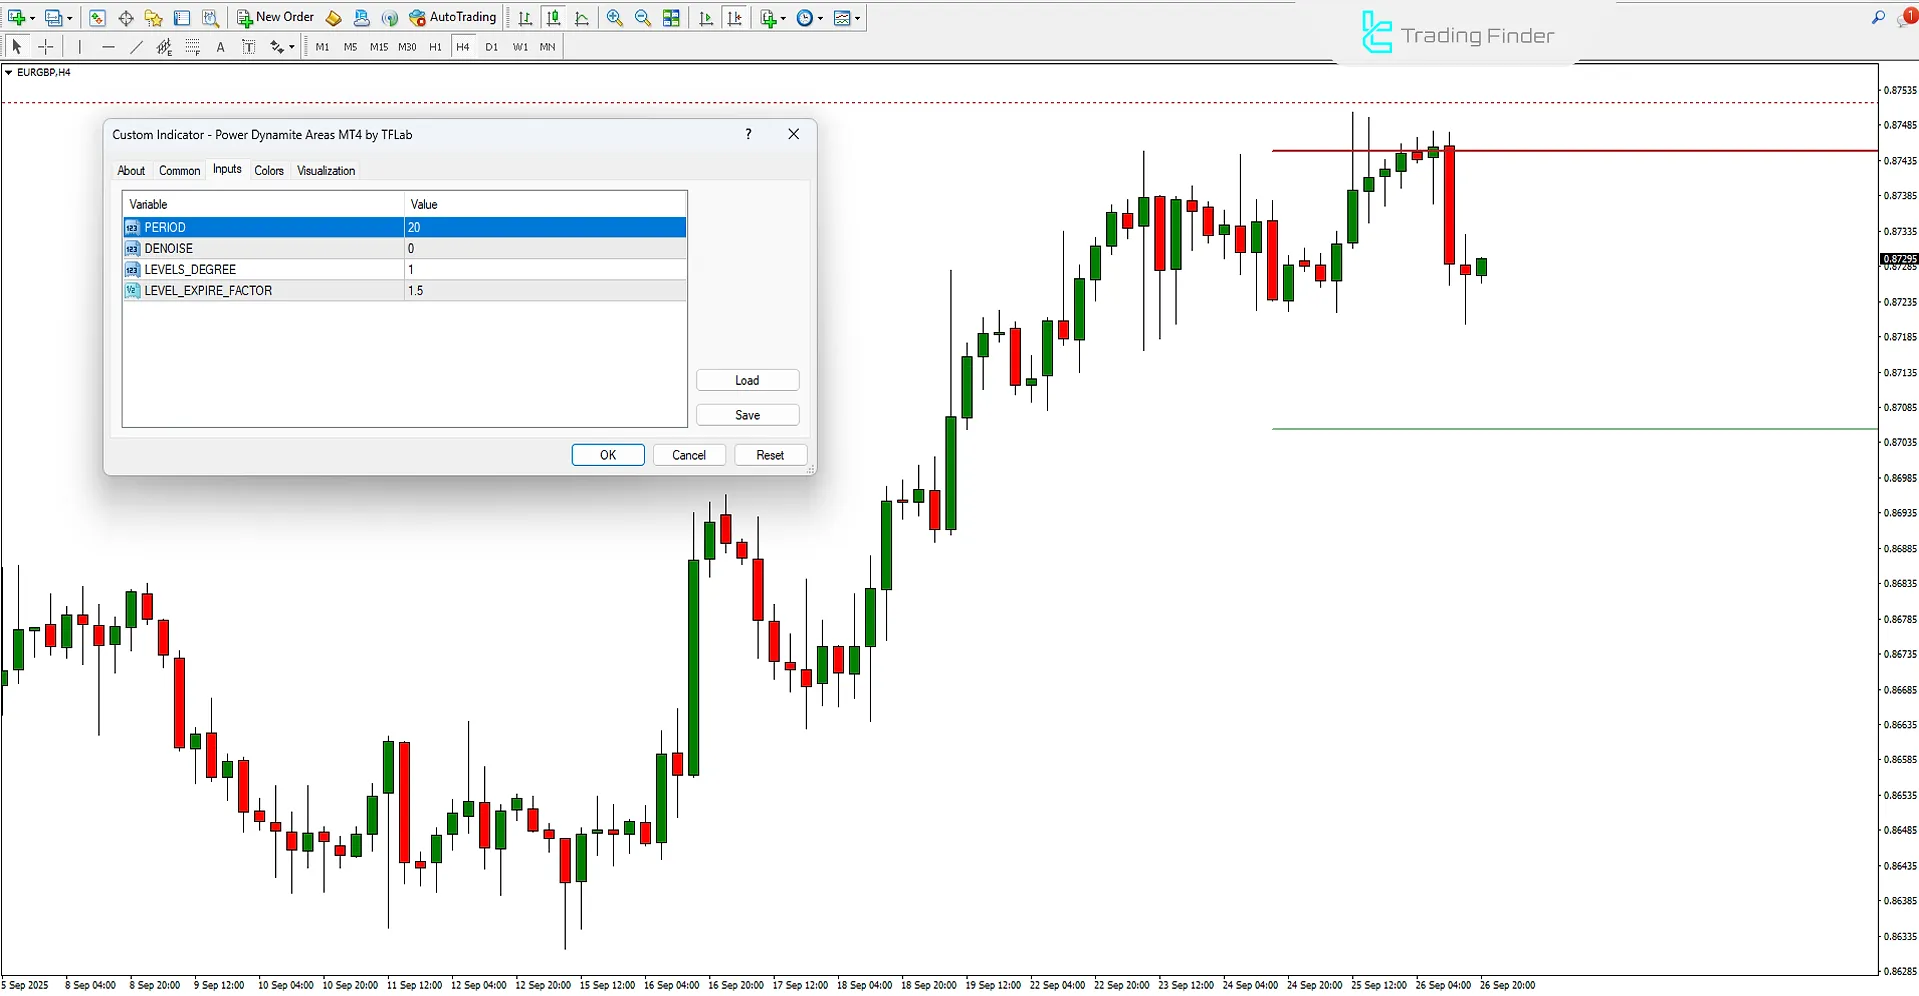
The image below shows the settings panel of the Power Dynamite Areas Indicator:

- PERIOD: Defines the calculation period
- DENOISE: Sets noise filtering
- LEVELS_DEGREE: Determines indicator sensitivity in identifying and displaying levels
- LEVEL_EXPIRE_FACTOR: Determines the expiration factor of the level
Conclusion
The Power Dynamite Areas Indicator, by modeling the market’s Memory Effect, identifies price reaction zones and acts as potential liquidity pools and structural change points.
These zones not only define dynamic supports and resistances but also provide suitable conditions for accurate stop-loss placement and structural breakout detection.
Power Dynamite Areas Indicator MetaTrader 4 PDF
Power Dynamite Areas Indicator MetaTrader 4 PDF
Click to download Power Dynamite Areas Indicator MetaTrader 4 PDFCan the Power Dynamite Areas Indicator be used in all markets?
Yes; this trading tool is effective in Forex, stocks, commodities, and cryptocurrency markets.
What type of signals does the Power Dynamite Areas Indicator generate?
This indicator does not directly issue buy or sell signals, but rather identifies key price reversal or breakout zones.


