![Pretty T3 Indicator for MT4 Download – Free – [TradingFinder]](https://cdn.tradingfinder.com/image/541914/13-207-en-pretty-t3-mt4-01.webp)
![Pretty T3 Indicator for MT4 Download – Free – [TradingFinder] 0](https://cdn.tradingfinder.com/image/541914/13-207-en-pretty-t3-mt4-01.webp)
![Pretty T3 Indicator for MT4 Download – Free – [TradingFinder] 1](https://cdn.tradingfinder.com/image/541911/13-207-en-pretty-t3-mt4-02.webp)
![Pretty T3 Indicator for MT4 Download – Free – [TradingFinder] 2](https://cdn.tradingfinder.com/image/541912/13-207-en-pretty-t3-mt4-03.webp)
![Pretty T3 Indicator for MT4 Download – Free – [TradingFinder] 3](https://cdn.tradingfinder.com/image/541913/13-207-en-pretty-t3-mt4-04.webp)
The Pretty T3 Indicator is one of the practical tools in MetaTrader 4 for identifying and tracking market trends.
This trading tool uses a Moving Average (MA) to visually display trend changes. In addition, this Moving Average is also considered a key level for price touches.
Pretty T3 Indicator Specifications Table
The table below includes the specifications and features of the "Pretty T3" indicator:
Indicator Categories: | Signal & Forecast MT4 Indicators Volatility MT4 Indicators Levels MT4 Indicators |
Platforms: | MetaTrader 4 Indicators |
Trading Skills: | Elementary |
Indicator Types: | Reversal MT4 Indicators |
Timeframe: | Multi-Timeframe MT4 Indicators |
Trading Style: | Day Trading MT4 Indicators Scalper MT4 Indicators Swing Trading MT4 Indicators |
Trading Instruments: | Share Stocks MT4 Indicators Indices Market MT4 Indicators Commodity Market MT4 Indicators Stock Market MT4 Indicators Cryptocurrency MT4 Indicators Forex MT4 Indicators |
Pretty T3 Indicator at a Glance
The calculation basis of this indicator is the "Typical Price"; a price derived from the average of the High, Low, and Close of each candle.
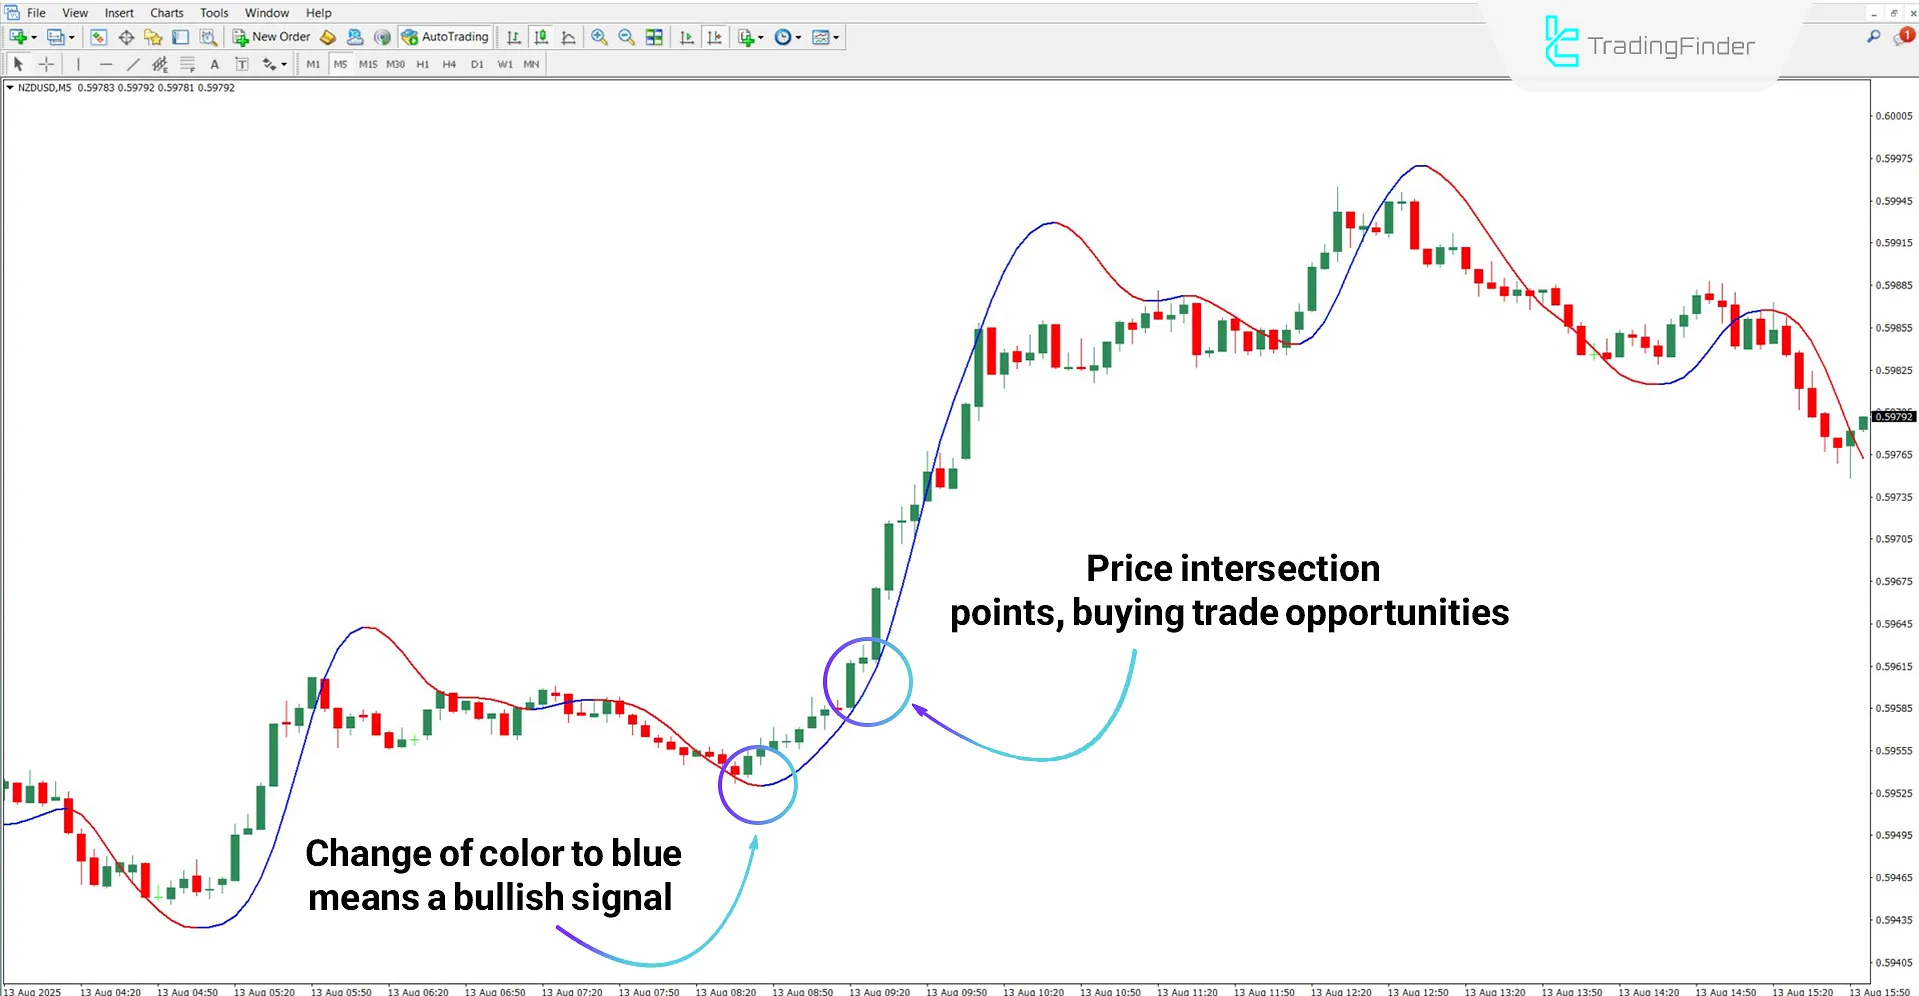
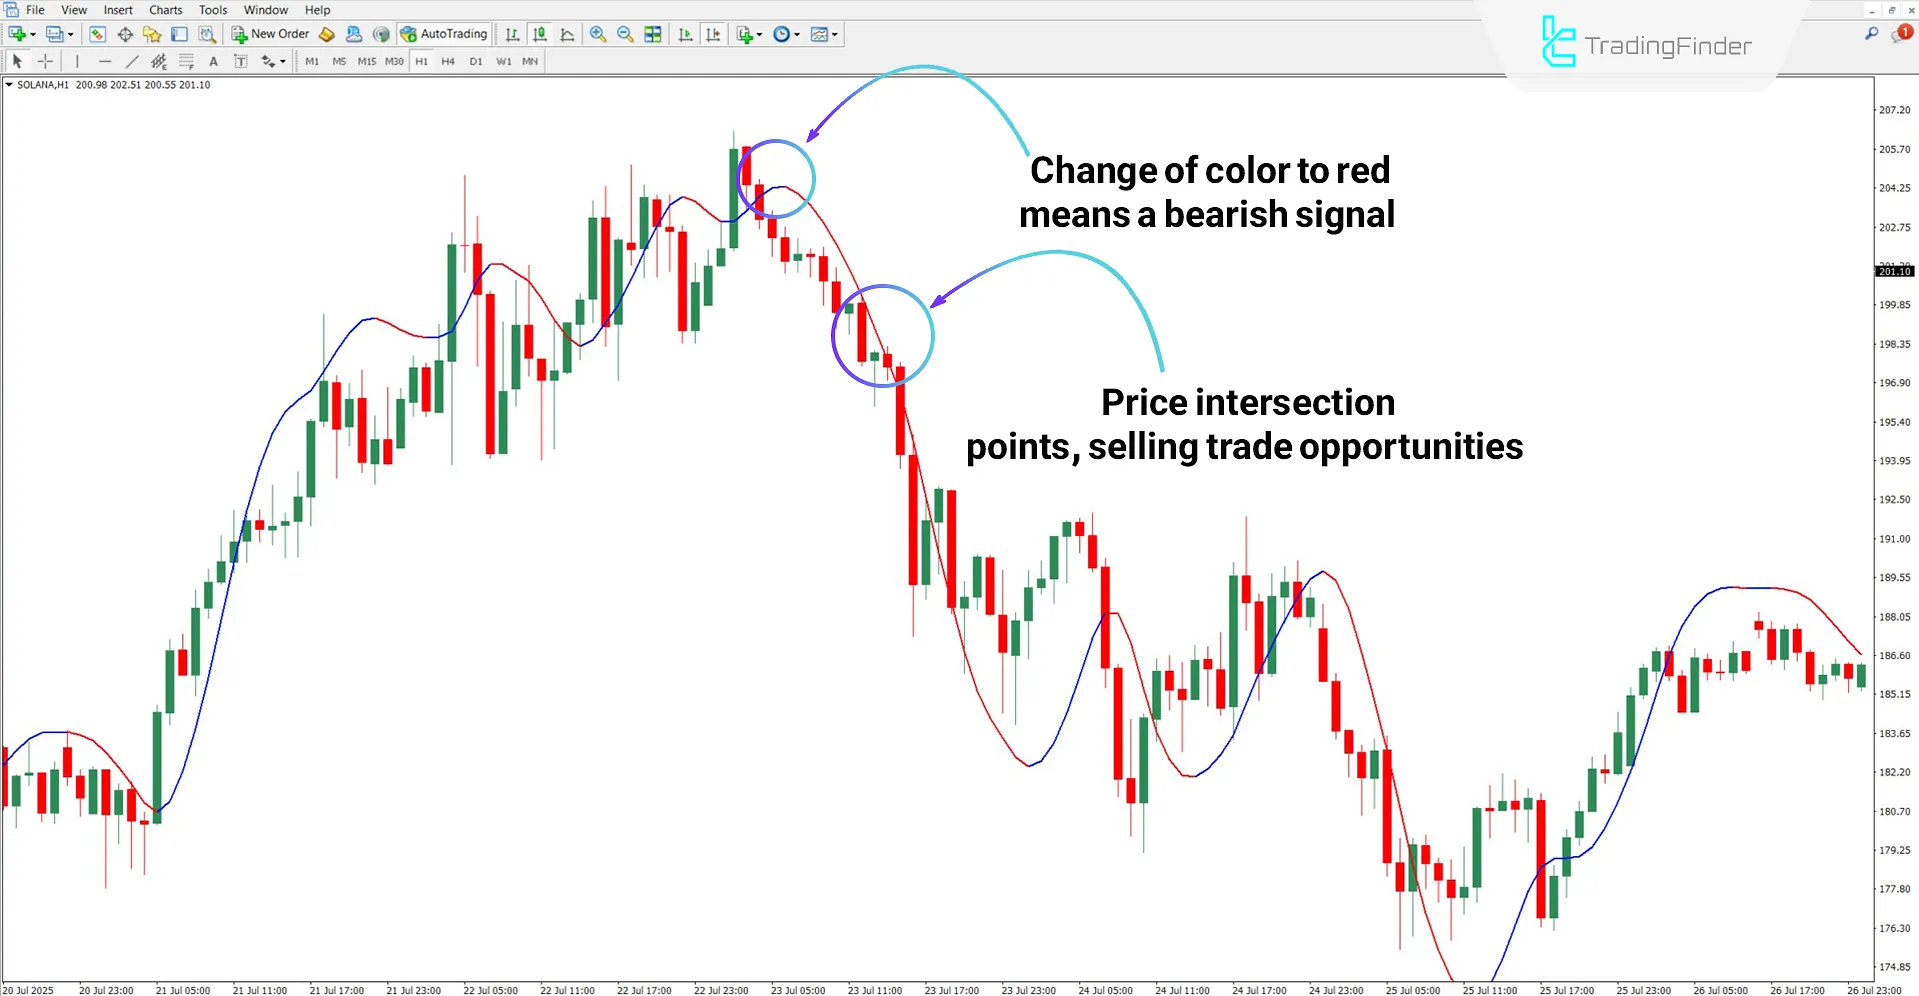
When the trend is bullish, the signal line is displayed in blue, and when bearish, the signal line is displayed in red.
Bullish Trend
Based on the NZD/USD chart in the 5-minute timeframe, the change of the indicator line from red to blue indicates the beginning of a bullish trend.
Afterward, price touch points with the signal line are considered suitable entry opportunities for buy trades.

Bearish Trend
According to the Solana (SOL) cryptocurrency chart in the 1-hour timeframe, the signal line shifts from blue to red, indicating the beginning of a bearish trend.
In this condition, price that touches the signal line in the market's direction are considered sell trading opportunities.

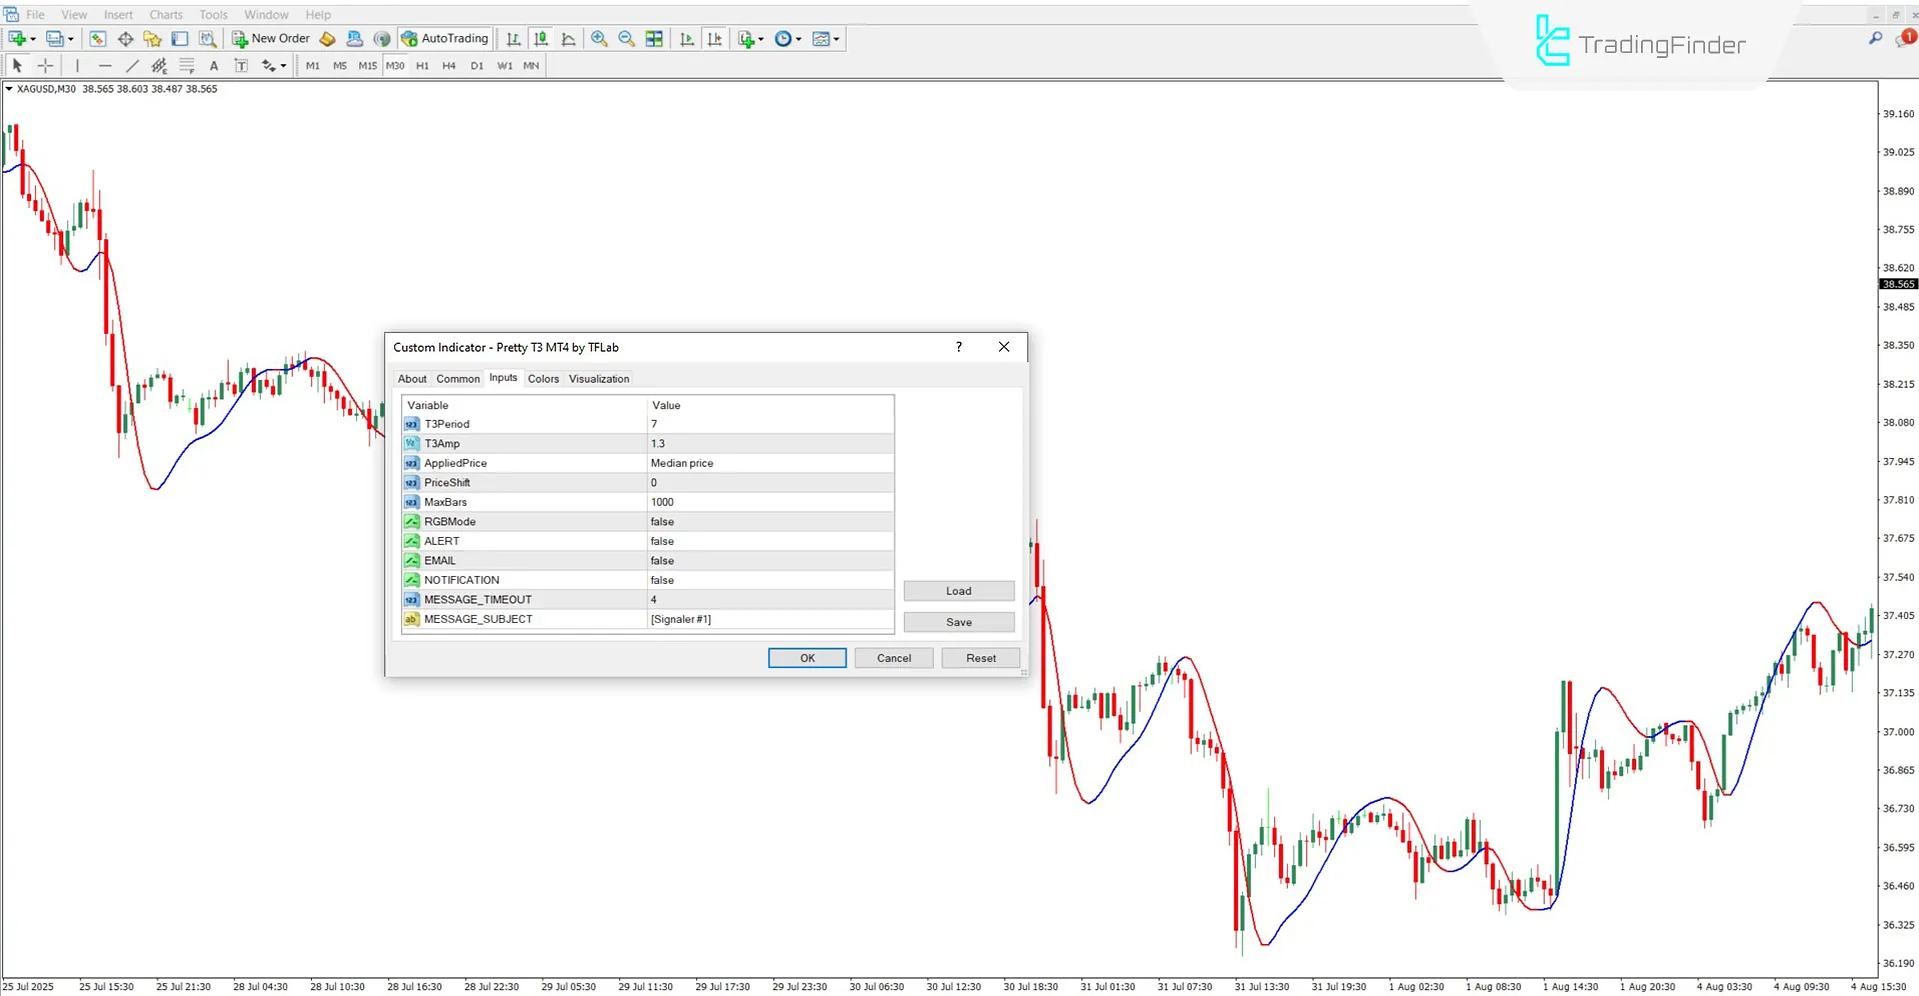
Pretty T3 Indicator Settings
The settings of the Pretty T3 Indicator are as follows:

- T3Period: Indicator calculation period
- T3Amp: Smoothing coefficient
- AppliedPrice: Type of price used
- PriceShift: Indicator line shift on the chart
- MaxBars: Maximum number of candles in calculation
- RGBMode: Enable color change mode
- ALERT: Enable alert
- EMAIL: Send alert via email
- NOTIFICATION: Send notification
- MESSAGE_TIMEOUT: Time interval between alerts
- MESSAGE_SUBJECT [Signaler #1]: Alert title
Conclusion
The Pretty T3 Indicator, by using a moving average and smoothing technique, displays the market trend simply and understandably.
The color change of the signal line from blue to red or vice versa is an indication of trend reversal and serves as the main basis for making entry or exit decisions.
In addition to its signaling role, this indicator also acts as a dynamic support and resistance level.
Pretty T3 Indicator for MT4 PDF
Pretty T3 Indicator for MT4 PDF
Click to download Pretty T3 Indicator for MT4 PDFCan this indicator be used on higher timeframes?
Yes, the Pretty T3 Indicator is multi-timeframe and can be used across all timeframes.
How does this indicator provide bullish and bearish signals?
The Pretty T3 Indicator issues alerts by changing the signal line color to blue or red, indicating bullish or bearish trends.


