![Previous Highs and Lows Indicator MT4 – Free Download [TradingFinder]](https://cdn.tradingfinder.com/image/482955/2-117-en-previous-highs-and-lows-mt4-1.webp)
![Previous Highs and Lows Indicator MT4 – Free Download [TradingFinder] 0](https://cdn.tradingfinder.com/image/482955/2-117-en-previous-highs-and-lows-mt4-1.webp)
![Previous Highs and Lows Indicator MT4 – Free Download [TradingFinder] 1](https://cdn.tradingfinder.com/image/482954/2-117-en-previous-highs-and-lows-mt4-2.webp)
![Previous Highs and Lows Indicator MT4 – Free Download [TradingFinder] 2](https://cdn.tradingfinder.com/image/482952/2-117-en-previous-highs-and-lows-mt4-3.webp)
![Previous Highs and Lows Indicator MT4 – Free Download [TradingFinder] 3](https://cdn.tradingfinder.com/image/482953/2-117-en-previous-highs-and-lows-mt4-4.webp)
The Previous Highs & Lows indicator uses raw price data to detect the most recent High and Low levels over predefined timeframes, displaying them as horizontal (static or dynamic) lines on the chart.
These levels are calculated based on the highest and lowest prices of the current day, previous day, previous week, or the last candle. The algorithm continuously analyzes breakout and reactive levels based on new candlestick structures.
Previous Highs and Lows Indicator Table
The general features of the Previous Highs and Lows indicator are presented in the table below.
Indicator Categories: | Support & Resistance MT4 Indicators Trading Assist MT4 Indicators Levels MT4 Indicators |
Platforms: | MetaTrader 4 Indicators |
Trading Skills: | Intermediate |
Indicator Types: | Breakout MT4 Indicators Reversal MT4 Indicators |
Timeframe: | Multi-Timeframe MT4 Indicators |
Trading Style: | Intraday MT4 Indicators |
Trading Instruments: | Stock Market MT4 Indicators Cryptocurrency MT4 Indicators Forex MT4 Indicators |
Previous Highs and Lows Indicator Overview
In the Previous Highs and Lows indicator, high and low levels are typically zones where the price tends to react. Upon contact, the market may reverse or continue in a trending move, particularly in the case of a valid breakout.
The conversion of these levels into support or resistance offers suitable trade entries. The type of price reaction depends on candle strength, trading volume, and the overall market structure.
Indicator in an Uptrend
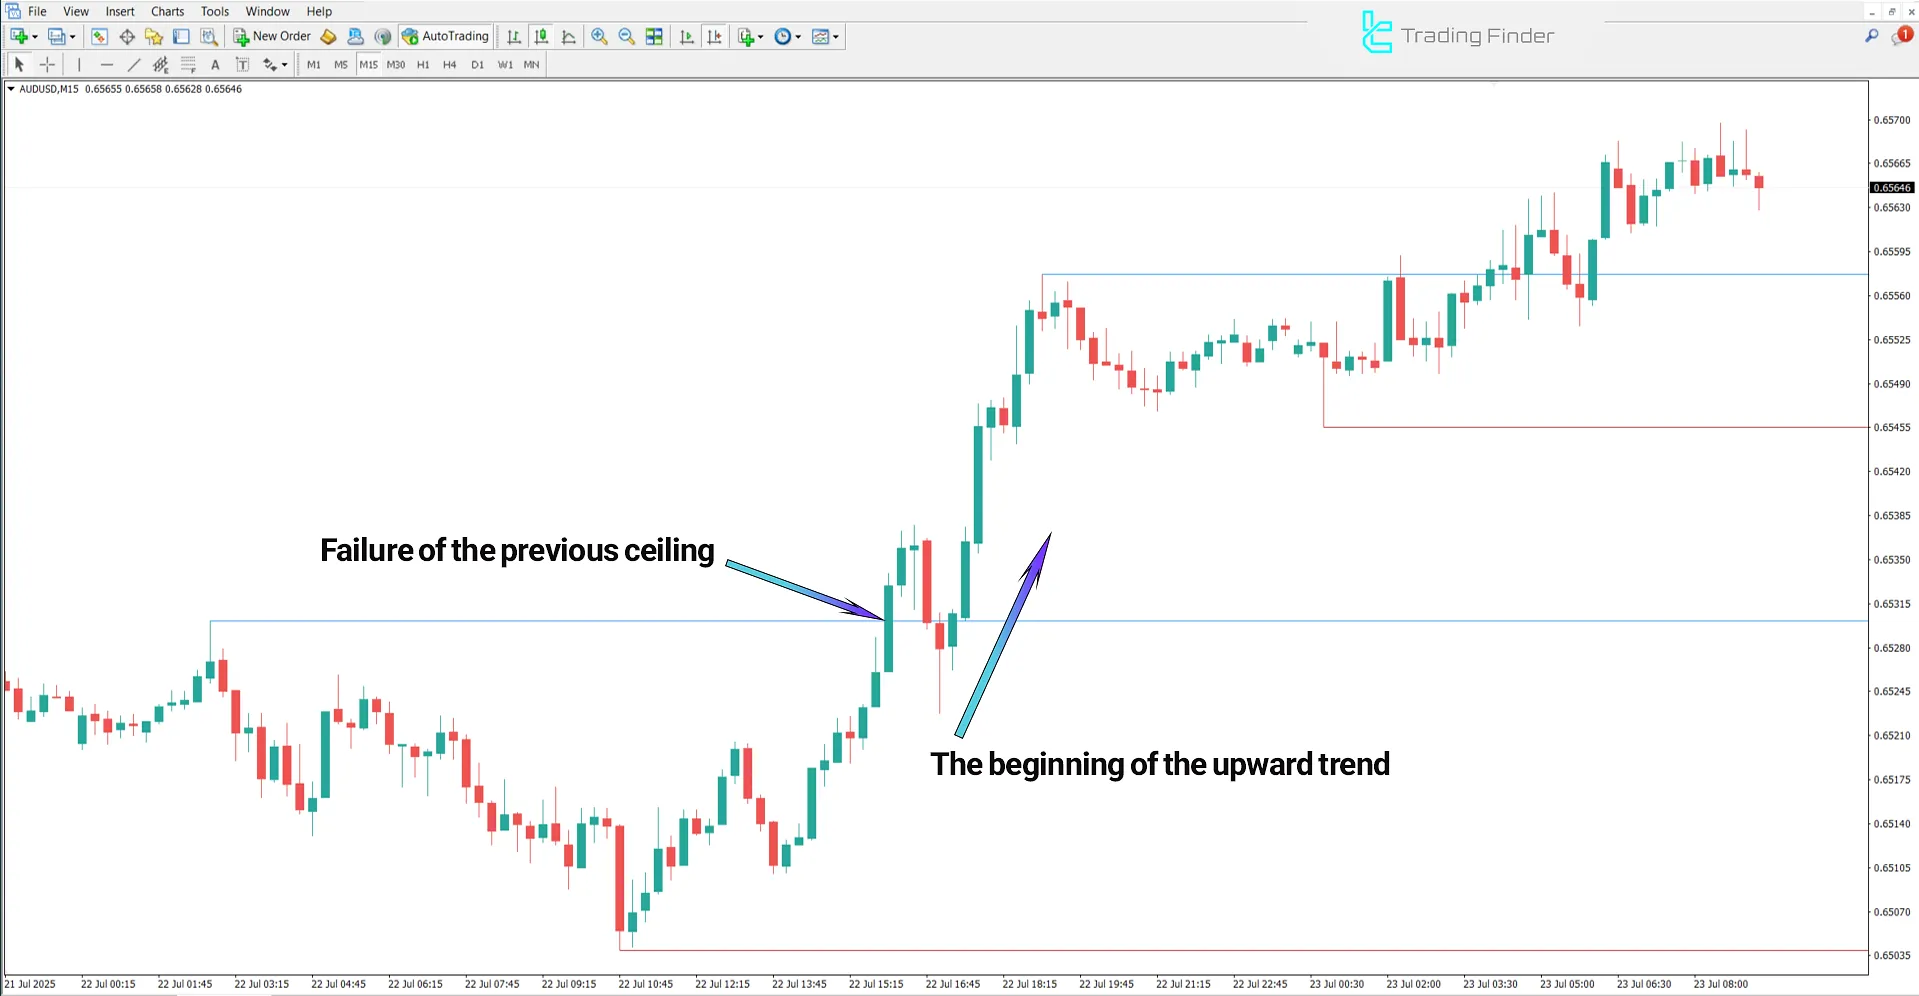
In the 15-minute timeframe of the AUD/USD pair, after breaking the previous high indicated by the blue horizontal line, the price initiates an intense upward phase. This breakout confirms the bullish structure and the start of a new wave of buying pressure.
Subsequently, the price pulls back to the broken level and consolidates without a deep correction. A positive reaction to this level, along with its failure to break downward, provides an ideal setup for buy entries.

Indicator in a Downtrend
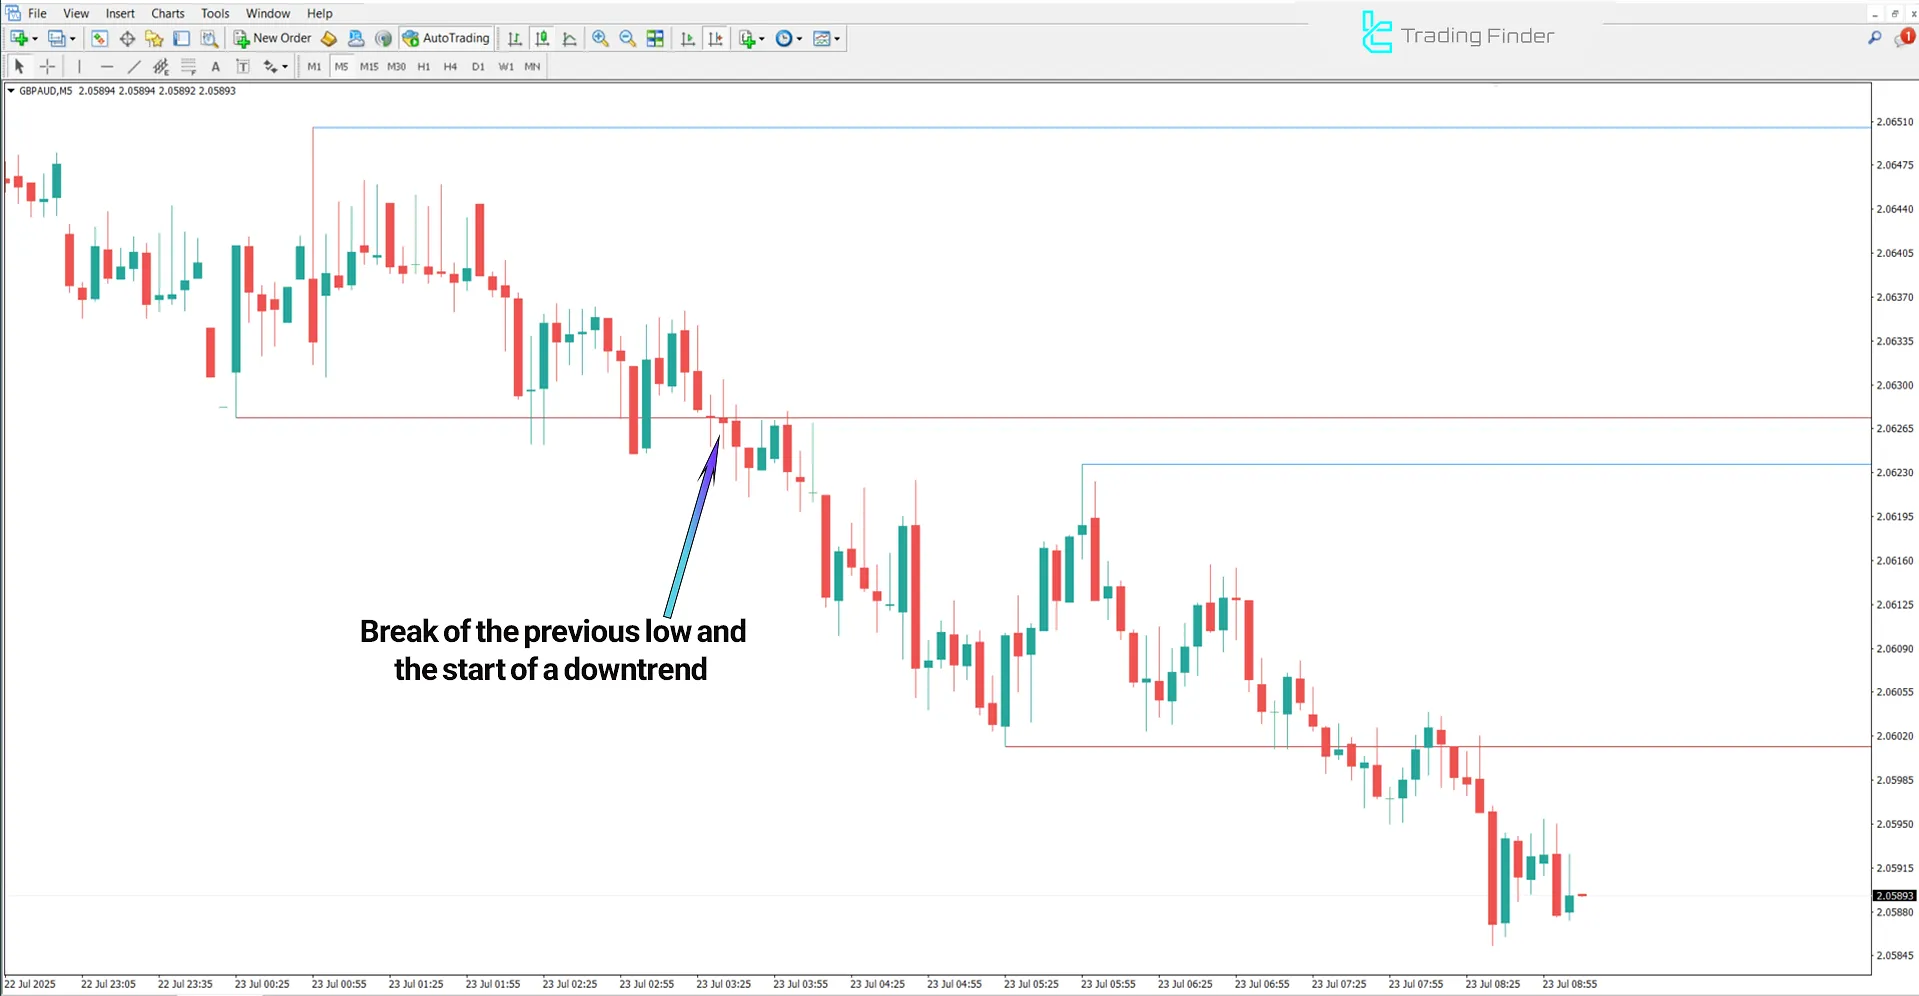
The chart below shows the GBP/AUD pair on the 5-minute timeframe. In the downtrend, a break of the previous low confirms further market weakness. A return to this level and its subsequent conversion into resistance presents a good opportunity for selling entries.
Additionally, long-wicked candles highlight buyer weakness and dominant selling pressure.

Settings Panel of the Previous Highs and Lows Indicator
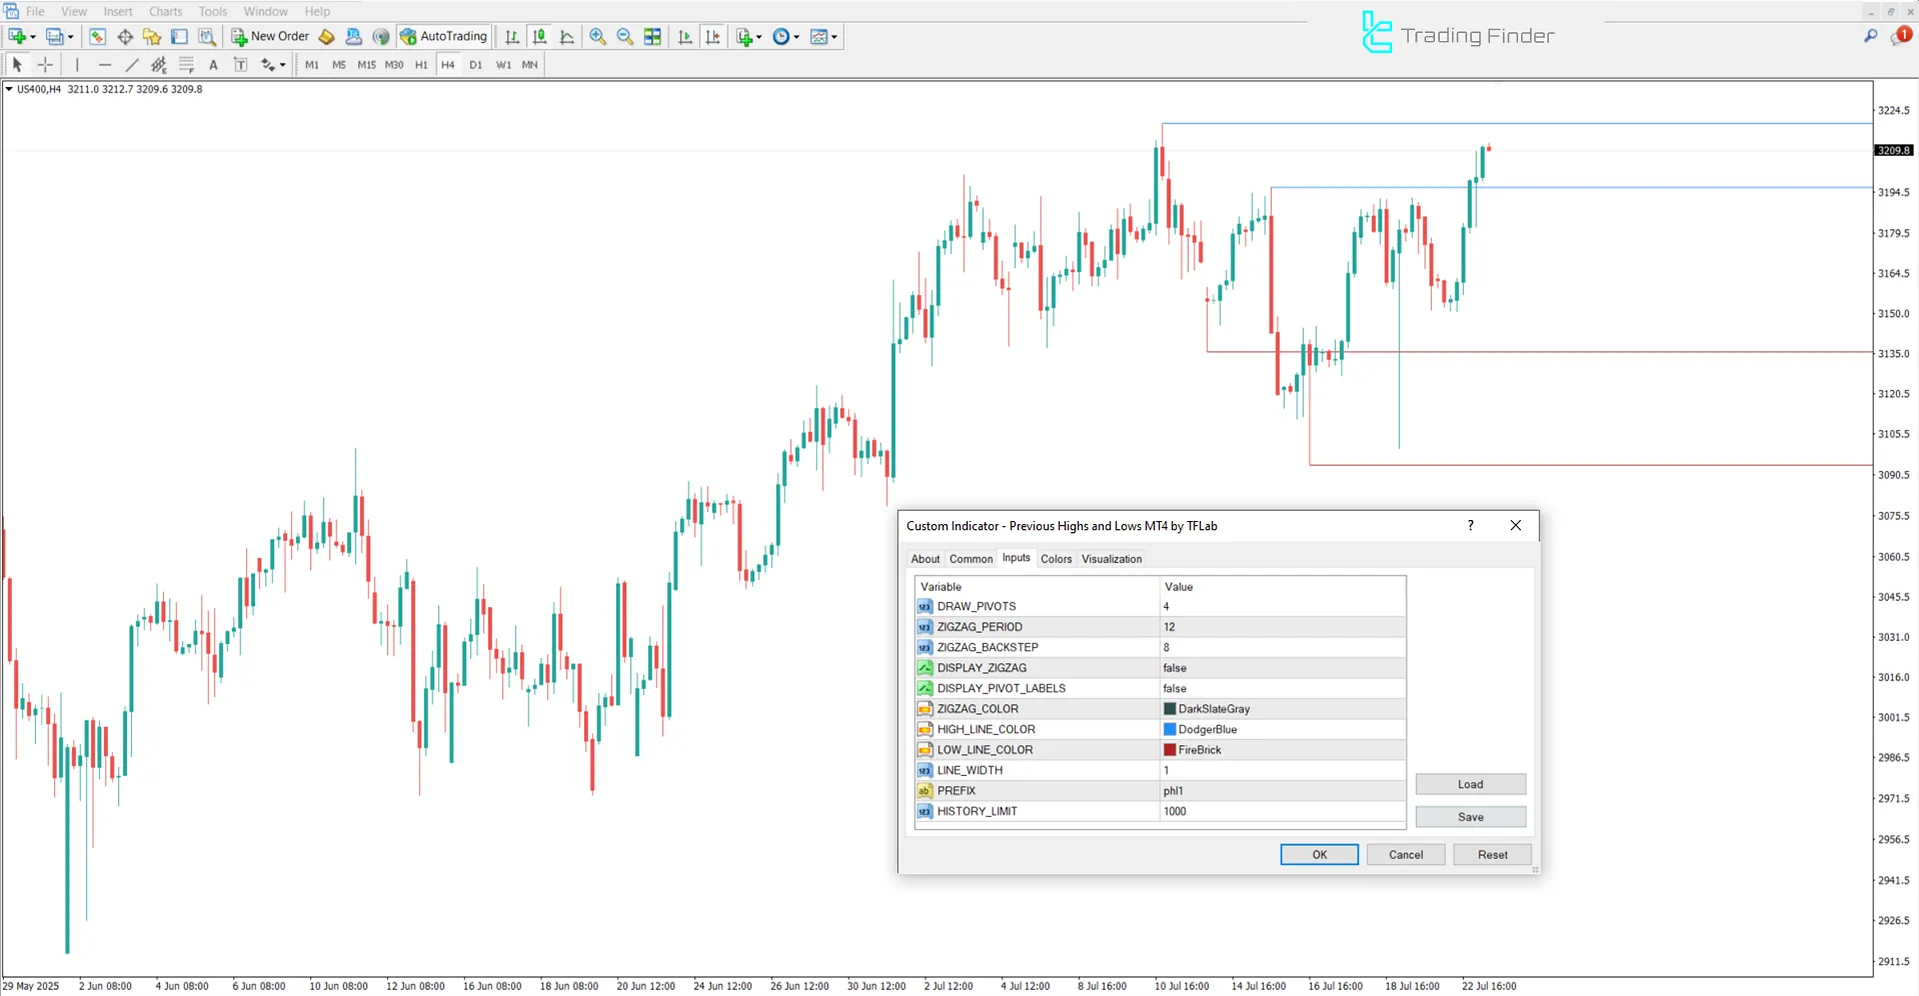
The image below displays the settings panel for the Previous Highs and Lows indicator in MetaTrader 4:

- DRAW PIVOTS: Display Draw pivot levels;
- ZIGZAG PERIOD: Zigzag indicator period;
- ZIGZAG BACKSTEP: Minimum candle distance between Zigzag turning points;
- DISPLAY ZIGZAG: Show Zigzag lines on the chart;
- DISPLAY PIVOT LABELS: Display pivot level labels;
- HIGH LINE COLOR: Color of high-level lines;
- LOW LINE COLOR: Color of low-level lines;
- LINE WIDTH: Width of the drawn lines;
- PREFIX: Label prefix for levels;
- HISTORY LIMIT: Limit for the number of past candles to analyze.
Conclusion
The Previous Highs and Lows indicator is a structure-focused technical analysis tool that emphasizes the highest and lowest points to help understand price behavior and analyze market structure.
By drawing reactive levels based on price data, this indicator allows traders to visually identify support and resistance zones effectively.
Previous Highs and Lows Indicator MT4 PDF
Previous Highs and Lows Indicator MT4 PDF
Click to download Previous Highs and Lows Indicator MT4 PDFOn what basis does the Previous Highs and Lows indicator identify High and Low levels?
This tool uses raw price data to identify highs and lows over the most recent periods and plots them on the chart.
Does the Previous Highs and Lows indicator provide buy or sell signals?
No, this indicator does not directly generate signals. It highlights key structural levels instead.


