![Price Action Scanner Indicator for MetaTrader 4 Download - [TradingFinder]](https://cdn.tradingfinder.com/image/200180/2-3-en-price-action-scanner-mt4-1.webp)
![Price Action Scanner Indicator for MetaTrader 4 Download - [TradingFinder] 0](https://cdn.tradingfinder.com/image/200180/2-3-en-price-action-scanner-mt4-1.webp)
![Price Action Scanner Indicator for MetaTrader 4 Download - [TradingFinder] 1](https://cdn.tradingfinder.com/image/200182/2-3-en-price-action-scanner-mt4-2.webp)
![Price Action Scanner Indicator for MetaTrader 4 Download - [TradingFinder] 2](https://cdn.tradingfinder.com/image/200181/2-3-en-price-action-scanner-mt4-3.webp)
![Price Action Scanner Indicator for MetaTrader 4 Download - [TradingFinder] 3](https://cdn.tradingfinder.com/image/200179/2-3-en-price-action-scanner-mt4-4.webp)
The Price Action Scanner Indicator consists of six famous candlestick patterns; these patterns include:Two candlesticks with close highs or lows,Two candlesticks with equal highs or lows,Wide range candlesticks,Reversal points,Bullish, bearish, andPin Bars.
Price Action Scanner Indicator Specifications Table
Table below provides an overview of the main specifications of the Price Action Scanner indicator:
Indicator Categories: | Price Action MT4 Indicators Chart & Classic MT4 Indicators Candle Sticks MT4 Indicators |
Platforms: | MetaTrader 4 Indicators |
Trading Skills: | Intermediate |
Indicator Types: | Reversal MT4 Indicators |
Timeframe: | Multi-Timeframe MT4 Indicators |
Trading Style: | Intraday MT4 Indicators |
Trading Instruments: | Share Stocks MT4 Indicators Forward Market MT4 Indicators Indices Market MT4 Indicators Commodity Market MT4 Indicators Stock Market MT4 Indicators Cryptocurrency MT4 Indicators Forex MT4 Indicators |
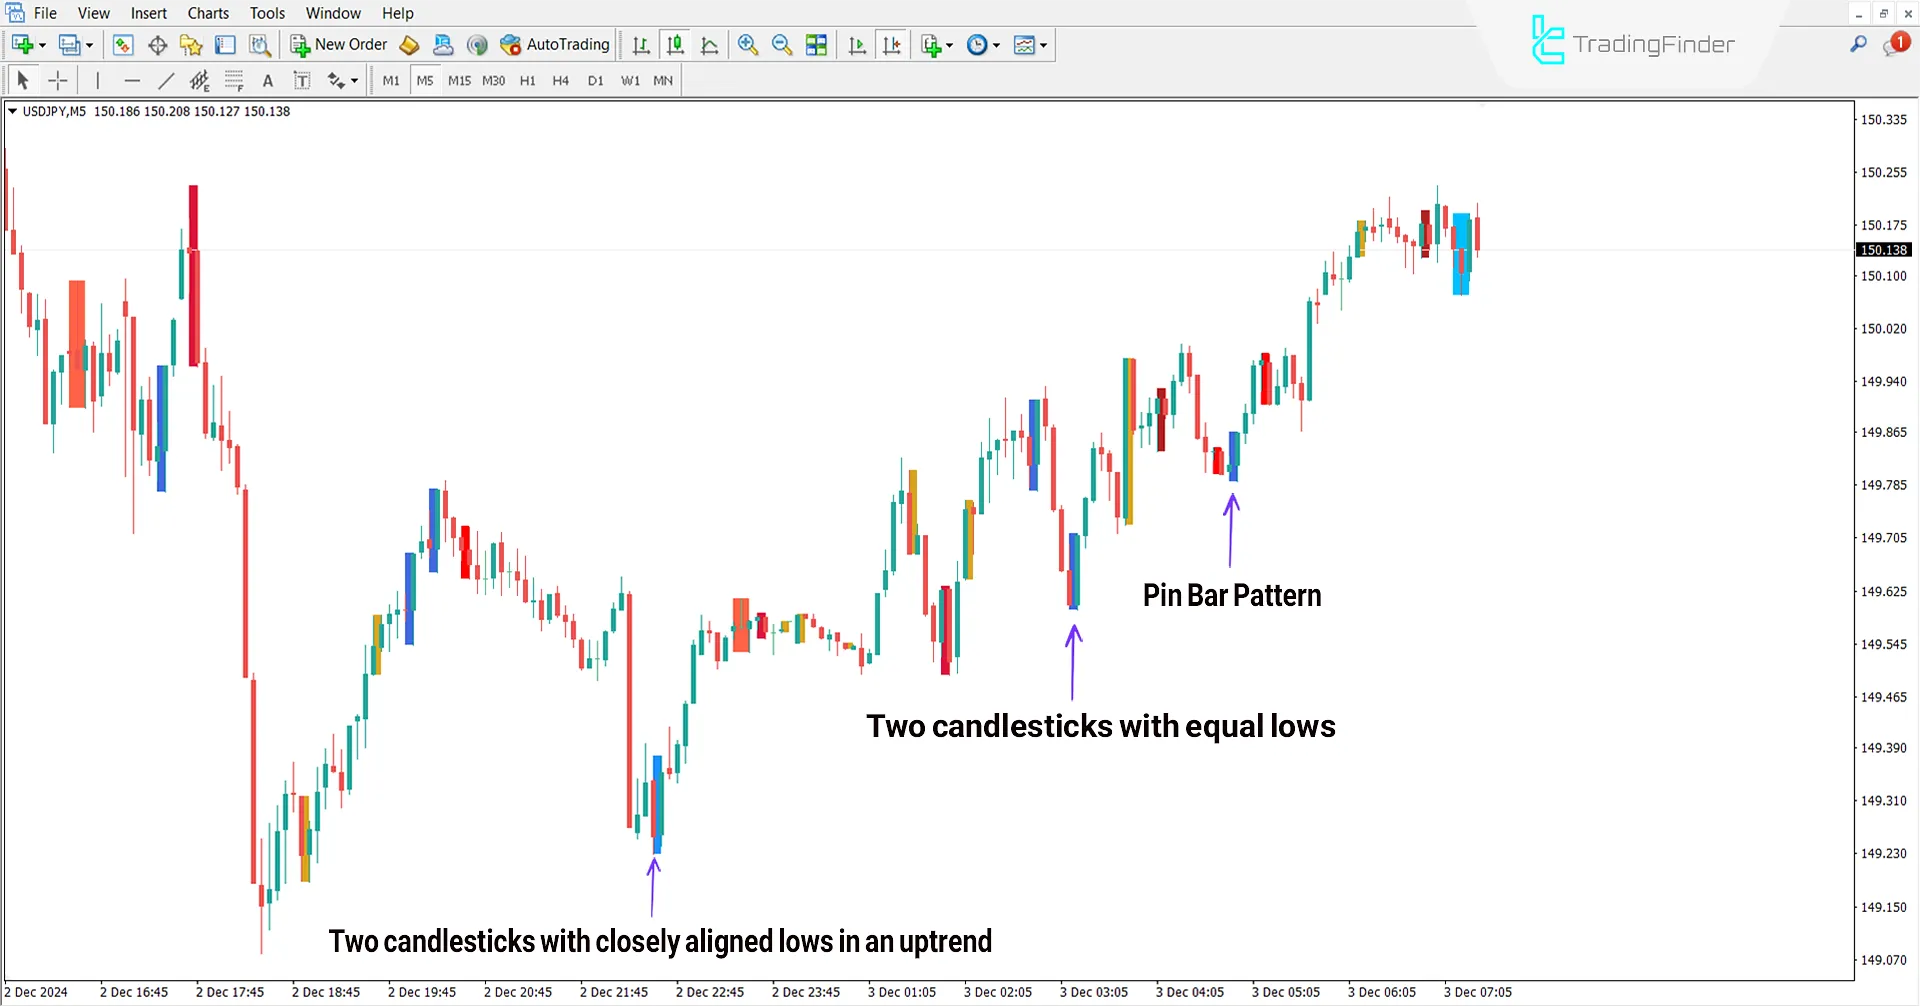
Uptrend Conditions
The image below shows the price chart of the USD/JPY pair on a 5-minute timeframe. The colored blocks represent the formation of one of the candlestick patterns.
Based on the formation of these patterns during a bullish trend, entry points are provided for traders.

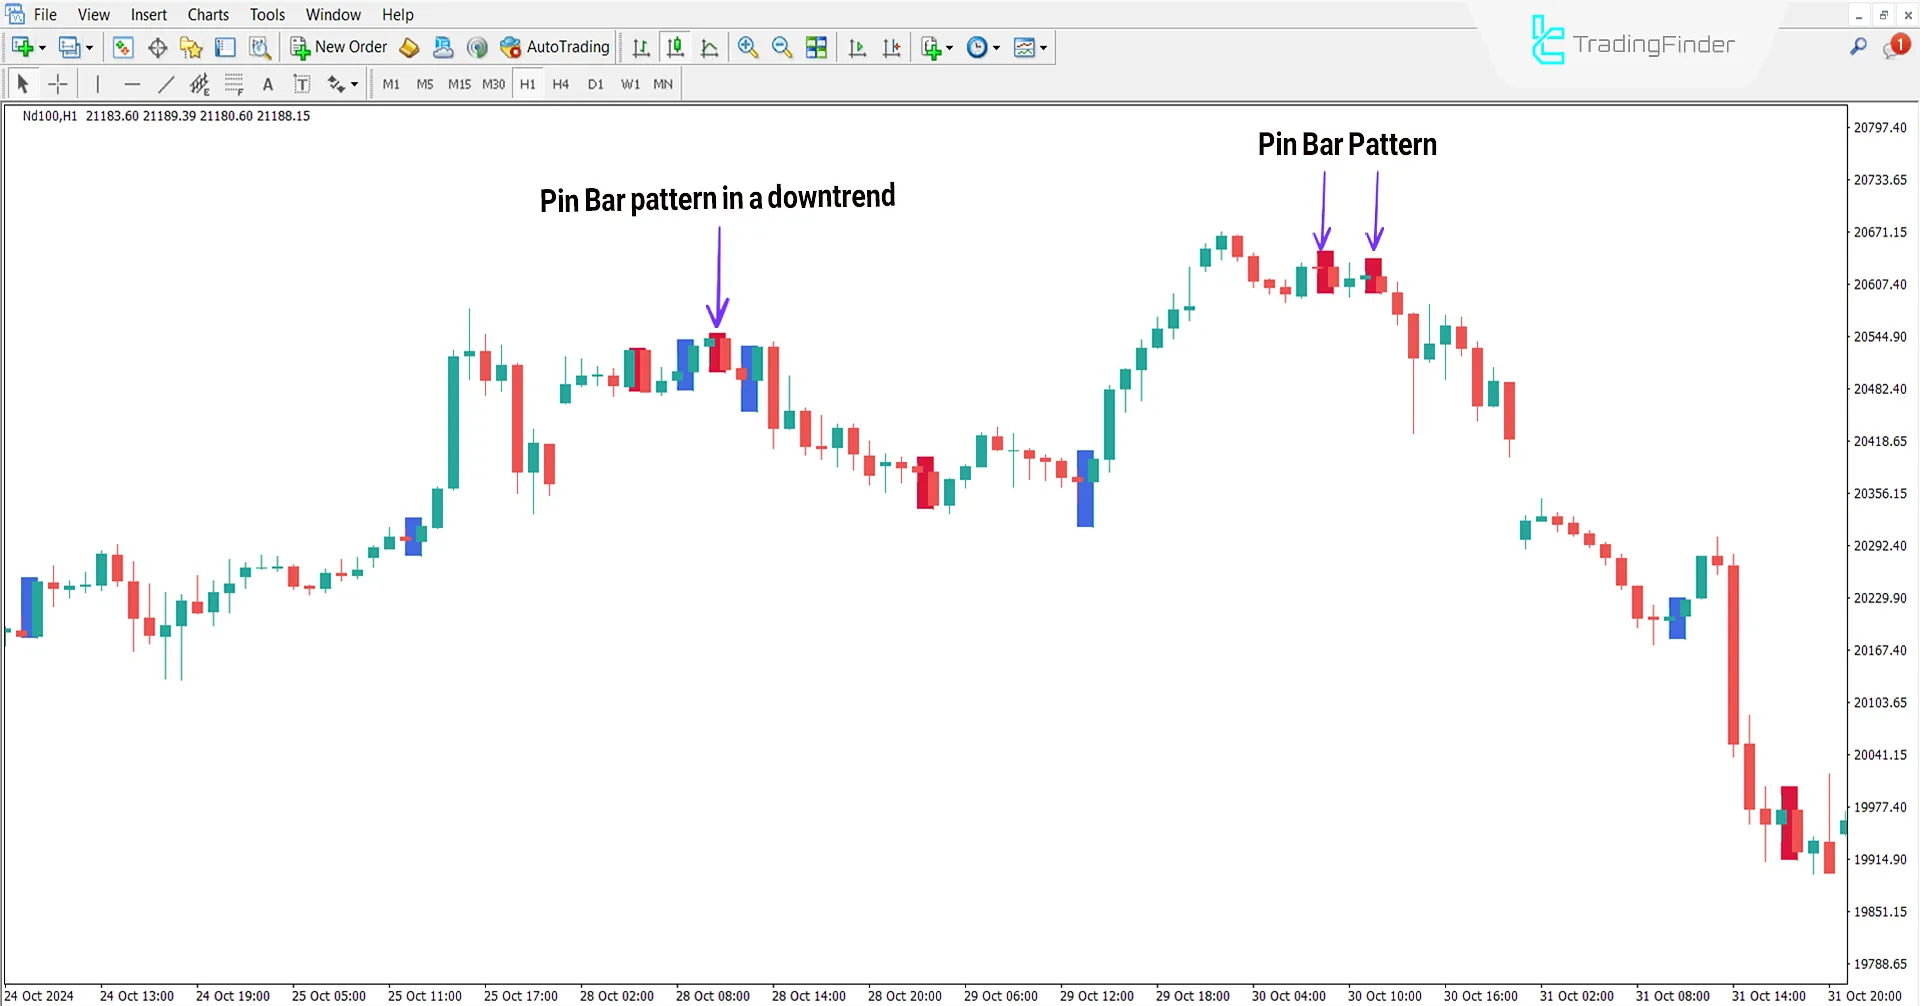
Downtrend Conditions
The image below shows the price chart of the Dow Jones Index (DJI) on a 1-hour timeframe.
The tool detectscolored blocks in a bearish trend and, based on the specified candlestick patterns indicators
, provides entry zones and trend changes for traders.

Indicator Settings
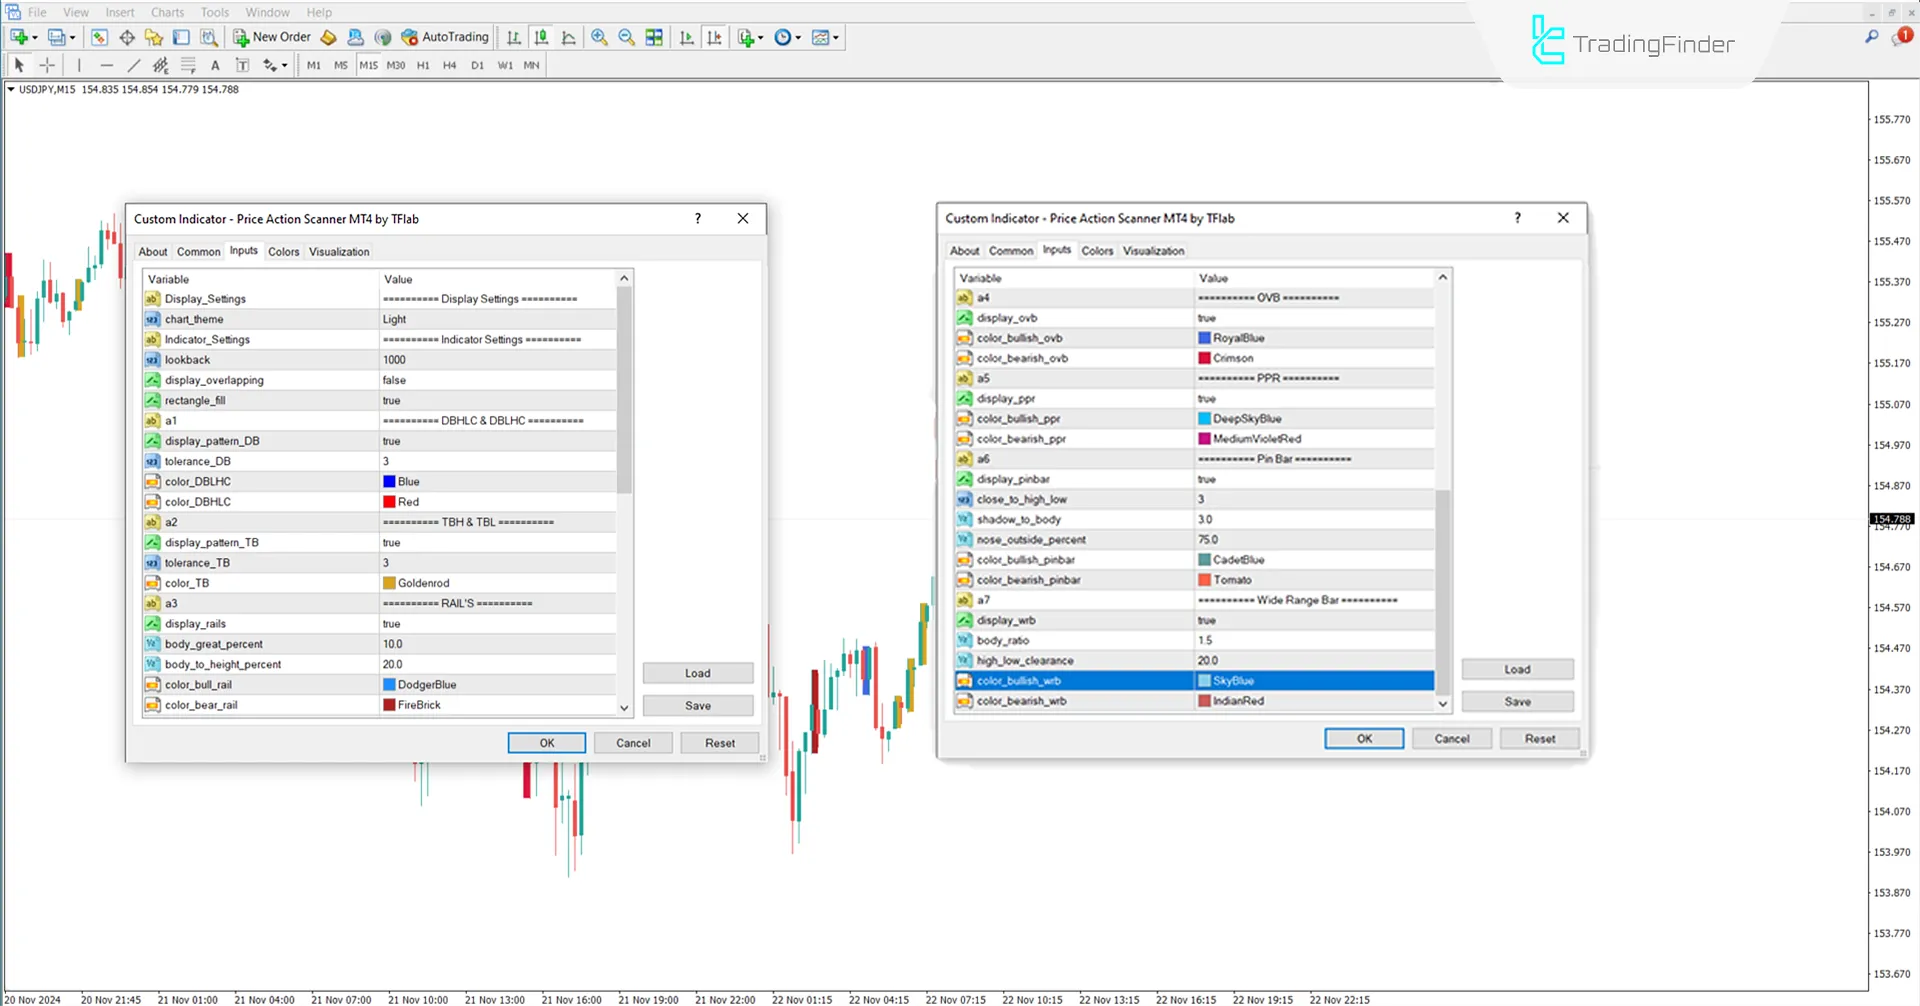
All configurable options of the Price Action Scanner indicator are listed in the table below:

- Chart theme: Chart theme;
- Lookback: Number of indicator candlesticks;
- Display overlapping: Display overlapping;
- Rectangle fill: Fill rectangle.
DBHLC & DBLHC Section
- Display pattern DB: Display DBHLC and DBLLHC patterns;
- Tolerance DB: Error tolerance percentage for identifying these patterns;
- Color DBHLC: Color for DBHLC pattern;
- Color DBLLHC: Color for DBLLHC pattern.
TBH & TBL Section
- Display pattern_TB: Display TBH and TBL patterns;
- Tolerance TB: Error tolerance percentage for identifying these patterns;
- Color TB: Color for TBH and TBL patterns.
RAIL’S Section
- Display rails: Display Rail patterns;
- Body great percent: Candle body size percentage for identifying Rail;
- Body to height percent: Ratio of the candle body to its total height for identifying Rail;
- Color bull rail: Color for bullish Rail;
- Color bear rail: Color for bearish Rail.
OVB Section
- Display ovb: Display Outside Vertical pattern;
- Color bullish ovb: Color for bullish OVB bar;
- Color bearish ovb: Color for bearish OVB bar.
PPR Section
- Display_ppr: Enable or disable PPR pattern display;
- Color_bullish_ppr: Color for bullish PPR;
- Color_bearish_ppr: Color for bearish PPR.
Pin Bar Section
- Display pinbar: Display Pin Bar;
- Close tohigh low: Set the closing price proximity to the high or low of the candle;
- Shadow to body: Ratio of shadow to the candle body in pattern identification;
- Nose outside percent: Shadow protrusion percentage outside the candle range for pattern confirmation;
- Color bullish pinbar: Color for bullish Pin Bars;
- Color bearish pinbar: Color for bearish Pin Bars.
Wide Range Bar Section
- Display wrb: Enable or disable Wide Range display;
- Body ratio: Candle body size ratio for identifying WRB;
- High low clearance: Distance between the highest and lowest candle prices for WRB confirmation;
- Color bullish wrb: Color for bullish WRB candles;
- Color bearish wrb: Color for bearish WRB candles.
Conclusion
The Price Action Scanner Indicator supports six candlestick patterns. This tool is part of technical analysis indicators that can identify and confirm reversal points, support and resistance levels, and trend continuation or initiation points in MetaTrader 4 indicator.
This indicator automatically detects price behaviors such as double highs and lows, reversal points, and wide-range candlesticks, helping traders make more accurate decisions.
Price Action Scanner MT4 PDF
Price Action Scanner MT4 PDF
Click to download Price Action Scanner MT4 PDFIn which markets can this indicator be used?
This indicator can be used in all financial markets.
Does this indicator only show entry zones?
No, this tool not only identifies entry zones but also accurately detects reversal points and wide-range candlesticks.


