![Range Average Retest Model Indicator MT4 Download – Free – [TradingFinder]](https://cdn.tradingfinder.com/image/628777/13-246-en-range-average-retest-model-mt4-01.webp)
![Range Average Retest Model Indicator MT4 Download – Free – [TradingFinder] 0](https://cdn.tradingfinder.com/image/628777/13-246-en-range-average-retest-model-mt4-01.webp)
![Range Average Retest Model Indicator MT4 Download – Free – [TradingFinder] 1](https://cdn.tradingfinder.com/image/628775/13-246-en-range-average-retest-model-mt4-02.webp)
![Range Average Retest Model Indicator MT4 Download – Free – [TradingFinder] 2](https://cdn.tradingfinder.com/image/628776/13-246-en-range-average-retest-model-mt4-03.webp)
![Range Average Retest Model Indicator MT4 Download – Free – [TradingFinder] 3](https://cdn.tradingfinder.com/image/628778/13-246-en-range-average-retest-model-mt4-04.webp)
The Range Average Retest Model Indicator is a specialized tool for analyzing price ranges and market behavior in ranging conditions.
Using historical data and swing points, this trading tool highlights zones with the highest probability of price reversals or breakouts.
Additionally, it systematically defines entry, exit, and risk management zones.
Range Average Retest Model Indicator Specification Table
The specifications of the Range Average Retest Model Indicator are as follows:
Indicator Categories: | Signal & Forecast MT4 Indicators Trading Assist MT4 Indicators |
Platforms: | MetaTrader 4 Indicators |
Trading Skills: | Elementary |
Indicator Types: | Reversal MT4 Indicators |
Timeframe: | Multi-Timeframe MT4 Indicators |
Trading Style: | Intraday MT4 Indicators Scalper MT4 Indicators Swing Trading MT4 Indicators |
Trading Instruments: | Share Stocks MT4 Indicators Indices Market MT4 Indicators Commodity Market MT4 Indicators Stock Market MT4 Indicators Cryptocurrency MT4 Indicators Forex MT4 Indicators |
Range Average Retest Model Indicator at a Glance
The Range Average Retest Model Indicator first identifies the market’s range and draws a midline at its center. The price movement relative to this line is the main basis for determining market conditions.
Then, based on this structure, the entry, take-profit, and stop-loss zones are automatically displayed on the chart.
Buy Trade Setup
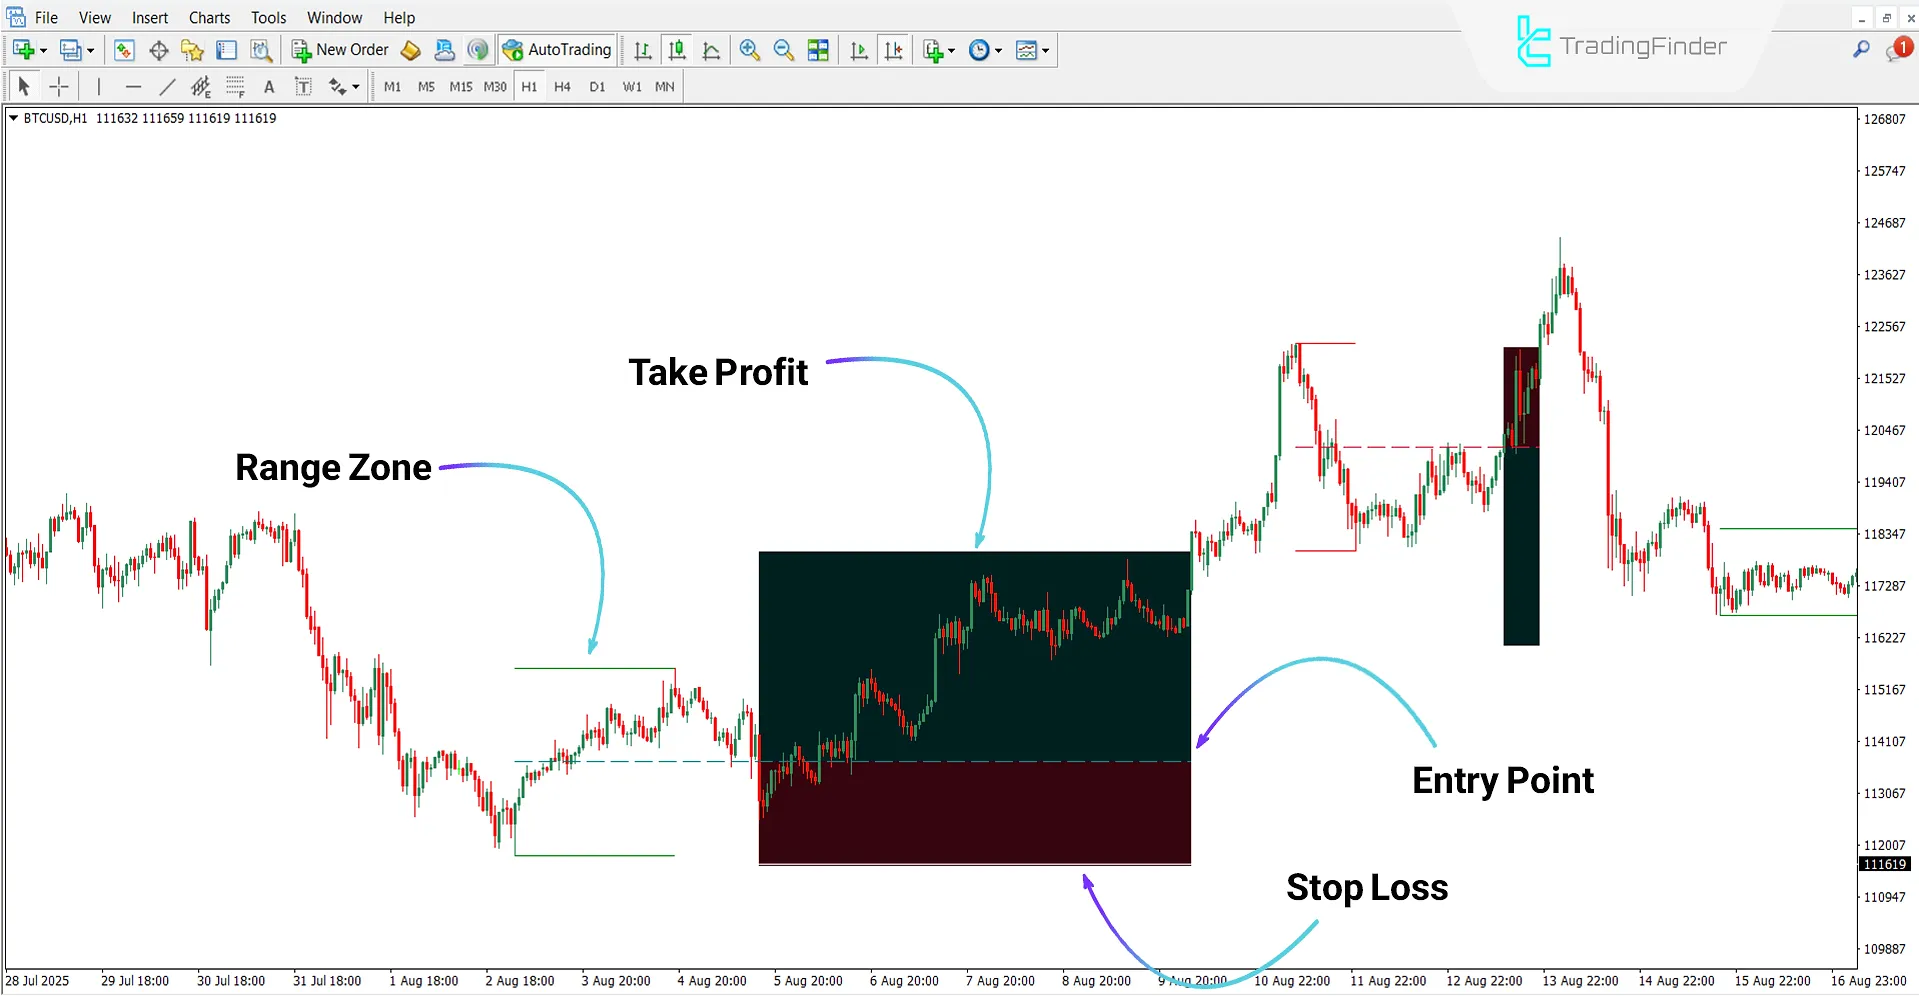
According to the 1-hour chart of Bitcoin (BTC) cryptocurrency, the indicator first identifies the market range and draws the midline to clearly represent the price structure.
In addition, the buy tradesetup, along with take-profit and stop-loss levels, is also displayed on the chart.

Sell Trade Setup
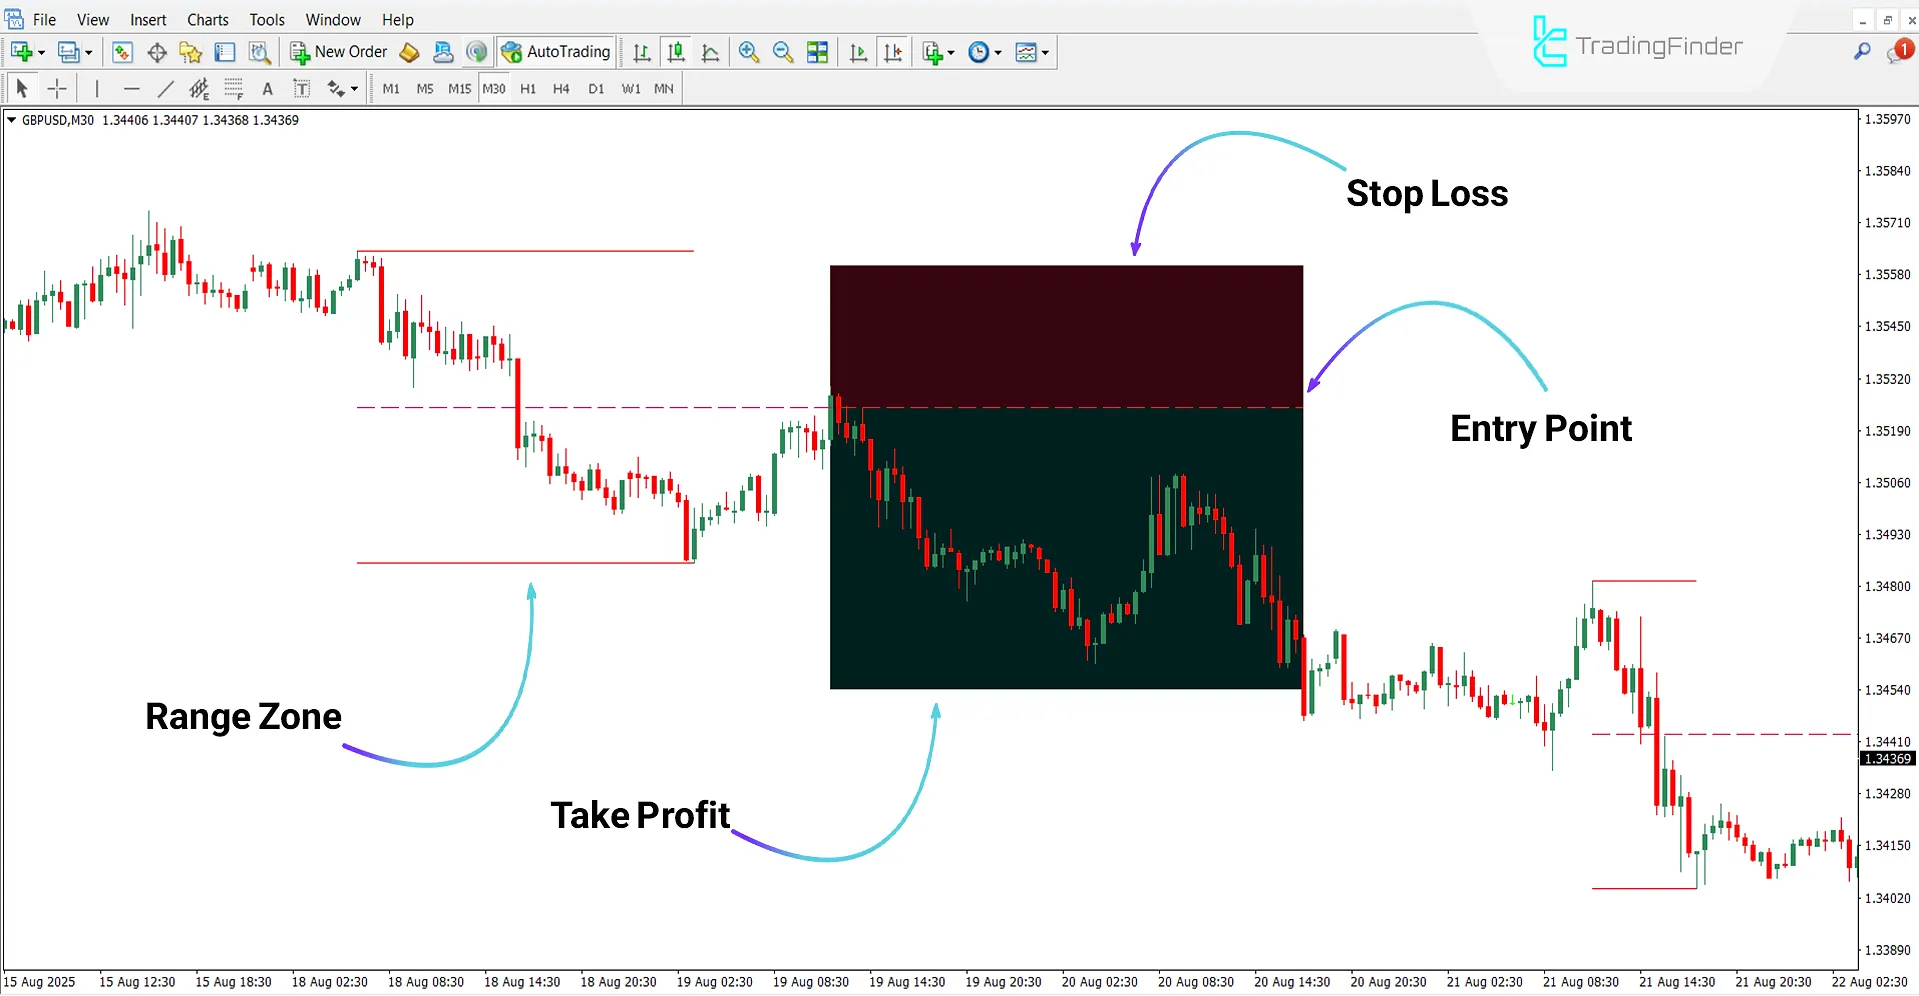
According to the 30-minute chart of GBP/USD, the indicator, based on the identified range, also draws its midline.
The sell entry point, along with the take-profit and stop-loss levels, is displayed as green and red boxes on the chart.

Range Average Retest Model Indicator Settings
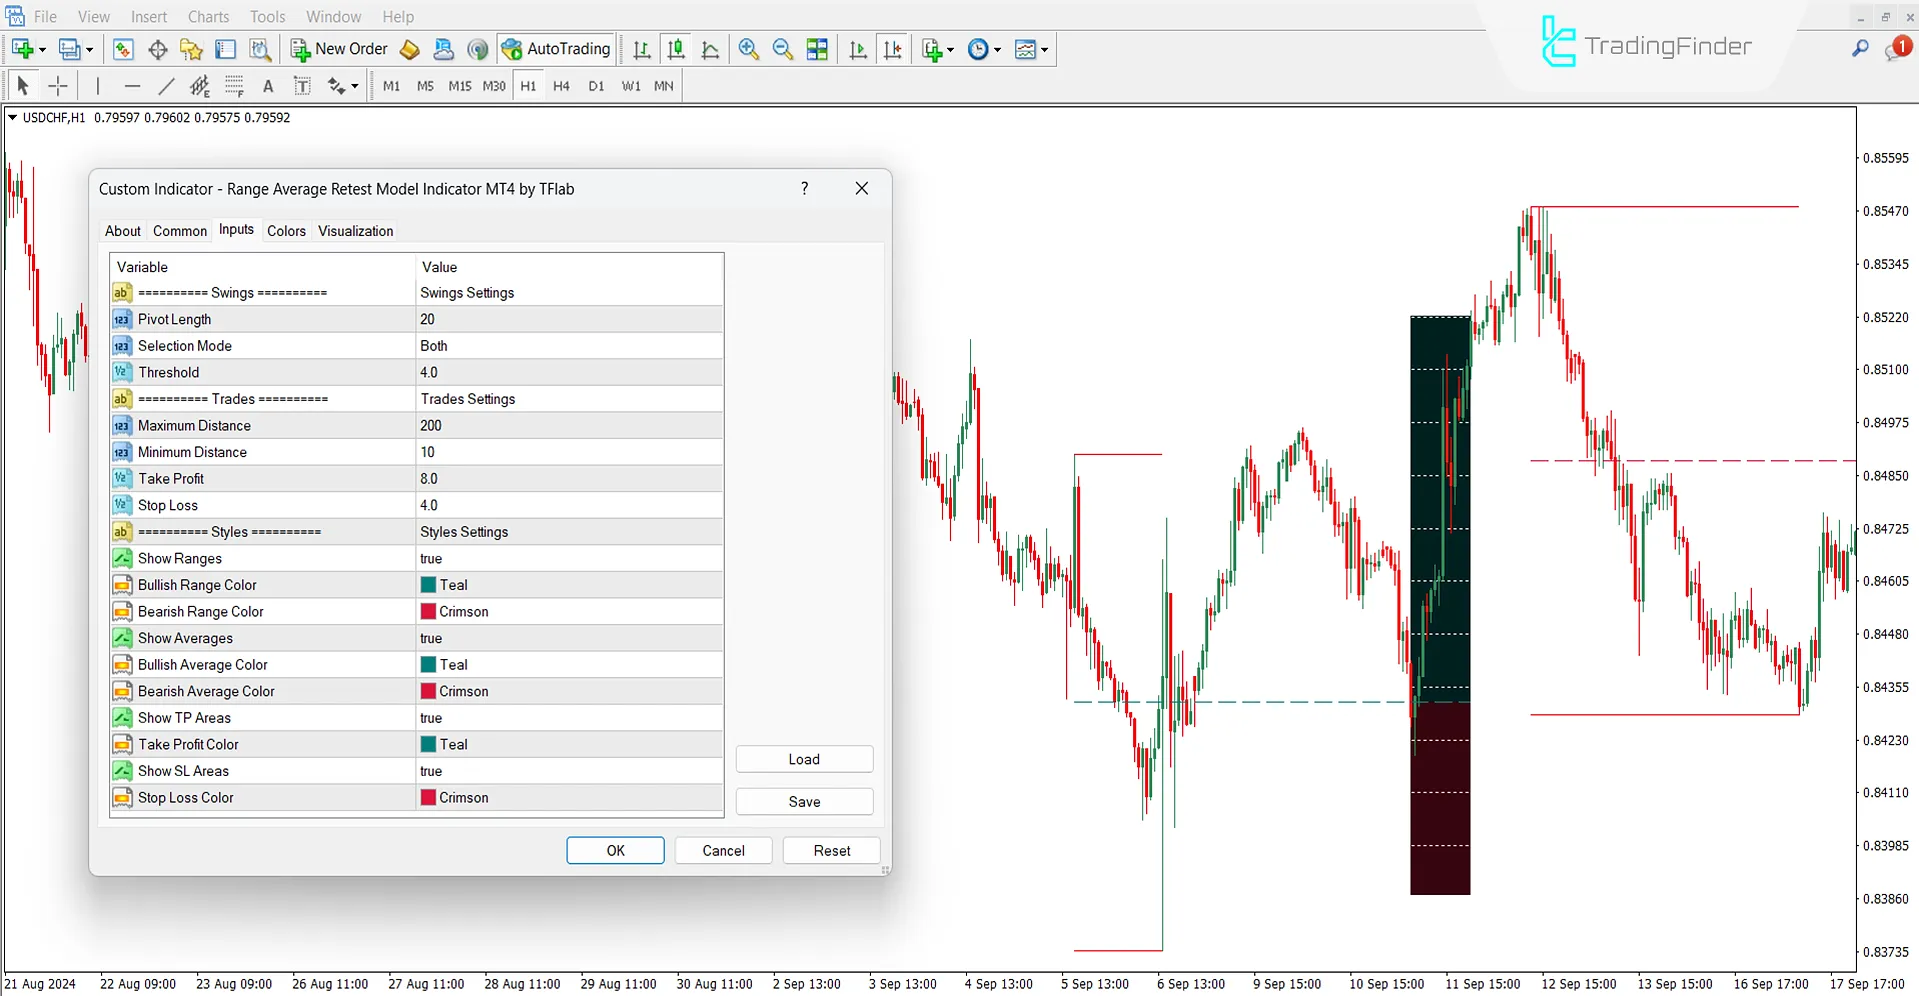
The settings of the Range Average Retest Model Indicator are as follows:

Swings Settings
- Pivot Length: Length of pivot
- Selection Mode: Mode for analyzing both market sides
- Threshold: Sensitivity level for detecting key zones
Trades Settings
- Maximum Distance: Maximum distance between entry point and target level
- Minimum Distance: Minimum distance between entry and calculated range
- Take Profit: Level for trade profit exit
- Stop Loss: Level for trade loss exit
Styles Settings
- Show Ranges: Display of market range zones on chart
- Bullish Range Color: Color for bullish zones
- Bearish Range Color: Color for bearish zones
- Show Averages: Display of average lines for bullish and bearish ranges
- Bullish Average Color: Color for bullish averages
- Bearish Average Color: Color for bearish averages
- Show TP Areas: Display of take-profit zones
- Take Profit Color: Color for take-profit areas
- Show SL Areas: Display of stop-loss zones
- Stop Loss Color: Color for stop-loss areas
Conclusion
The Range Average Retest Model Indicator first identifies the market’s range and then determines entry and exit conditions based on a central midline.
According to price reactions to this line, the entry, take-profit, and stop-loss levels are automatically displayed on the chart.
It should be noted that in the indicator settings, users can customize trading boxes and calculation values.
Range Average Retest Model Indicator MT4 PDF
Range Average Retest Model Indicator MT4 PDF
Click to download Range Average Retest Model Indicator MT4 PDFDoes this tool automatically activate trading positions?
No, the Range Average Retest Model Indicator does not have the ability to activate trading positions.
Can this indicator be used on lower timeframes?
Yes, the Range Average Retest Model Indicator is multi-timeframe and can be used across all timeframes.


