![Range of Candle Indicator for MT4 Download - Free - [TradingFinder]](https://cdn.tradingfinder.com/image/293013/13-91-en-range-of-candle-mt4-01.webp)
![Range of Candle Indicator for MT4 Download - Free - [TradingFinder] 0](https://cdn.tradingfinder.com/image/293013/13-91-en-range-of-candle-mt4-01.webp)
![Range of Candle Indicator for MT4 Download - Free - [TradingFinder] 1](https://cdn.tradingfinder.com/image/293014/13-91-en-range-of-candle-mt4-02.webp)
![Range of Candle Indicator for MT4 Download - Free - [TradingFinder] 2](https://cdn.tradingfinder.com/image/293015/13-91-en-range-of-candle-mt4-03.webp)
![Range of Candle Indicator for MT4 Download - Free - [TradingFinder] 3](https://cdn.tradingfinder.com/image/294950/13-91-en-range-of-candle-mt4-04.webp)
The Range of Candle indicator uses colored bars to assess market volatility in Forex, as well as in other markets such as cryptocurrency, commodities, and stocks.This trading tool calculates market range by comparing the difference between the current candle's high and low with the previous candle's.
It then displays histograms representing increasing or decreasing market volume using these values.
Specification Table of Candle Range Indicator
Below are the specifications and features of the Range of Candle indicator.
Indicator Categories: | Oscillators MT4 Indicators Signal & Forecast MT4 Indicators Volatility MT4 Indicators |
Platforms: | MetaTrader 4 Indicators |
Trading Skills: | Elementary |
Indicator Types: | Reversal MT4 Indicators |
Timeframe: | Multi-Timeframe MT4 Indicators |
Trading Style: | Day Trading MT4 Indicators Scalper MT4 Indicators |
Trading Instruments: | Forward Market MT4 Indicators Stock Market MT4 Indicators Cryptocurrency MT4 Indicators Forex MT4 Indicators |
Range of Candle Indicator at a Glance
Histogram bars in the Candle Range Oscillator represent market volatility and volume, plotted in different colors on the chart:
- Yellow Histogram: Indicates that the current candle's Range (high to low) is greater than the previous candle
- Pink Histogram: Indicates that the current candle's Range is smaller than the previous candle
- Purple Histogram: Indicates that the current candle's Range equals the previous candle
Uptrend Conditions
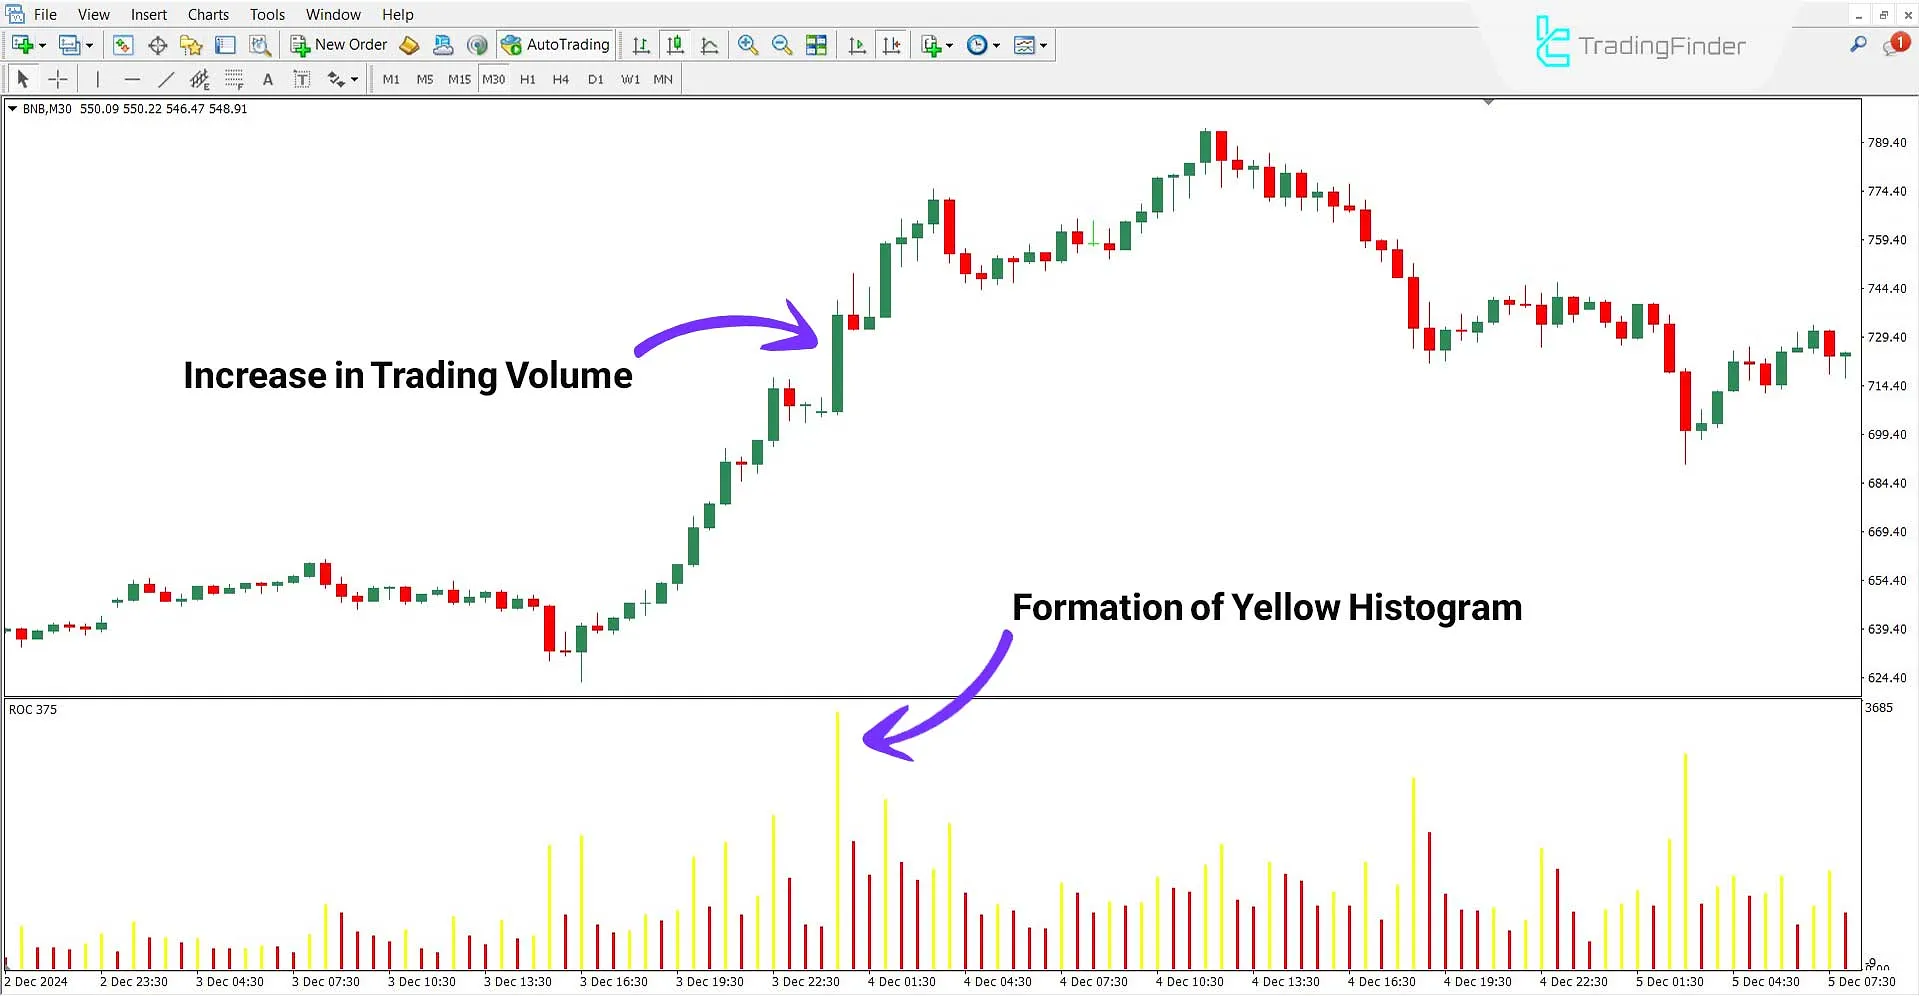
Analyzing the Binance Coin (BNB) cryptocurrency chart in a 30 minute timeframe shows how this volatility Indicator functions in an uptrend.
According to the image, consecutive yellow histograms aligned with green candles indicate increased volatility in an upward trend.

Downtrend Conditions
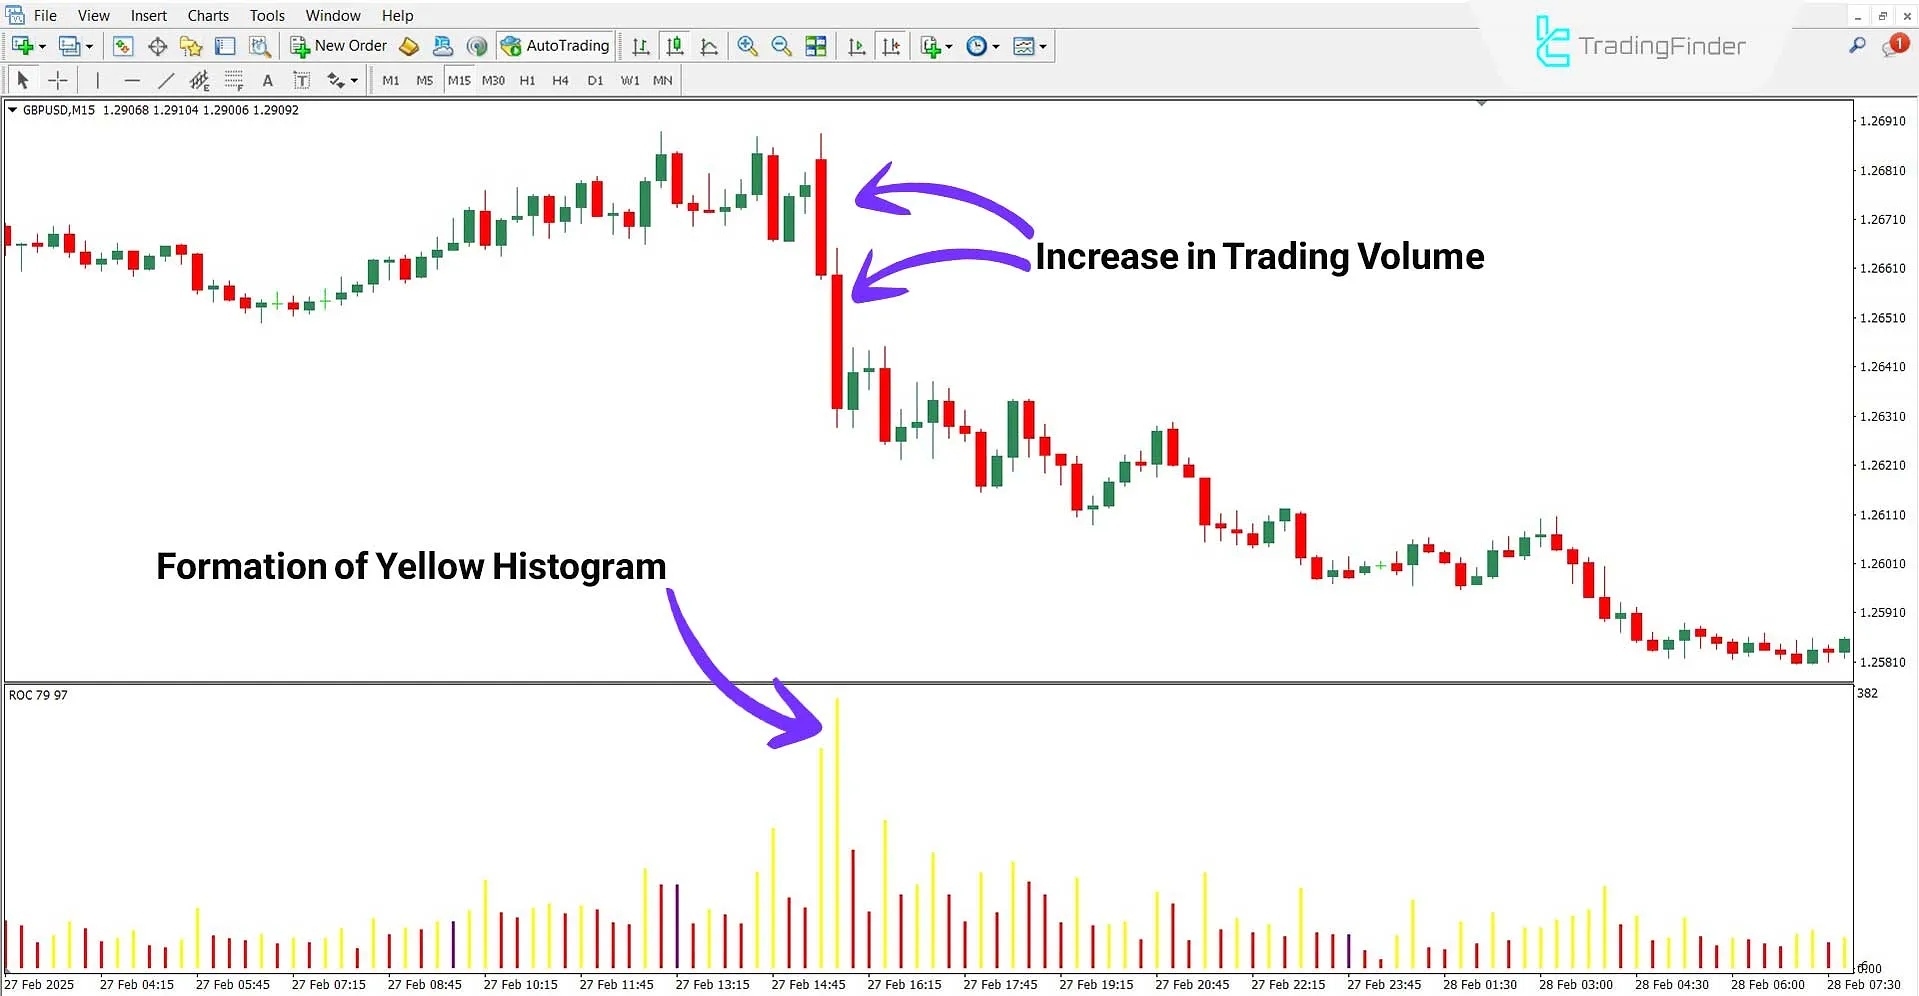
Based on the GBP/USD currency pair chart on a 15-minute timeframe, yellow histograms indicate increased volatility in a downtrend.
Conversely, histograms aligned with green candles are shown in pink, indicating weakness in the upward trend.

Conclusion
Unlike trend following indicators, the Candle Range Oscillator evaluates market volatility.
This indicator uses colored bars to show increases or decreases in trend volatility and simply plots an asset's average price movement range.
Range Candle MT4 PDF
Range Candle MT4 PDF
Click to download Range Candle MT4 PDFWhat is the "Range of Candle" Indicator?
This indicator calculates and displays the price range of a candle (the distance between the highest and lowest prices).
Which timeframe is suitable for the Candle Range Oscillator?
This indicator is multi-timeframe and can be used on all timeframes.


