![Range Volume Profile Indicator for MetaTrader 4 Download - [TradingFinder]](https://cdn.tradingfinder.com/image/243234/11-58-en-range-volume-profile-mt4-01.webp)
![Range Volume Profile Indicator for MetaTrader 4 Download - [TradingFinder] 0](https://cdn.tradingfinder.com/image/243234/11-58-en-range-volume-profile-mt4-01.webp)
![Range Volume Profile Indicator for MetaTrader 4 Download - [TradingFinder] 1](https://cdn.tradingfinder.com/image/243231/11-58-en-range-volume-profile-mt4-02.webp)
![Range Volume Profile Indicator for MetaTrader 4 Download - [TradingFinder] 2](https://cdn.tradingfinder.com/image/243232/11-58-en-range-volume-profile-mt4-03.webp)
![Range Volume Profile Indicator for MetaTrader 4 Download - [TradingFinder] 3](https://cdn.tradingfinder.com/image/243233/11-58-en-range-volume-profile-mt4-04.webp)
The Range Volume Profile Indicator is one of the MT4 Volume indicators, which displays the buy and sell volume within a specific price range as a histogram Technical analysis.
With customizable features, this indicator enables traders to conduct more detailed analysis of price ranges, helping them identify key liquidity points and important market levels.
Range Volume Profile Indicator Table
The following table contains the general specifications of the indicator.
Indicator Categories: | Volume MT4 Indicators Support & Resistance MT4 Indicators Supply & Demand MT4 Indicators |
Platforms: | MetaTrader 4 Indicators |
Trading Skills: | Elementary |
Indicator Types: | Range MT4 Indicators Lagging MT4 Indicators |
Timeframe: | Multi-Timeframe MT4 Indicators |
Trading Style: | Day Trading MT4 Indicators Intraday MT4 Indicators Scalper MT4 Indicators |
Trading Instruments: | Indices Market MT4 Indicators Stock Market MT4 Indicators Forex MT4 Indicators |
Indicator at a Glance
The Range Volume Profile Indicator is a practical tool for analyzing trading volume within a specific price range. This indicator, by displaying volume as a histogram, shows supply and demand zones to traders.
It also calculates and displays three key levels, including the Maximum Volume Line, the Median Line of volume distribution, and the Volume Weighted Average Price (VWAP), providing a better understanding of market structure and a valuable tool for traders.
Demand Zone and Bullish Trend
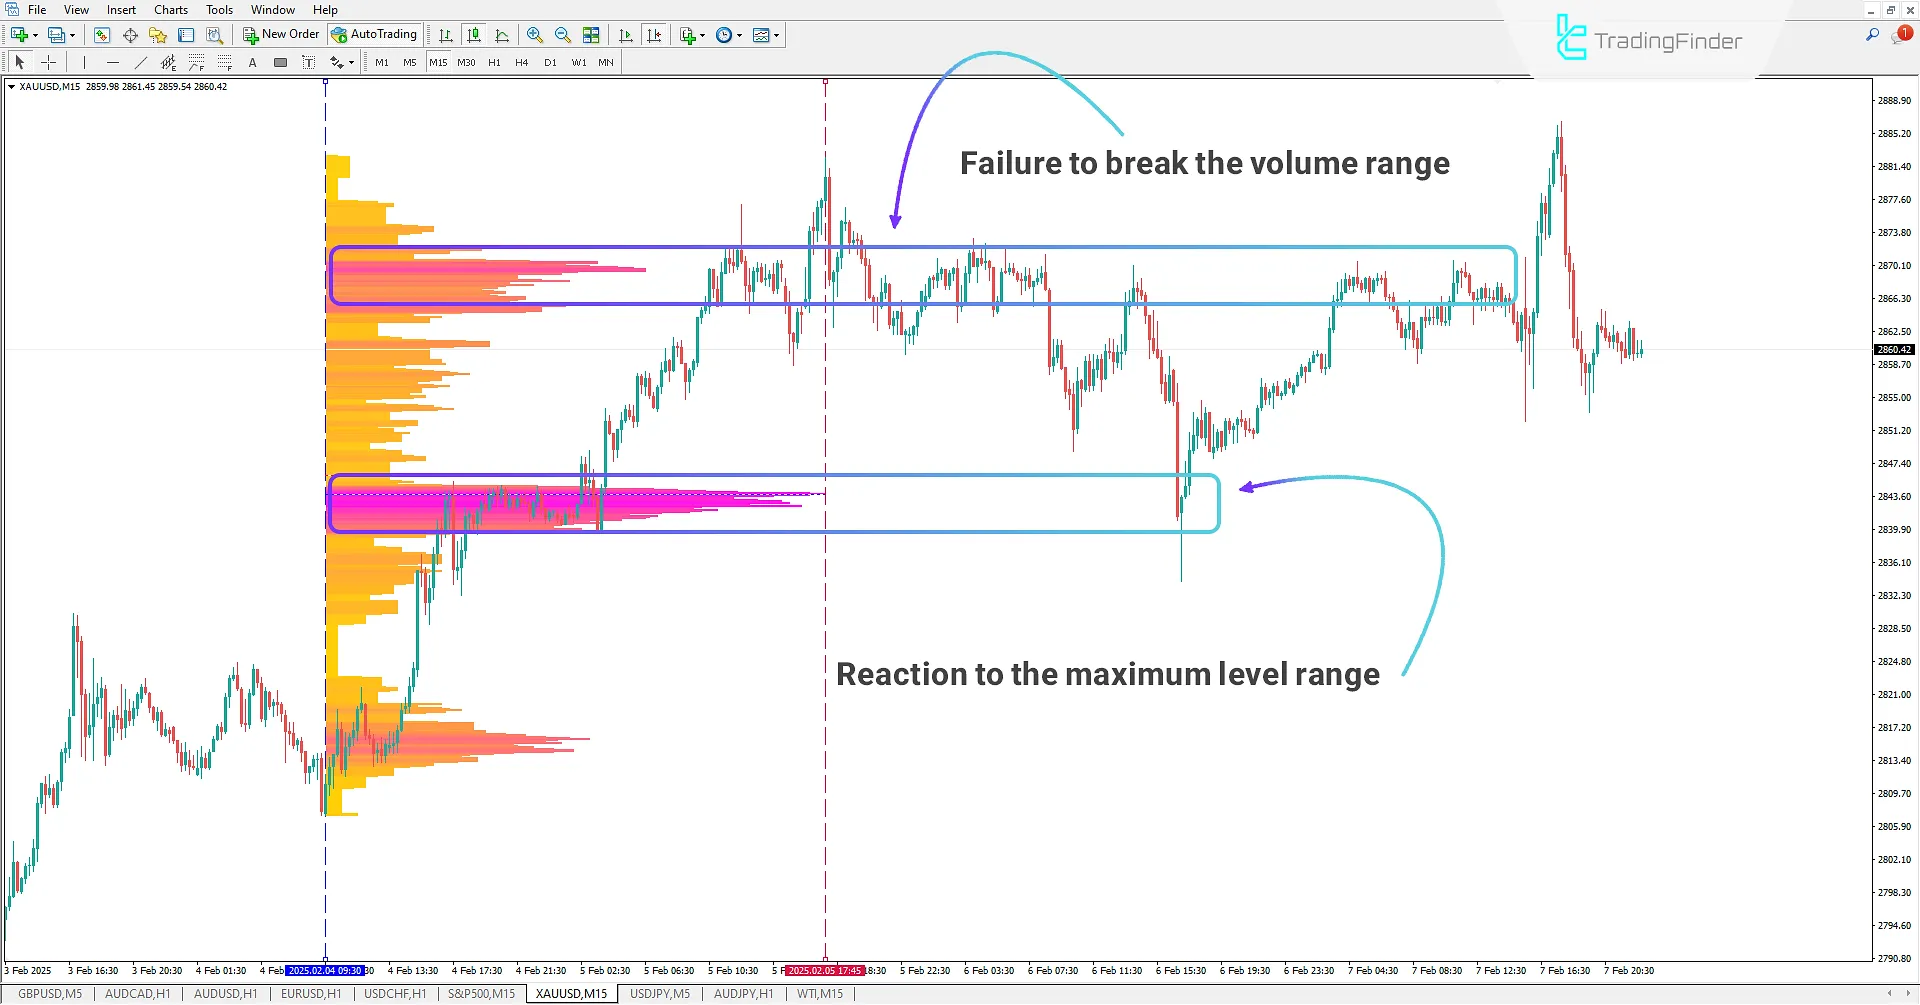
In the chart below, the Range Volume Profile Indicator uses two vertical lines, blue and red, to identify a bullish trend on the Gold symbol in the 15-minute timeframe.
This indicator displays the highest trading volume in the price range of the bullish trend as a histogram. After a price correction, a strong reaction is observed when the price reaches this range.
At the upper range, there is also a significant volume of buying and selling, and the price has attempted several times to break through this level but has moved downward due to the inability to break it.

Supply Zone and Downtrend
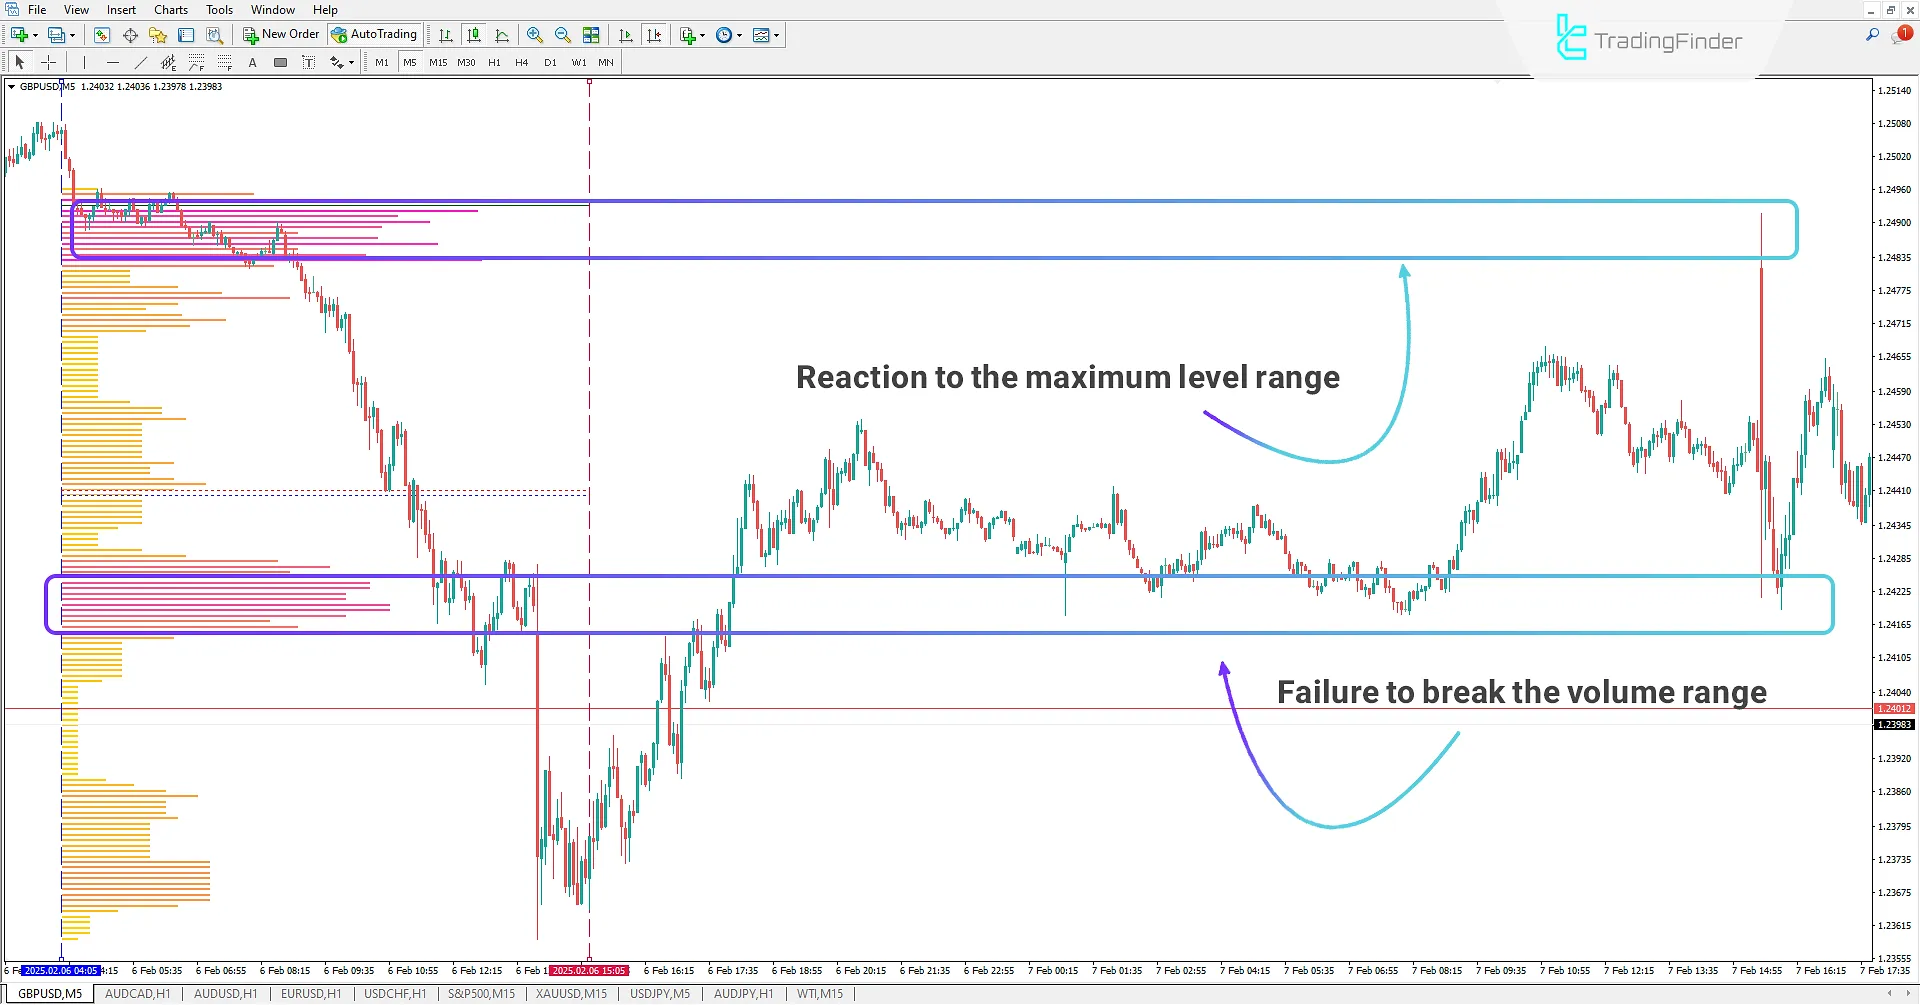
In the 5-minute chart of GBP/USD, the Range Volume Profile indicator uses two vertical lines to display the buy and sell volume during a downtrend.
This indicator is useful for traders looking to identify price ranges with the most significant supply and demand fluctuations, allowing them to conduct more specialized analyses with this tool.
Additionally, by showing the maximum trading volume (Maximum Line) during this downtrend, the probable price reaction zone is identified, where a strong reaction occurred after the price returned to this level.

Range Volume Profile Indicator Settings
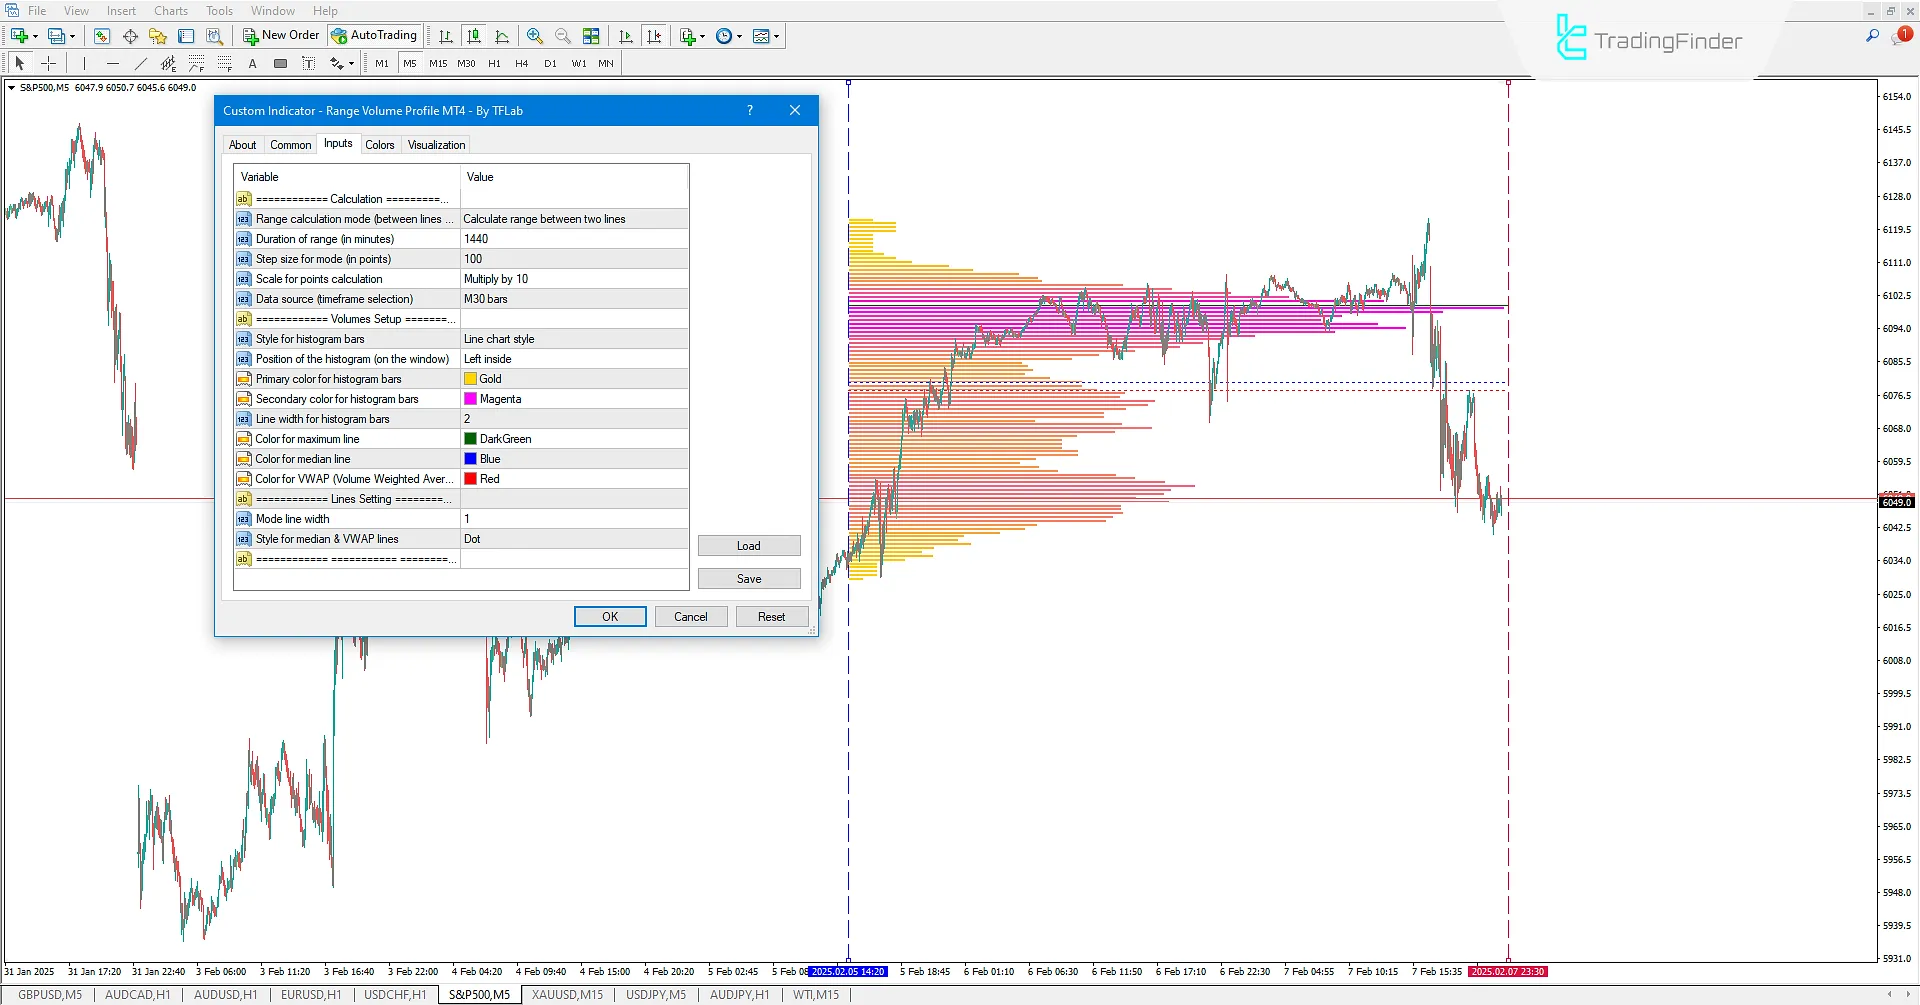
The settings for the indicator are located in the section below:

Calculation
- Range calculation mode (between lines or other): Settings for the range calculation mode, which has three calculation methods: calculation between two vertical lines, calculation based on the last candles, and fixed calculation between two vertical lines;
- Duration of range (in minutes): Settings for the third mode, which keeps the distance between two vertical lines fixed based on minutes and calculates it;
- Step size for mode (in points): Set the step size for each histogram bar based on points;
- Scale for points calculation: Set the scale for points calculation;
- Data source (timeframe selection): Settings for the data source based on the time frame.
Volumes Setup
- Style for histogram bars: Settings for the style of histogram bars;
- Position of the histogram (on the window): Select the position of the histogram on the chart window;
- Primary color for histogram bars: Set the primary color for histogram bars;
- Secondary color for histogram bars: Set the secondary color for histogram bars;
- Line width for histogram bars: Set the line width for histogram bars;
- Color for maximum line: Set the color for the maximum volume line;
- Color for median line: Set the color for the median line;
- Color for VWAP (Volume Weighted Average Price) Line: Set the color for the VWAP line.
Lines Setting
- Mode line width: Set the line width for VWAP;
- Style for median & VWAP line: Set the style for drawing the VWAP line.
Conclusion
The Range Volume Profile indicator is a histogram that displays trading volume within a specific price range. This tool is one of the Supply and demand, and it is useful for traders looking to identify price reaction zones.
Additionally, by using the price histogram, support and resistance areas can be determined on the chart.
Range Volume Profile MT4 PDF
Range Volume Profile MT4 PDF
Click to download Range Volume Profile MT4 PDFWhat is the Range Volume Profile Indicator?
The Range Volume Profile indicator is one of the volume trading tools in MetaTrader 4, displaying the buy and sell volume within a specific price range as a histogram. This indicator allows traders to identify important liquidity points and key market levels.
What information does the Range Volume Profile Indicator display?
This indicator shows the trading volume within a specific price range and calculates and displays three key levels: the highest trading volume, the median distribution line of trading volume, and the Volume Weighted Average Price (VWAP).
I asked in Telegram ID of Tflab some interesting options to add this indicator.also send my 700 line code to them. But the team refused my idea. BTW, may I ask to add Value are high/low to this indicator? That help a lot. Thanks
Thank you for your thoughtful feedback. We appreciate your suggestion, and we’ll certainly take it into consideration for future updates.
Hi, thank you very much for this amazing indicator. It improves my edge a lot and I have idea to make it even more better by adding option to draw this chart for buyers AND sellers so we can have two charts on top of each others and see who was stronger. What do you think?
Hello, thank you for your feedback. Please get in touch with our support team.


