![RAVI Indicator for MetaTrader 4 – [TFlab] – Free Download](https://cdn.tradingfinder.com/image/450134/2-97-en-ravi-mt4-1.webp)
![RAVI Indicator for MetaTrader 4 – [TFlab] – Free Download 0](https://cdn.tradingfinder.com/image/450134/2-97-en-ravi-mt4-1.webp)
![RAVI Indicator for MetaTrader 4 – [TFlab] – Free Download 1](https://cdn.tradingfinder.com/image/450133/2-97-en-ravi-mt4-2.webp)
![RAVI Indicator for MetaTrader 4 – [TFlab] – Free Download 2](https://cdn.tradingfinder.com/image/450136/2-97-en-ravi-mt4-3.webp)
![RAVI Indicator for MetaTrader 4 – [TFlab] – Free Download 3](https://cdn.tradingfinder.com/image/450138/2-97-en-ravi-mt4-4.webp)
The RAVI indicator is one of the trend analysis tools available on the MetaTrader 4 platform, whose primary function is to detect structural changes in the market.
This oscillator operates based on the relative difference between two Simple Moving Averages (SMA) of different periods, calculated as a percentage relative to price.
RAVI Indicator Table
The general specifications of the Range Action Verification Index (RAVI) indicator are presented in the table below.
Indicator Categories: | Oscillators MT4 Indicators Currency Strength MT4 Indicators Trading Assist MT4 Indicators |
Platforms: | MetaTrader 4 Indicators |
Trading Skills: | Intermediate |
Indicator Types: | Reversal MT4 Indicators |
Timeframe: | Multi-Timeframe MT4 Indicators |
Trading Style: | Intraday MT4 Indicators |
Trading Instruments: | Stock Market MT4 Indicators Cryptocurrency MT4 Indicators Forex MT4 Indicators |
RAVI at a Glance
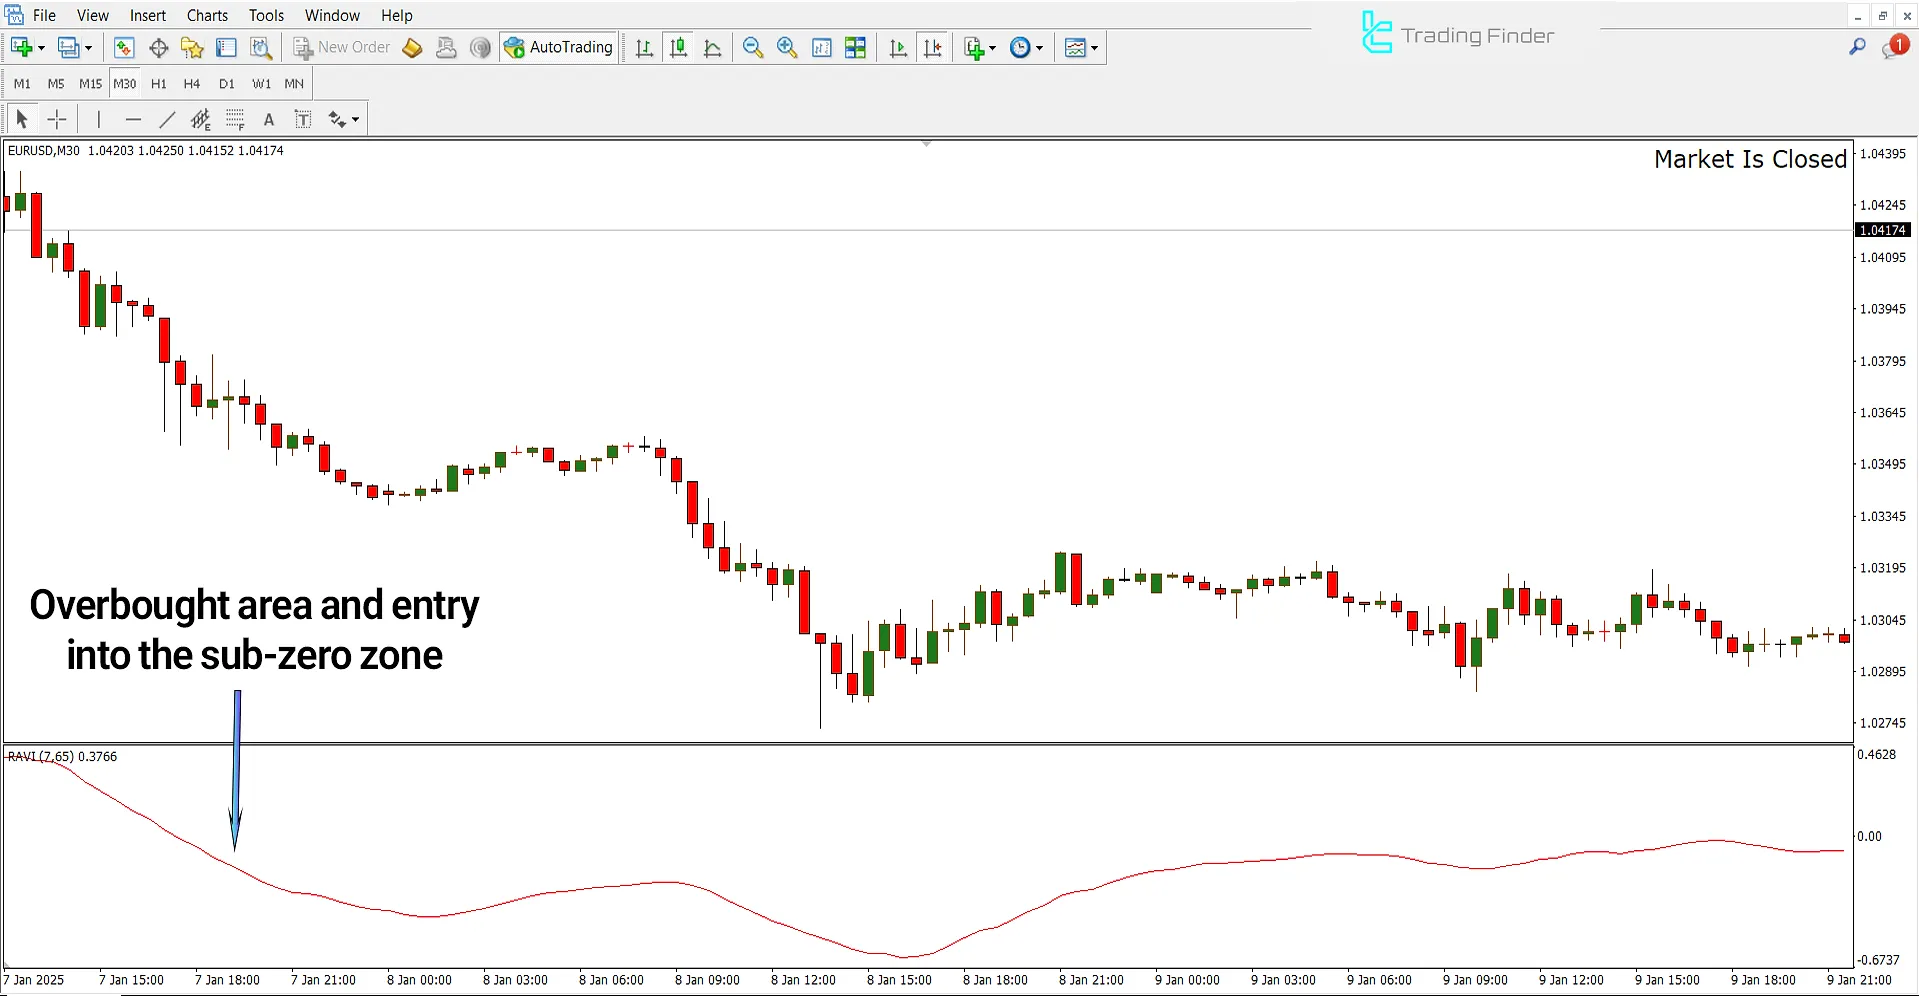
The Range Action Verification Index (RAVI) is plotted as a waveform line oscillating around the zero axis. This line reflects the strength and direction of market trends, and its crossover through the zero level signals a phase shift in the market from bullish to bearish or vice versa.
RAVI in a Bullish Trend
In a 30-minute chart of the EUR/USD currency pair, when the RAVI signal line crosses the zero level from below to above, this signals the start of a new uptrend or strengthening of an existing bullish trend.
In such cases, if the price also breaks a resistance level or reversal patterns are observed in Price Action structures, this confirms the signal generated by the RAVI oscillator.

RAVI in a Bearish Trend
The chart below displays the gold spot price index (XAU/USD) in a 1-minute timeframe.
When the RAVI signal line crosses from above to below the zero line, it indicates the end of a bullish trend and the beginning of a downtrend.

RAVI Indicator Settings
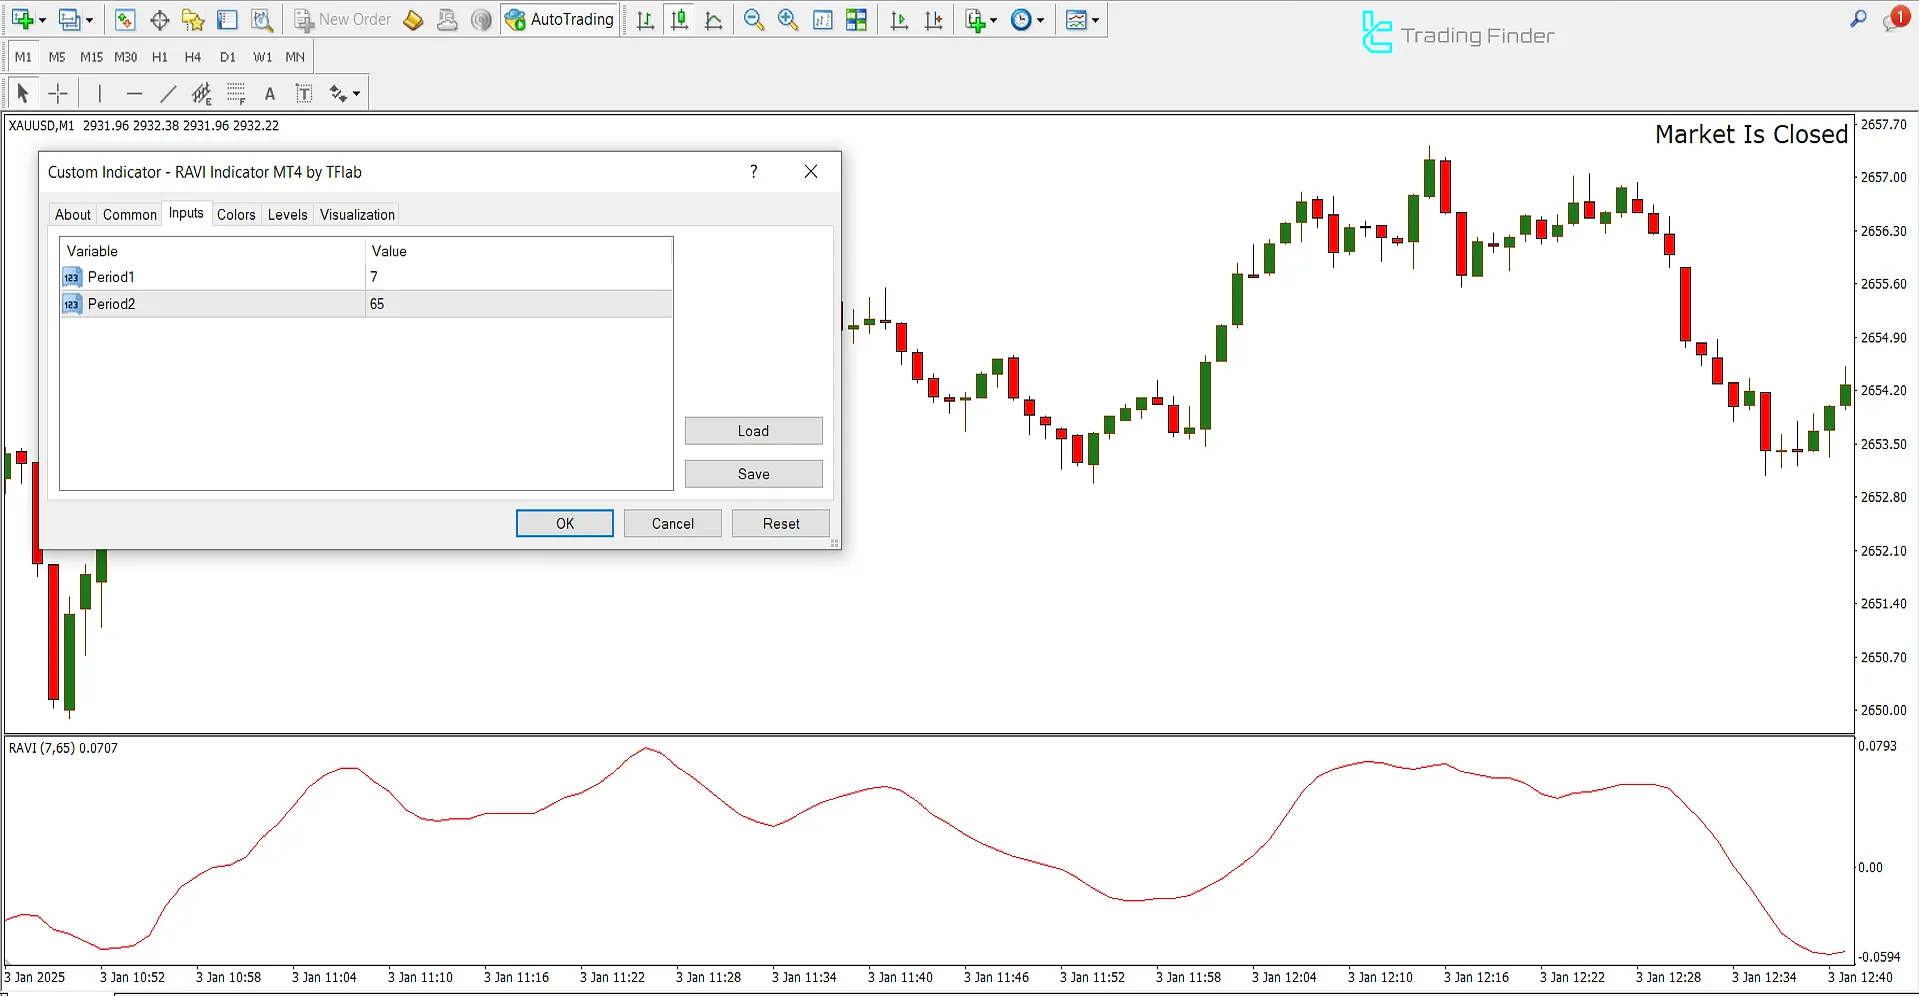
The RAVI Indicator Settings Panel (Range Action Verification Index) is shown in the image below:

- Period1: First Period
- Period2: Second Period
Conclusion
The RAVI Indicator is a tool for identifying market trends, detecting new movement phases, and providing warnings in overbought or oversold zones.
The highest accuracy and effectiveness of the RAVI indicator is achieved when it is used as a confirmatory tool in combination with Price Action analysis and other technical indicators such as RSI Indicator, MACD, or Exponential Moving Averages (EMA).
RAVI MT4 PDF
RAVI MT4 PDF
Click to download RAVI MT4 PDFCan the RAVI indicator be used in multiple timeframes?
Yes; this trading tool is suitable for multi-timeframe strategies.
What is the function of the zero line in the RAVI indicator?
The zero line acts as a threshold separating bullish and bearish phases; when the signal line crosses it upward or downward, it signals a potential trend reversal.


