![Rejection Block + Void Indicator for MT4 Download - Free - [TradingFinder]](https://cdn.tradingfinder.com/image/112782/4-2-en-rejection-block-mt4-1.webp)
![Rejection Block + Void Indicator for MT4 Download - Free - [TradingFinder] 0](https://cdn.tradingfinder.com/image/112782/4-2-en-rejection-block-mt4-1.webp)
![Rejection Block + Void Indicator for MT4 Download - Free - [TradingFinder] 1](https://cdn.tradingfinder.com/image/112771/4-2-en-rejection-block-mt4-2.webp)
![Rejection Block + Void Indicator for MT4 Download - Free - [TradingFinder] 2](https://cdn.tradingfinder.com/image/112749/4-2-en-rejection-block-mt4-3.webp)
![Rejection Block + Void Indicator for MT4 Download - Free - [TradingFinder] 3](https://cdn.tradingfinder.com/image/112752/4-2-en-rejection-block-mt4-4.webp)
The Rejection Block Indicator is a practical and effective tool for identifying market reversal points among MetaTrader 4 indicators. This tool automatically detects areas where the price rejects and reverses.
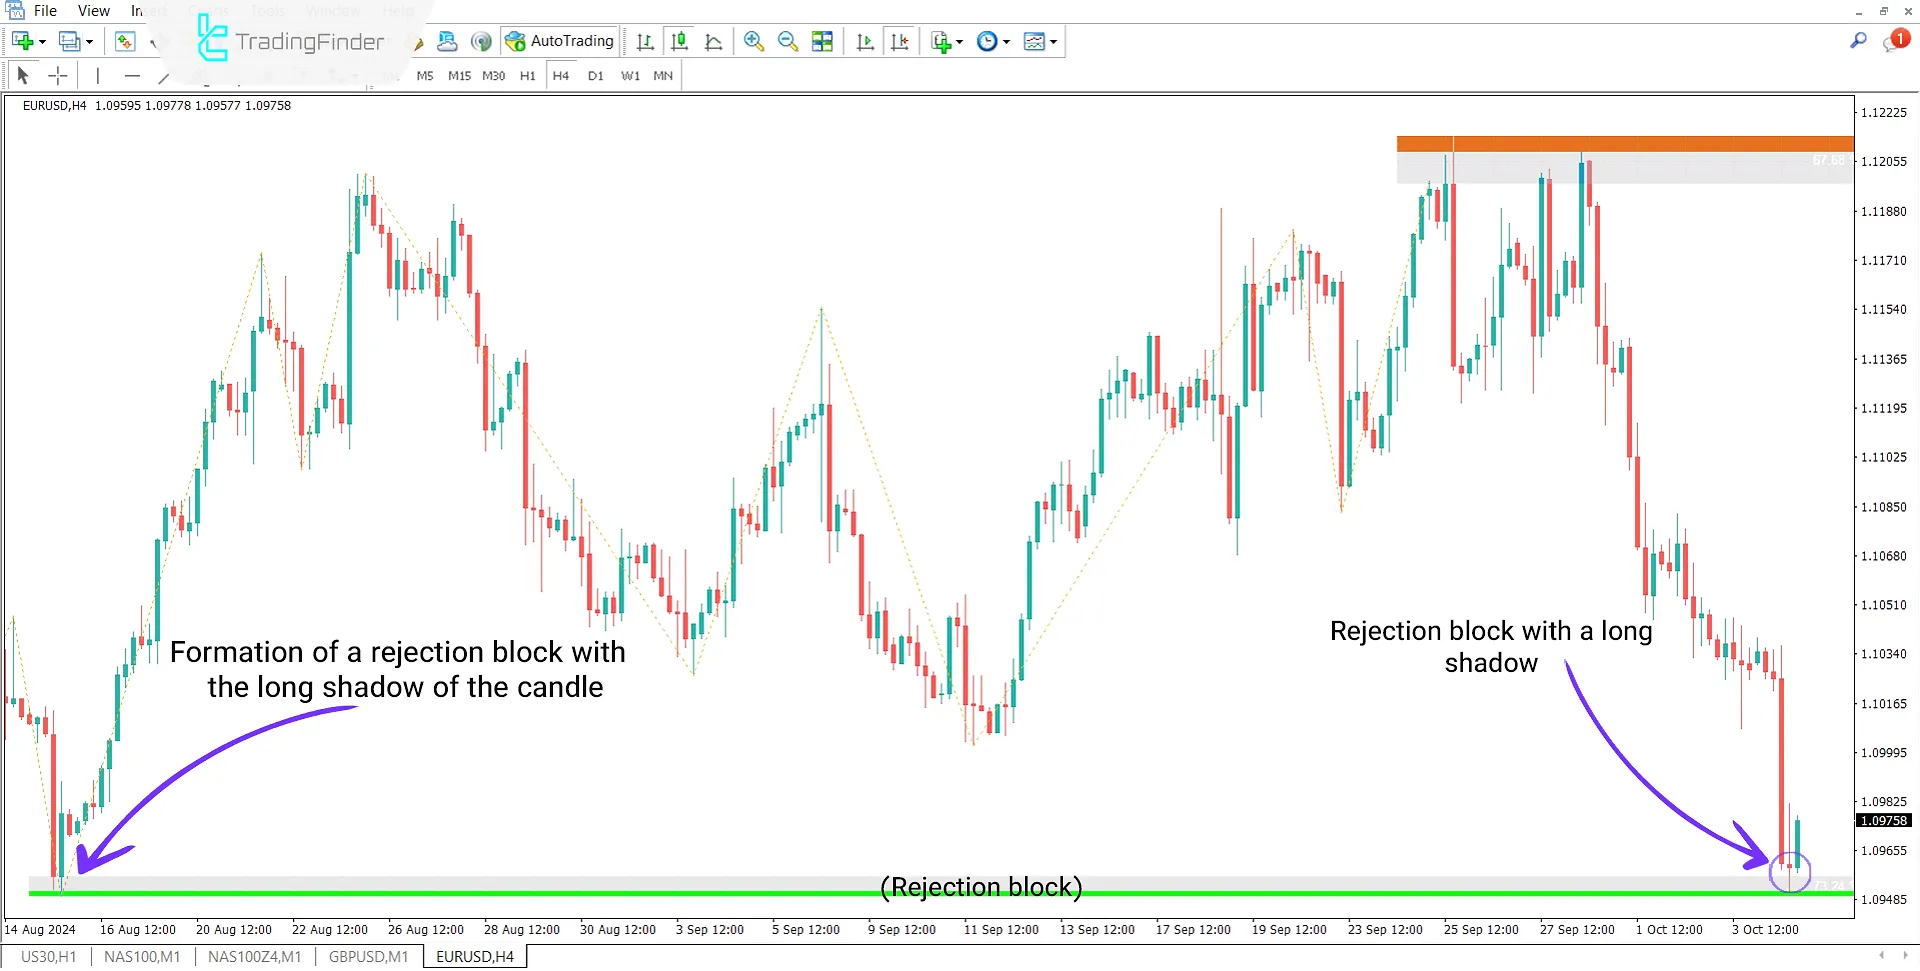
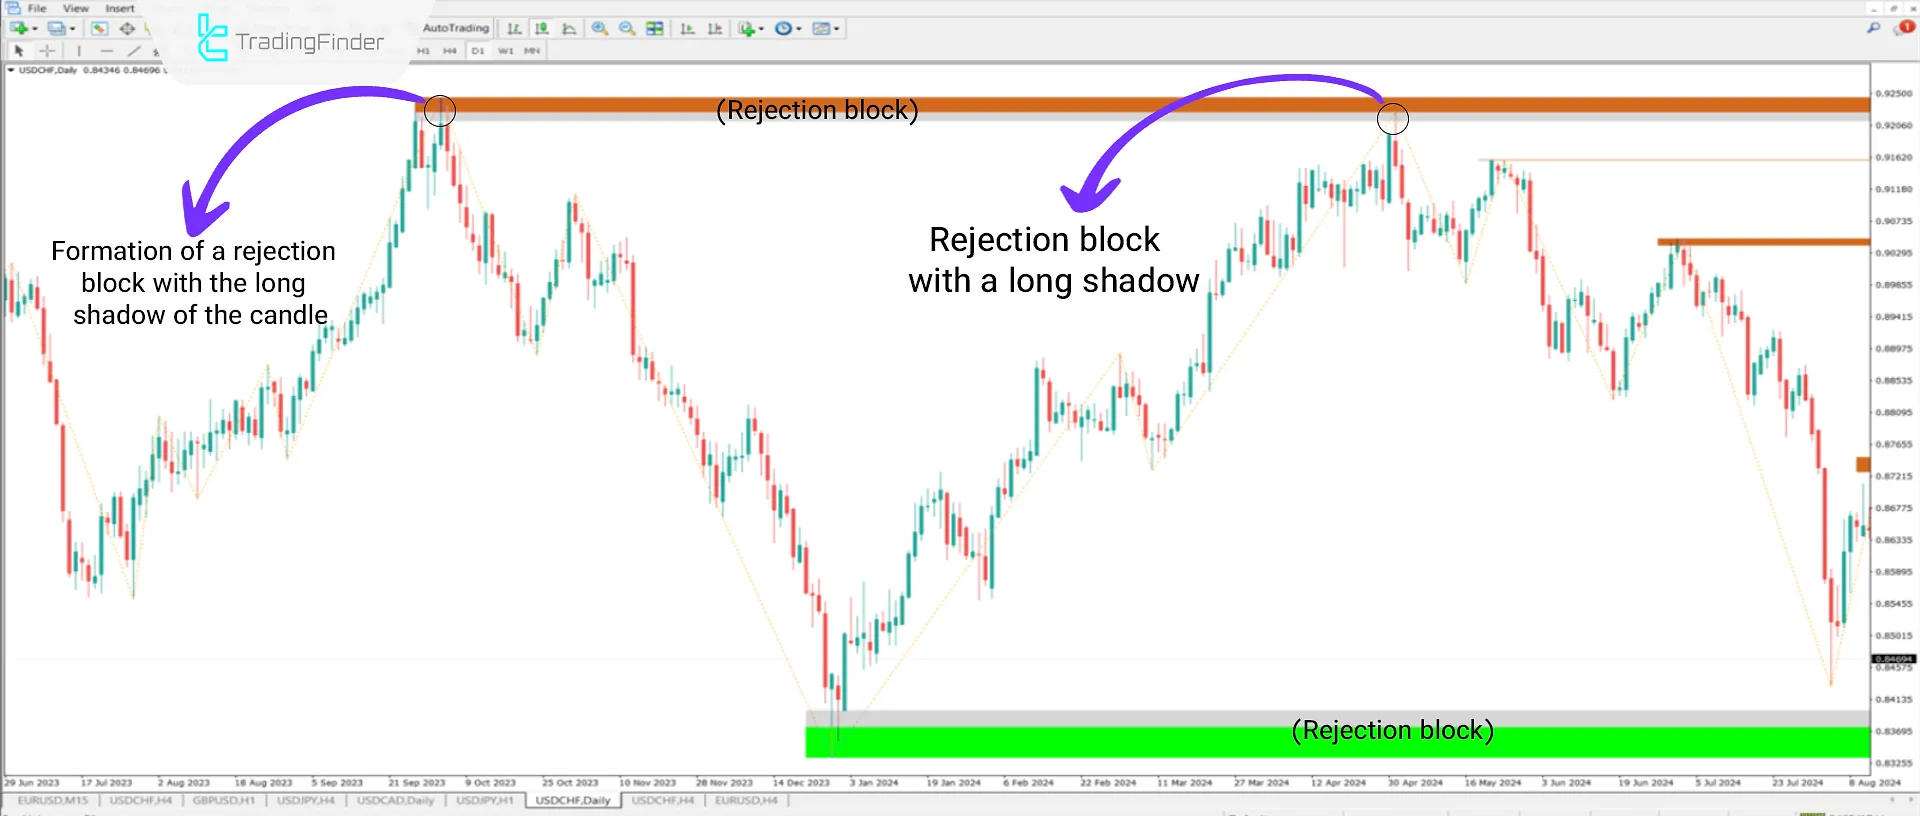
The rejection block operates based on candle shadows; a long shadow near the price peak and a short shadow near the price low are considered market reversal or turning points.
Using this indicator, rejection blocks are automatically drawn on the chart. Bullish rejections are shown in green, and bearish rejections are displayed in red.
Indicator Specifications Table
Indicator Categories: | ICT MT4 Indicators Smart Money MT4 Indicators Liquidity MT4 Indicators |
Platforms: | MetaTrader 4 Indicators |
Trading Skills: | Intermediate |
Indicator Types: | Reversal MT4 Indicators |
Timeframe: | Multi-Timeframe MT4 Indicators |
Trading Style: | Intraday MT4 Indicators |
Trading Instruments: | Share Stocks MT4 Indicators Forward Market MT4 Indicators Commodity Market MT4 Indicators Cryptocurrency MT4 Indicators Forex MT4 Indicators |
Indicator Overview
The Rejection Block Indicator identifies reversal areas in financial markets; these areas have a high potential for price reversal, with the price often returning to these levels for completion.
Traders using the ICT style employ this indicator to locate rejection block areas. The Void of rejection blocks is displayed in gray; once fully consumed, it indicates the invalidation of that level.
Rejection Block Indicator in a Bullish Trend
The EUR/USD 4-hour price chart demonstrates the indicator's behavior in an uptrend. Here, the price encounters a bullish rejection block during a downward correction, creating an optimal entry point for a Buy trade.

Rejection Block Indicator in a Bearish Trend
The USD/CHF 4-hour chart shows the indicator's functionality in an uptrend. This chart raises the price of encountering a bearish rejection block, providing a sell opportunity for traders.

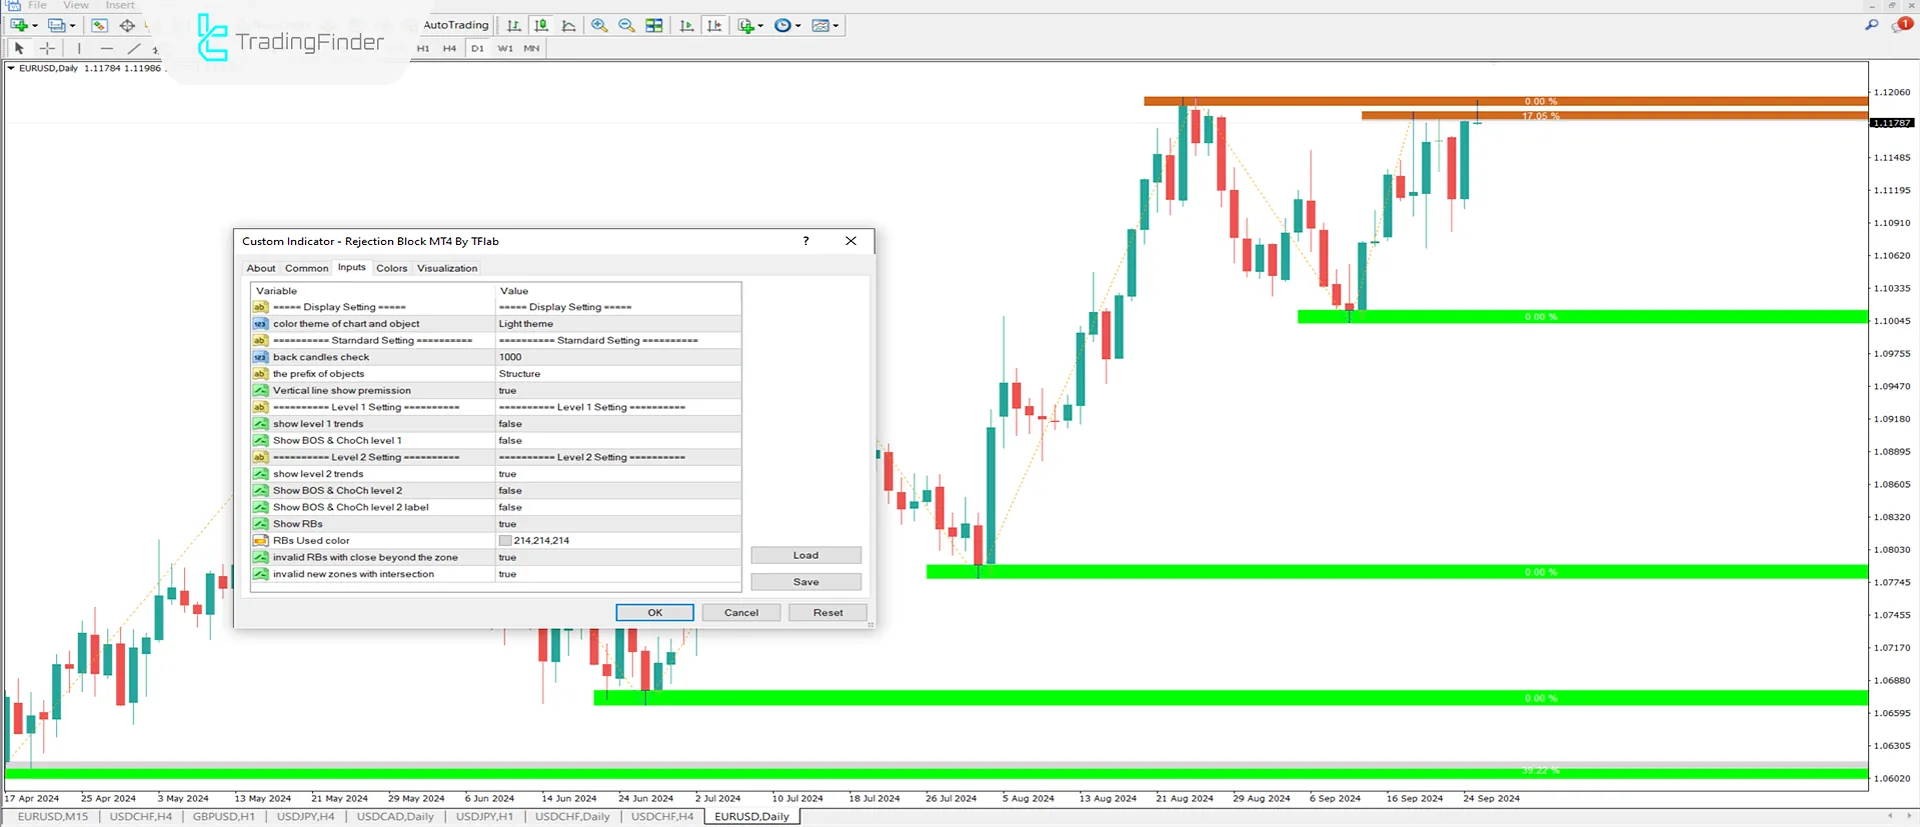
Indicator Settings

- Display setting: Screen display settings;
- Color theme of chart and object: Chart background color;
- Standard setting: Standard settings;
- Back candles check: Review previous candles;
- The prefix of objects: Object prefix;
- Vertical line show permission: Vertical separator line on the chart;
- Show Level 1 trends: Display Level 1 trends;
- Show BOS & ChoCh level 2: Show BOS and ChoCH Level 2;
- Show BOS & ChoCh level 2 label: Display BOS and ChoCH Level 2 label;
- Show RBs: Display Rejection Blocks;
- RBs used color: Color used for Rejection Blocks;
- Invalid Rbs with close beyond the zone: Invalid Rejection Blocks with zone closure;
- Invalid new zones with intersection: Invalid new zones with intersections.
Conclusion
The Rejection Block Indicator is a powerful tool for identifying key market reversal points. It helps traders easily identify price reversal areas that act as support and resistance, aiding them in making informed trading decisions.
This indicator is particularly well-suited for ICT trading styles. By using this tool, traders can accurately pinpoint entry and exit points, thus reducing trading risks.
Rejection Block Void MT4 PDF
Rejection Block Void MT4 PDF
Click to download Rejection Block Void MT4 PDFWhat is the Rejection Block Indicator, and how does it work?
The Rejection Block Indicator is a tool for identifying key market reversal points marking resistance and support zones based on candle shadows near price peaks and lows.
Which trading styles use the Rejection Block Indicator?
The Rejection Block Indicator is commonly used in various price action-based trading styles, including ICT and Smart Money.


