![Renko Chart Line Indicator for MT4 Download – Free – [TradingFinder]](https://cdn.tradingfinder.com/image/394295/13-127-en-renko-chart-line-mt4-01.webp)
![Renko Chart Line Indicator for MT4 Download – Free – [TradingFinder] 0](https://cdn.tradingfinder.com/image/394295/13-127-en-renko-chart-line-mt4-01.webp)
![Renko Chart Line Indicator for MT4 Download – Free – [TradingFinder] 1](https://cdn.tradingfinder.com/image/394296/13-127-en-renko-chart-line-mt4-02.webp)
![Renko Chart Line Indicator for MT4 Download – Free – [TradingFinder] 2](https://cdn.tradingfinder.com/image/394299/13-127-en-renko-chart-line-mt4-03.webp)
![Renko Chart Line Indicator for MT4 Download – Free – [TradingFinder] 3](https://cdn.tradingfinder.com/image/394298/13-127-en-renko-chart-line-mt4-04.webp)
The Renko Chart Line Indicator is designed to display distinct price changes. This trading tool filters out price noise and uses diagonal lines to visualize market trends in Renko style on the chart.
Pink lines represent bullishtrends, while blue lines indicate bearishmovements.
Renko Chart Line Indicator Specifications Table
The table below outlines the specifications of the Renko Chart Line Indicator.
Indicator Categories: | Price Action MT4 Indicators Volatility MT4 Indicators Trading Assist Tradingview Indicators |
Platforms: | MetaTrader 4 Indicators |
Trading Skills: | Elementary |
Indicator Types: | Reversal MT4 Indicators |
Timeframe: | Multi-Timeframe MT4 Indicators |
Trading Style: | Day Trading MT4 Indicators Scalper MT4 Indicators Swing Trading MT4 Indicators |
Trading Instruments: | Forward Market MT4 Indicators Stock Market MT4 Indicators Cryptocurrency MT4 Indicators Forex MT4 Indicators |
Renko Profile at a Glance
In the Renko Line Chart Indicator, shorter, more compact lines indicate neutral fluctuations or ranging zones. These areas often act as potential support and resistance levels.
The sequential formation of these lines in a particular direction also signals a change in price direction and the start of a new trend.
Bullish Trend Conditions
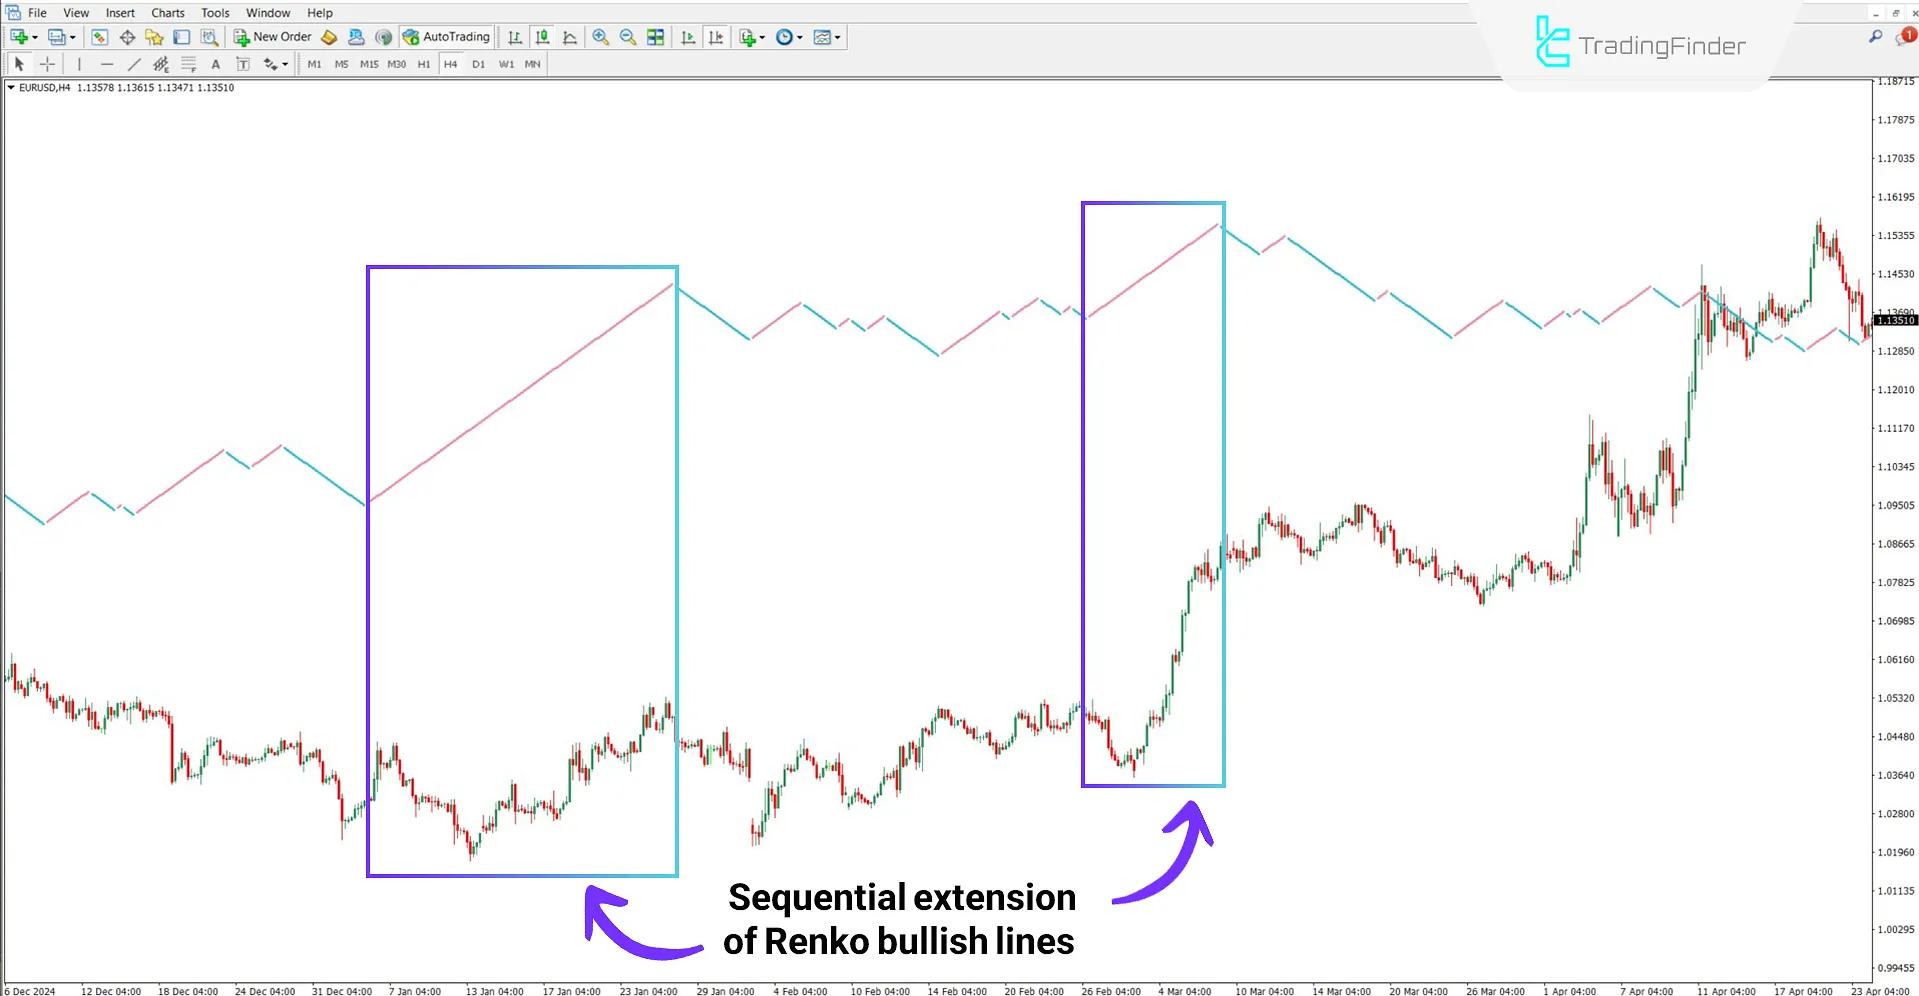
According to the EUR/USD chart on the 4-hour timeframe, bullish Renko lines (in pink) have continued over several periods.
The chart below shows that price pullbacks are minor and temporary, confirming buyer strength and buying pressure.

Bearish Trend Conditions
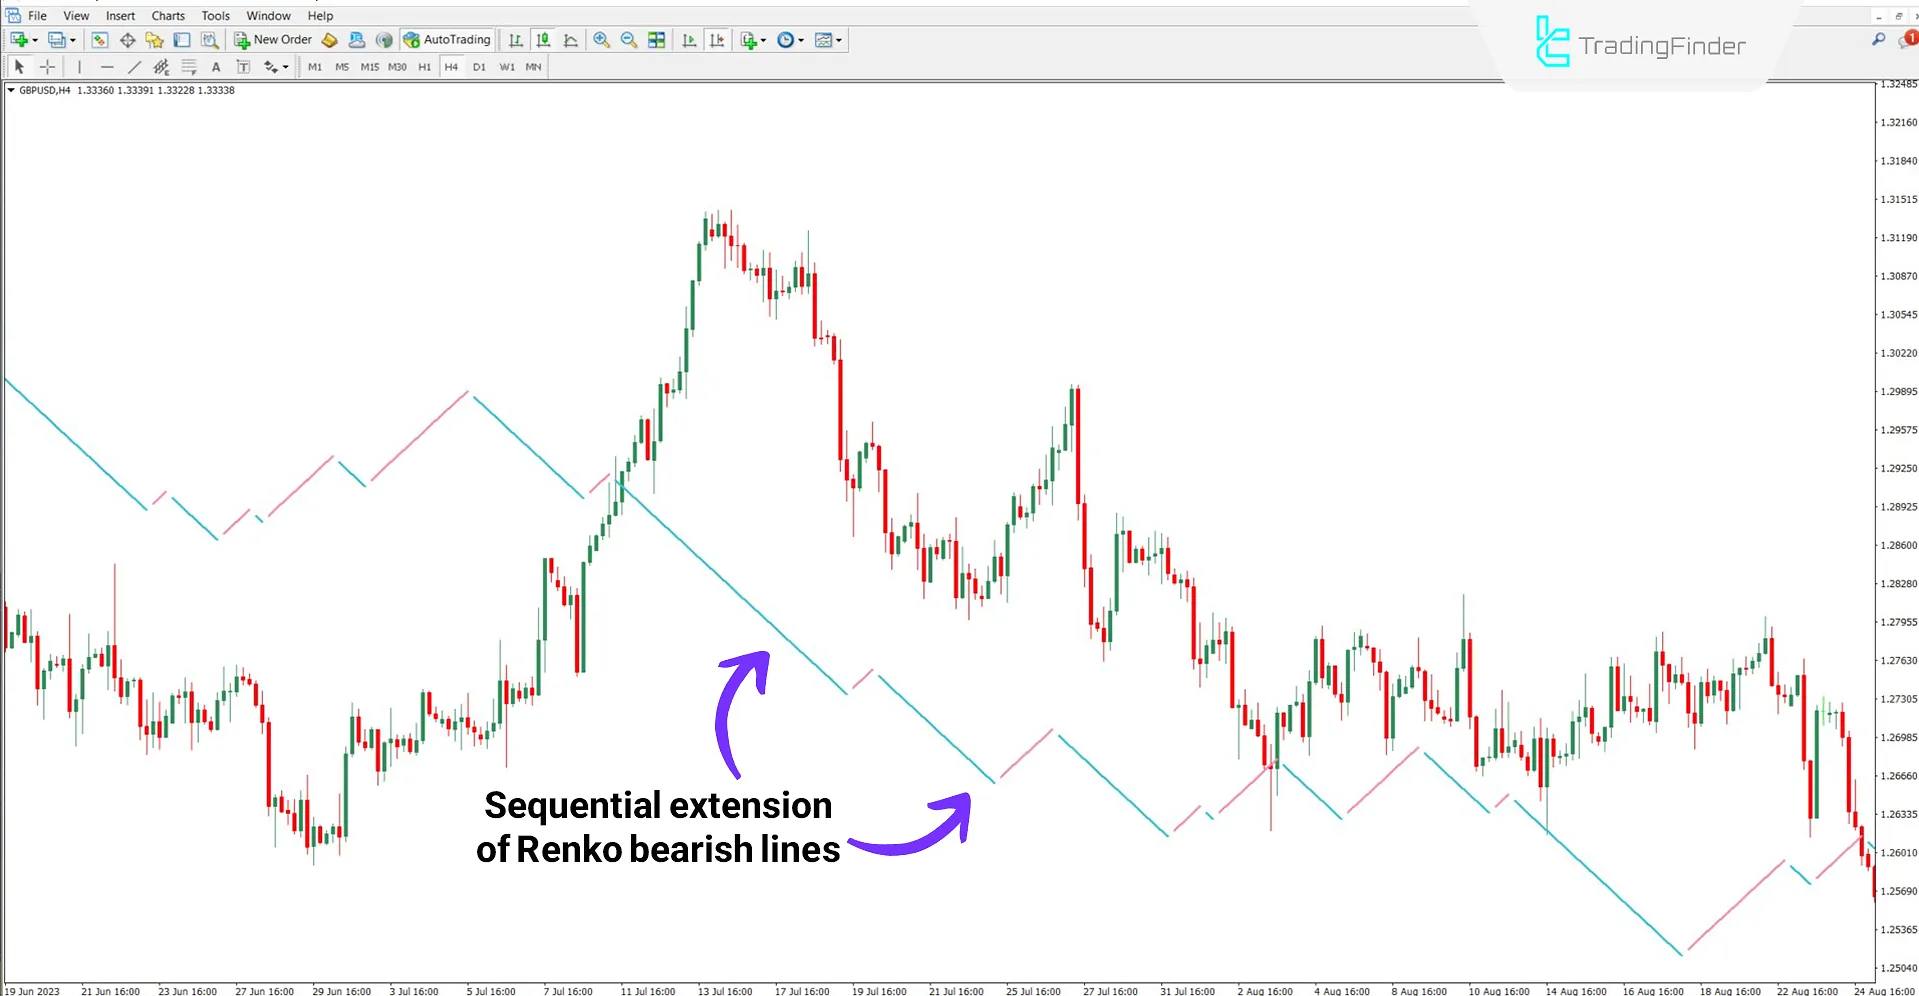
Based on the GBP/USD chart on the 4-hour timeframe, the sequential extension of blue lines over multiple sessions indicates a strong and persistent downtrend in the market.
The uninterrupted bearish structure of the Renko chart confirms seller dominance and trend continuation.

Renko Chart Line Indicator Settings
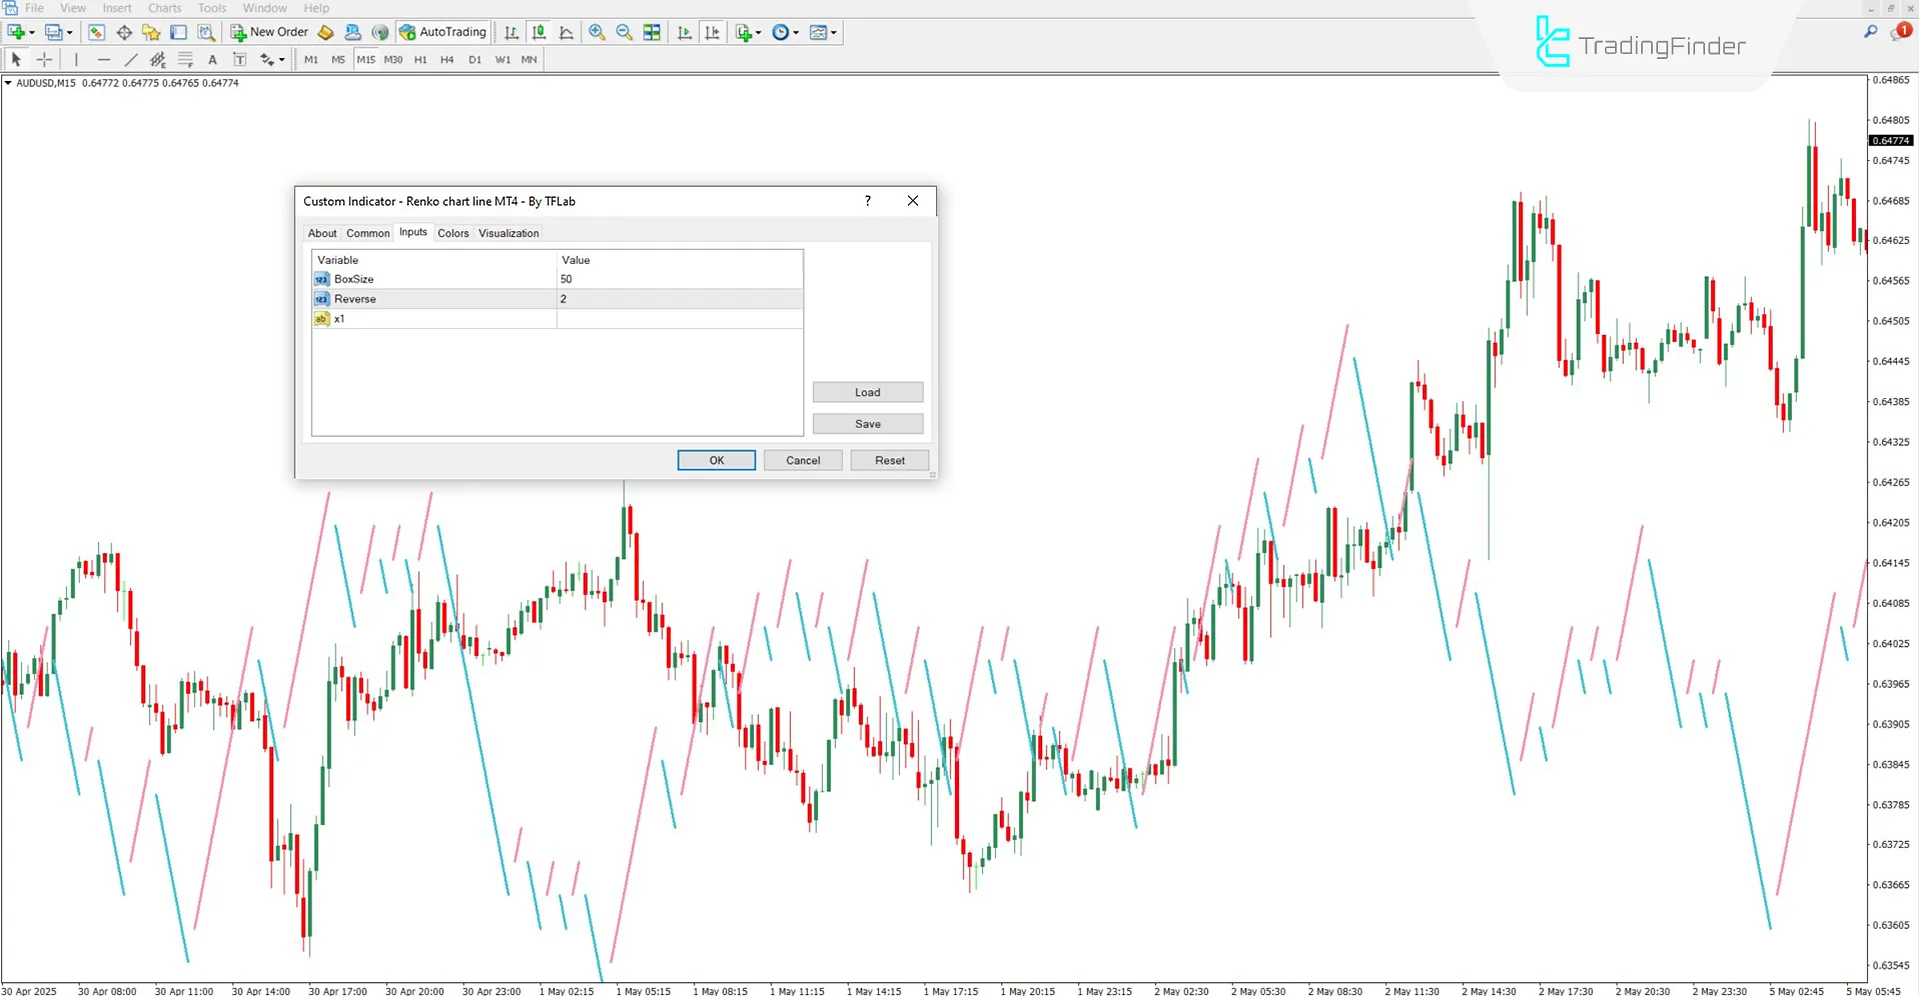
The image below shows the settings panel for the Renko Line Chart Indicator:

- Box Size: Defines the unit size for Renko bricks
- Reverse: Sets the reversal calculation logic
Conclusion
The Renko Chart Line Indicator uses diagonal lines to simply and clearly define bullish or bearish trends.
Unlike traditional candlesticks plotted on fixed timeframes, this tool responds only to price movements of a specified amount (in pips or points).
It also proves useful in the precise identification of support and resistance levels.
Renko Chart Line MT4 PDF
Renko Chart Line MT4 PDF
Click to download Renko Chart Line MT4 PDFIs this indicator only suitable for Forex currency pairs?
No, this indicator is suitable and functional for use across all markets.
Does the Renko Line Chart Indicator provide trade signals?
No, this tool does not generate any trade signals.


