![Road Map V04 Indicator in MetaTrader 4 – Free Download [TradingFinder]](https://cdn.tradingfinder.com/image/498623/2-123-en-road-map-v04-mt4-1.webp)
![Road Map V04 Indicator in MetaTrader 4 – Free Download [TradingFinder] 0](https://cdn.tradingfinder.com/image/498623/2-123-en-road-map-v04-mt4-1.webp)
![Road Map V04 Indicator in MetaTrader 4 – Free Download [TradingFinder] 1](https://cdn.tradingfinder.com/image/498630/2-123-en-road-map-v04-mt4-2.webp)
![Road Map V04 Indicator in MetaTrader 4 – Free Download [TradingFinder] 2](https://cdn.tradingfinder.com/image/498628/2-123-en-road-map-v04-mt4-3.webp)
![Road Map V04 Indicator in MetaTrader 4 – Free Download [TradingFinder] 3](https://cdn.tradingfinder.com/image/498624/2-123-en-road-map-v04-mt4-4.webp)
The Road Map V04 Indicator, by providing a structured visual framework for analyzing and forecasting price behavior, is one of the advanced tools of technical analysis.
This indicator focuses explicitly on the wave structure of price, combining elements such as market trend, key retracement zones, and Fibonacci levels to create optimal areas for entering buy and sell trades.
Road Map V04 Indicator Table
The table below presents the general features of the Road Map V04 Indicator.
Indicator Categories: | Signal & Forecast MT4 Indicators Trading Assist MT4 Indicators Levels MT4 Indicators |
Platforms: | MetaTrader 4 Indicators |
Trading Skills: | Intermediate |
Indicator Types: | Reversal MT4 Indicators |
Timeframe: | Multi-Timeframe MT4 Indicators |
Trading Style: | Intraday MT4 Indicators |
Trading Instruments: | Stock Market MT4 Indicators Cryptocurrency MT4 Indicators Forex MT4 Indicators |
Road Map V04 Indicator Overview
The Road Map V04 Indicator automatically draws bullish and bearish waves, presenting the price movement structure clearly and accurately:
- Blue lines indicate buyer strength and the formation of a bullish trend
- Purple lines indicate seller dominance and downward market movement
This wave structure visually identifies pivot points and trend change zones. Fibonacci retracement levels are shown as horizontal orange lines and serve as necessary support and resistance levels.
Suggested buy and sell entry zones are also highlighted with blue and red lines, respectively.
Indicator in Bullish Trend
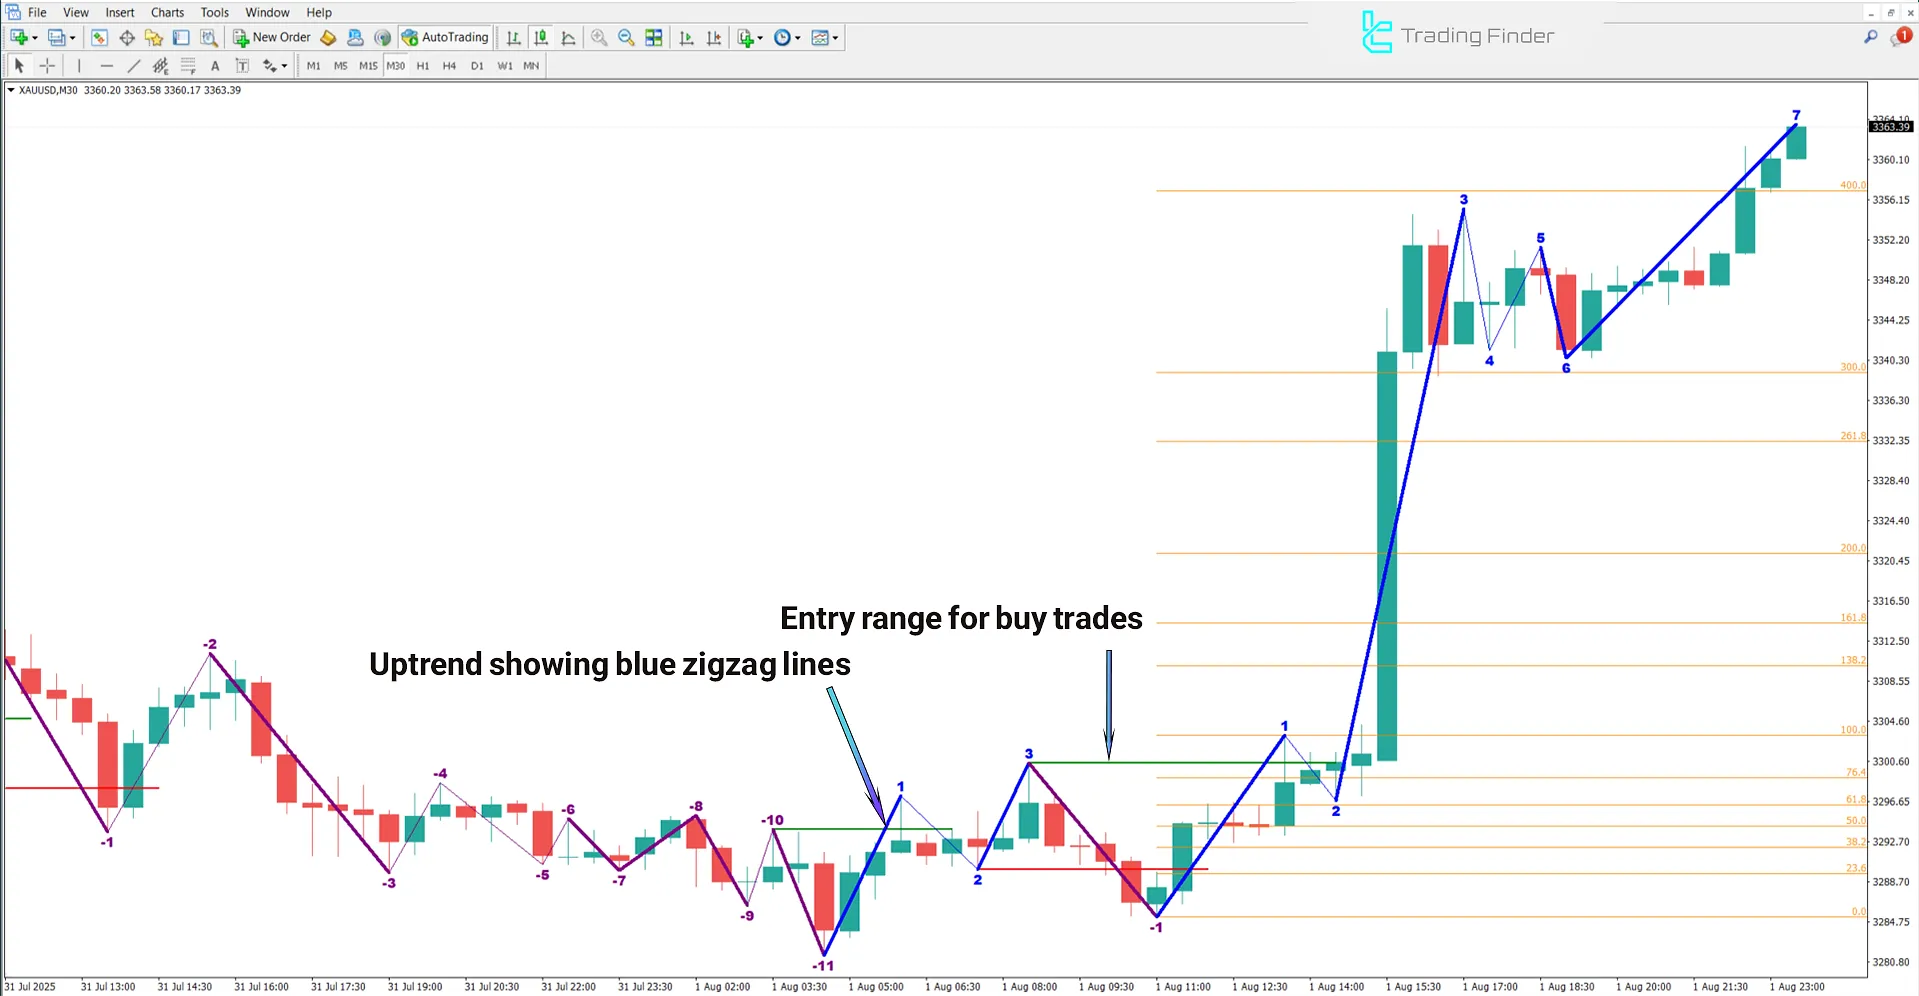
The chart below displays the Gold Spot Price (XAU/USD) on a 30-minute timeframe. In the bullish scenario, the formation of an upward-sloping wave with a continuous blue zigzag line marks the start of an uptrend.
At the same time, the appearance of a green line near key Fibonacci levels such as 76.4% strengthens the probability of continued upward movement. Additionally, the gradual rise of swing highs and lows confirms the bullish market structure.

Indicator in Bearish Trend
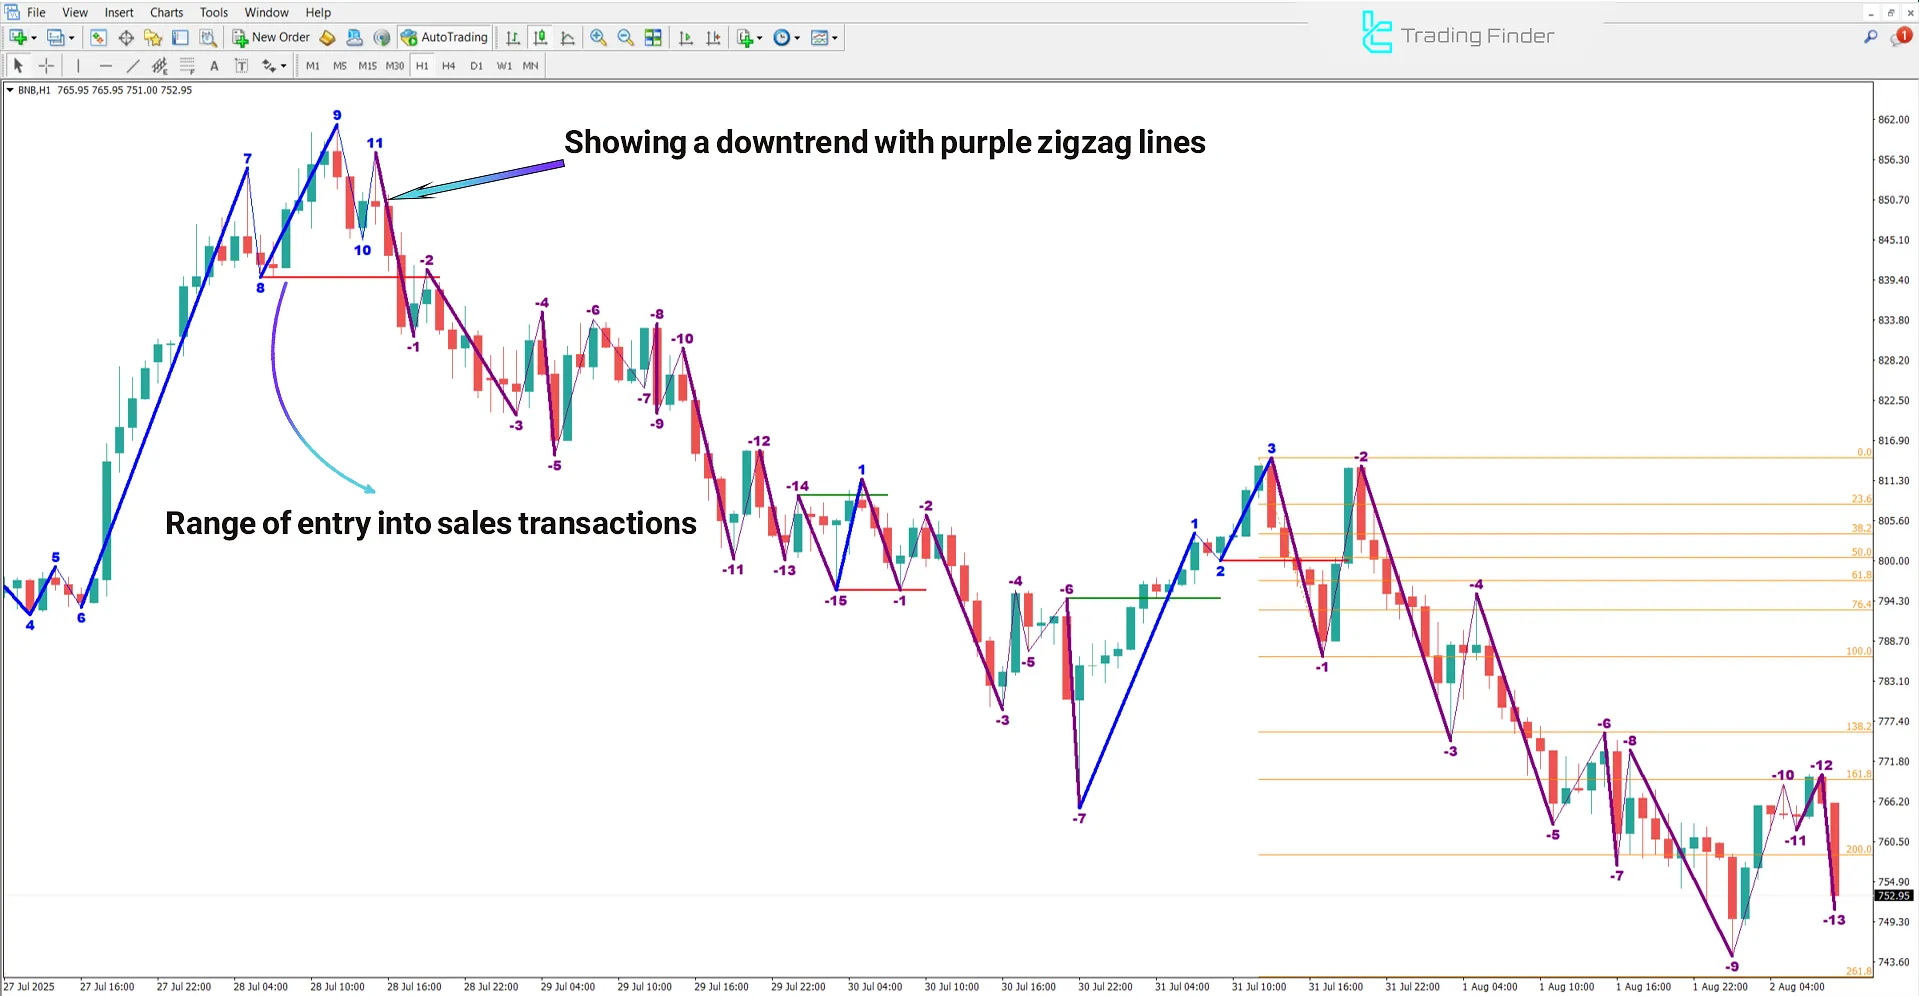
The chart below shows the BNB cryptocurrency index on a 1-hour timeframe. In the bearish scenario, the formation of a downward-sloping purple line within the wave structure signals the start of selling pressure and a market downtrend.
After the price reaches a resistance zone or one of the Fibonacci retracement levels, a red line appears, indicating a suitable area for entering sell trades.

Road Map V04 Indicator Settings
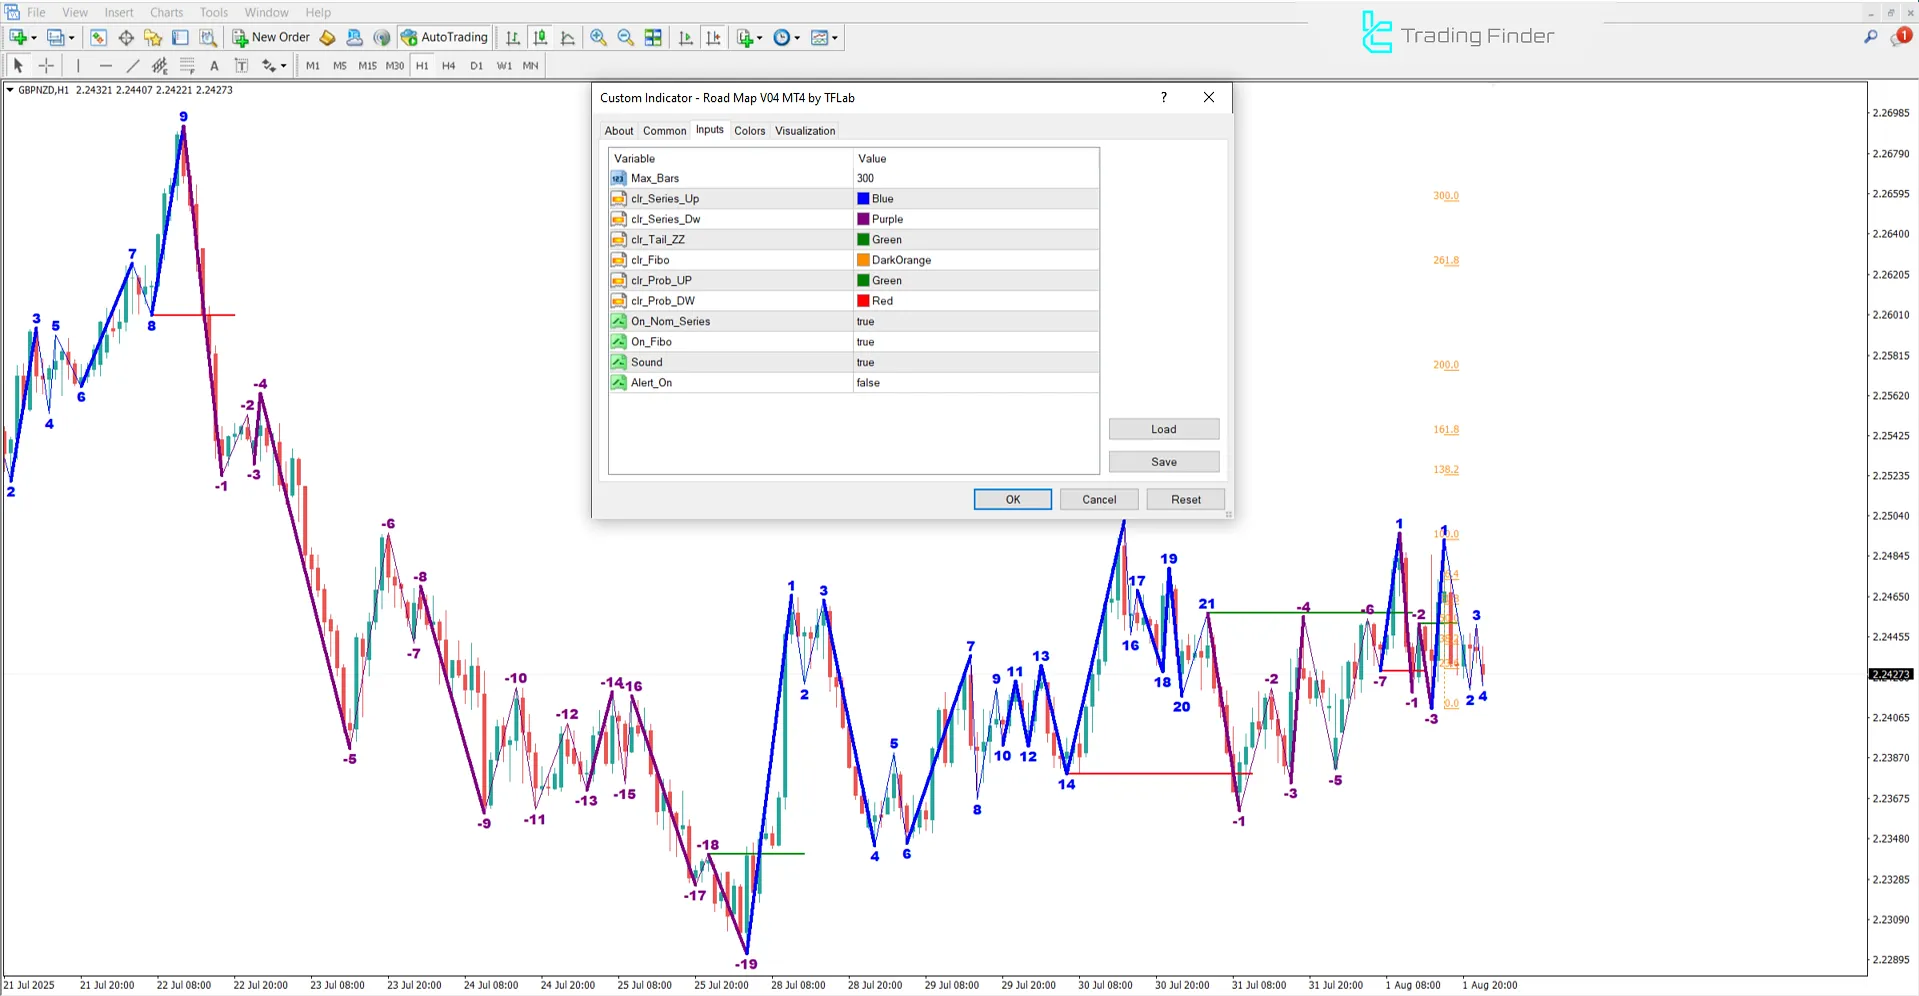
The image below shows the settings panel of the Road Map V04 Indicator in MetaTrader 4:

- Max_Bars: Maximum number of candles
- Clr_Series_Up: Color of bullish wave
- Clr_Series_Dw: Color of bearish wave
- Clr_Tail_ZZ: ZigZag tail color
- Clr_Fibo: Fibonacci levels color
- Clr_Prob_UP: Probability of upward movement color
- Clr_Prob_DW: Probability of downward movement color
- On_Nom_Series: Enable wave structure display
- On_Fibo: Enable Fibonacci levels
- Sound: Audio alert
- Alert_On: Text alert
Conclusion
The Road Map V04 Indicator is a specialized tool for analyzing price wave structures in the market. By automatically plotting waves, Fibonacci levels, and color-coded signals, it displays trends and reversal zones.
This trading tool is handy for both trend-following and reversal trades across multiple timeframes.
Road Map V04 Indicator MetaTrader 4 PDF
Road Map V04 Indicator MetaTrader 4 PDF
Click to download Road Map V04 Indicator MetaTrader 4 PDFWhat exactly does the Road Map V04 Indicator do?
This indicator draws the structure of price movements as bullish and bearish waves while simultaneously displaying key Fibonacci levels and signals for trend continuation or reversal.
What do the green and red lines indicate in the Road Map V04 Indicator?
In this indicator, the green line confirms the likelihood of a bullish trend continuation, while the red line signals a potential bearish reversal.


