![RSI Divergence Indicator for MetaTrader 4 Download - Free - [TF Lab]](https://cdn.tradingfinder.com/image/105547/10-8-en-rsi-divergence-mt4.webp)
![RSI Divergence Indicator for MetaTrader 4 Download - Free - [TF Lab] 0](https://cdn.tradingfinder.com/image/105547/10-8-en-rsi-divergence-mt4.webp)
![RSI Divergence Indicator for MetaTrader 4 Download - Free - [TF Lab] 1](https://cdn.tradingfinder.com/image/2312/10-08-en-rsi-divergence-mt4-02-avif)
![RSI Divergence Indicator for MetaTrader 4 Download - Free - [TF Lab] 2](https://cdn.tradingfinder.com/image/2311/10-08-en-rsi-divergence-mt4-03-avif)
![RSI Divergence Indicator for MetaTrader 4 Download - Free - [TF Lab] 3](https://cdn.tradingfinder.com/image/2309/10-08-en-rsi-divergence-mt4-04-avif)
On June 22, 2025, in version 2, alert/notification functionality was added to this indicator
The RSI Divergence indicator, like the automatic MACD Divergence indicator, is an essential technical analysis tool and one of the most critical indicators for trend reversals widely used in the MetaTrader 4 indicator.
This indicator automatically identifies bullish divergences at lows and bearish divergences at highs. It can be used alongside other technical analysis tools, such as support and resistance levels, to obtain reliable signals.
Indicator Table
Indicator Categories: | Price Action MT4 Indicators Oscillators MT4 Indicators Signal & Forecast MT4 Indicators |
Platforms: | MetaTrader 4 Indicators |
Trading Skills: | Elementary |
Indicator Types: | Reversal MT4 Indicators |
Timeframe: | Multi-Timeframe MT4 Indicators |
Trading Style: | Day Trading MT4 Indicators Fast Scalper MT4 Indicators Scalper MT4 Indicators Swing Trading MT4 Indicators |
Trading Instruments: | Share Stocks MT4 Indicators Forward Market MT4 Indicators Indices Market MT4 Indicators Commodity Market MT4 Indicators Stock Market MT4 Indicators Cryptocurrency MT4 Indicators Forex MT4 Indicators |
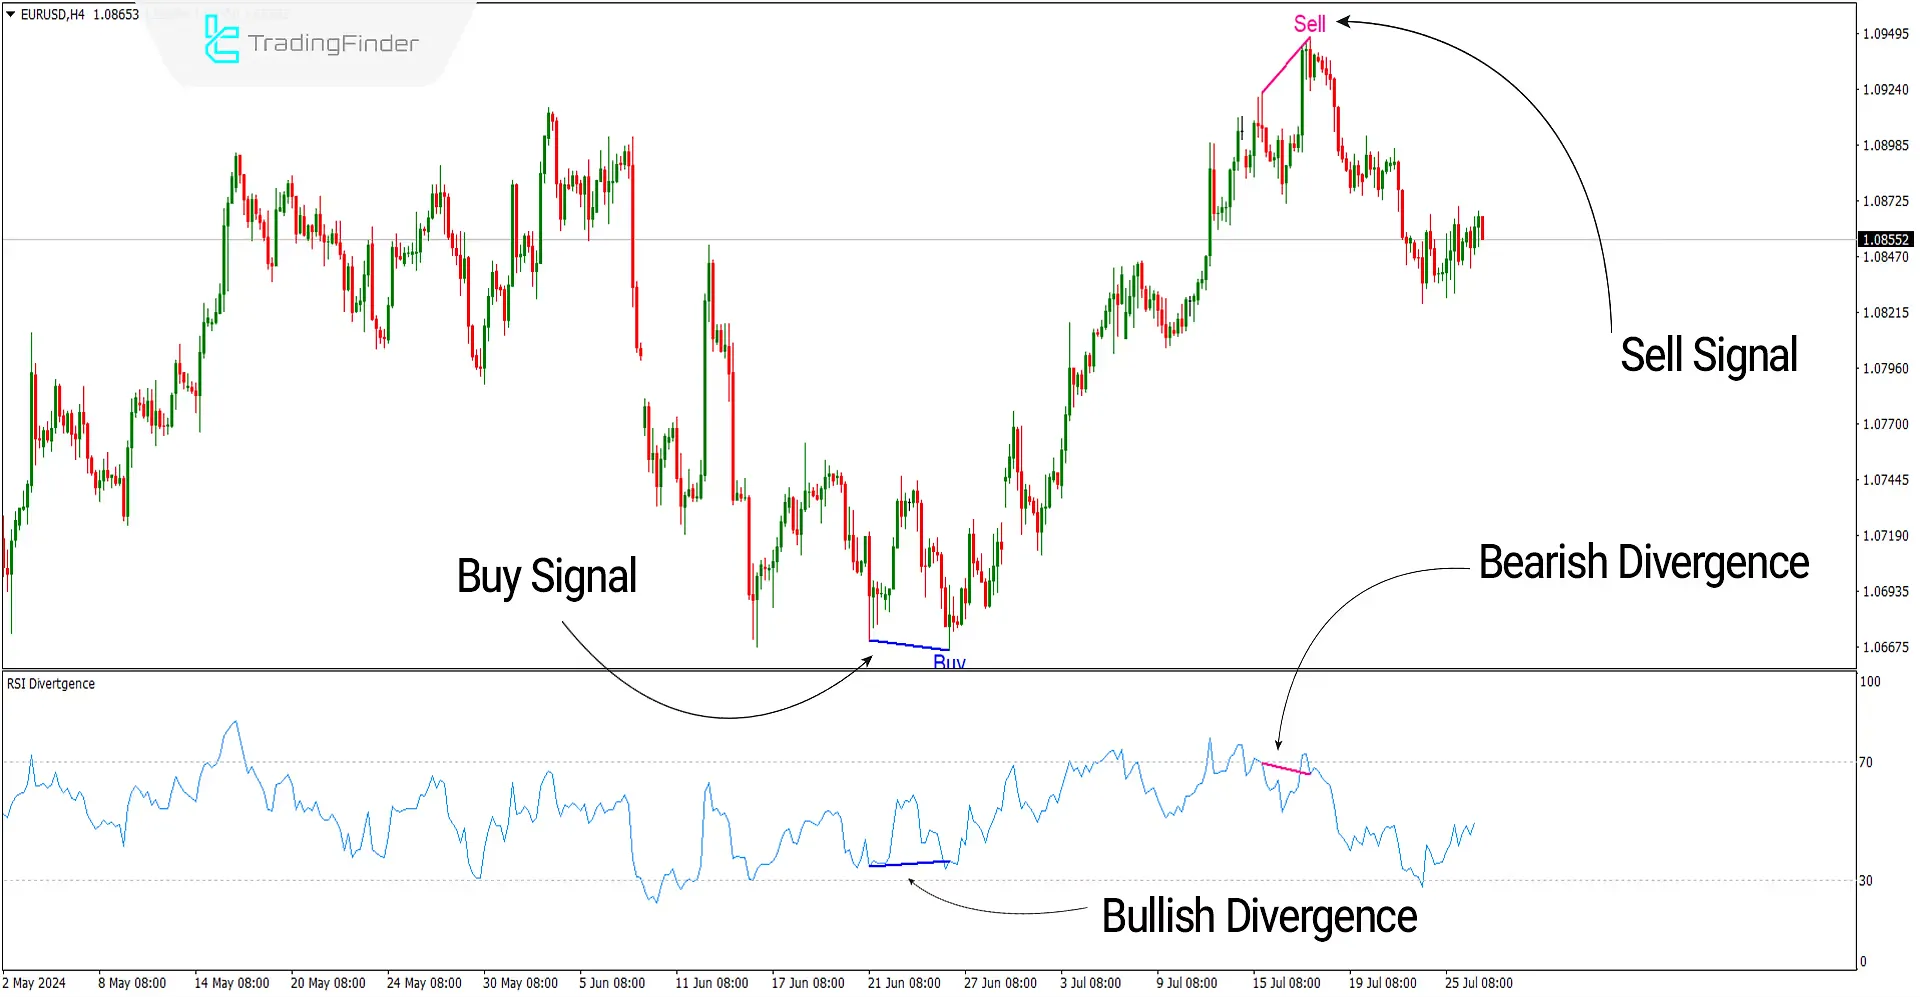
In the image below, the chart of the EUR/USD currency pair in a 4-hour timeframe is shown, where at the end of a downtrend, the last low has gone lower than the previous low (LL). Still, the RSI indicator shows a bullish divergence (positive), issuing a buy signal and indicating a trend reversal. Similarly, after an uptrend, the last high has gone higher than the previous high (HH). Still, a bearish divergence (negative) has formed on the indicator, indicating a sell signal and a reversal from an uptrend to a downtrend.

Overview
The RSI Divergence indicator can detect the continuation of the primary trend or a reversal. This indicator identifies divergences without needing manual chart examination, which can increase analysis accuracy and prevent human errors. Divergences are usually considered solid signals for trend changes, so incorporating them into trading strategies is highly beneficial.
Uptrend Signals (Buy Positions)
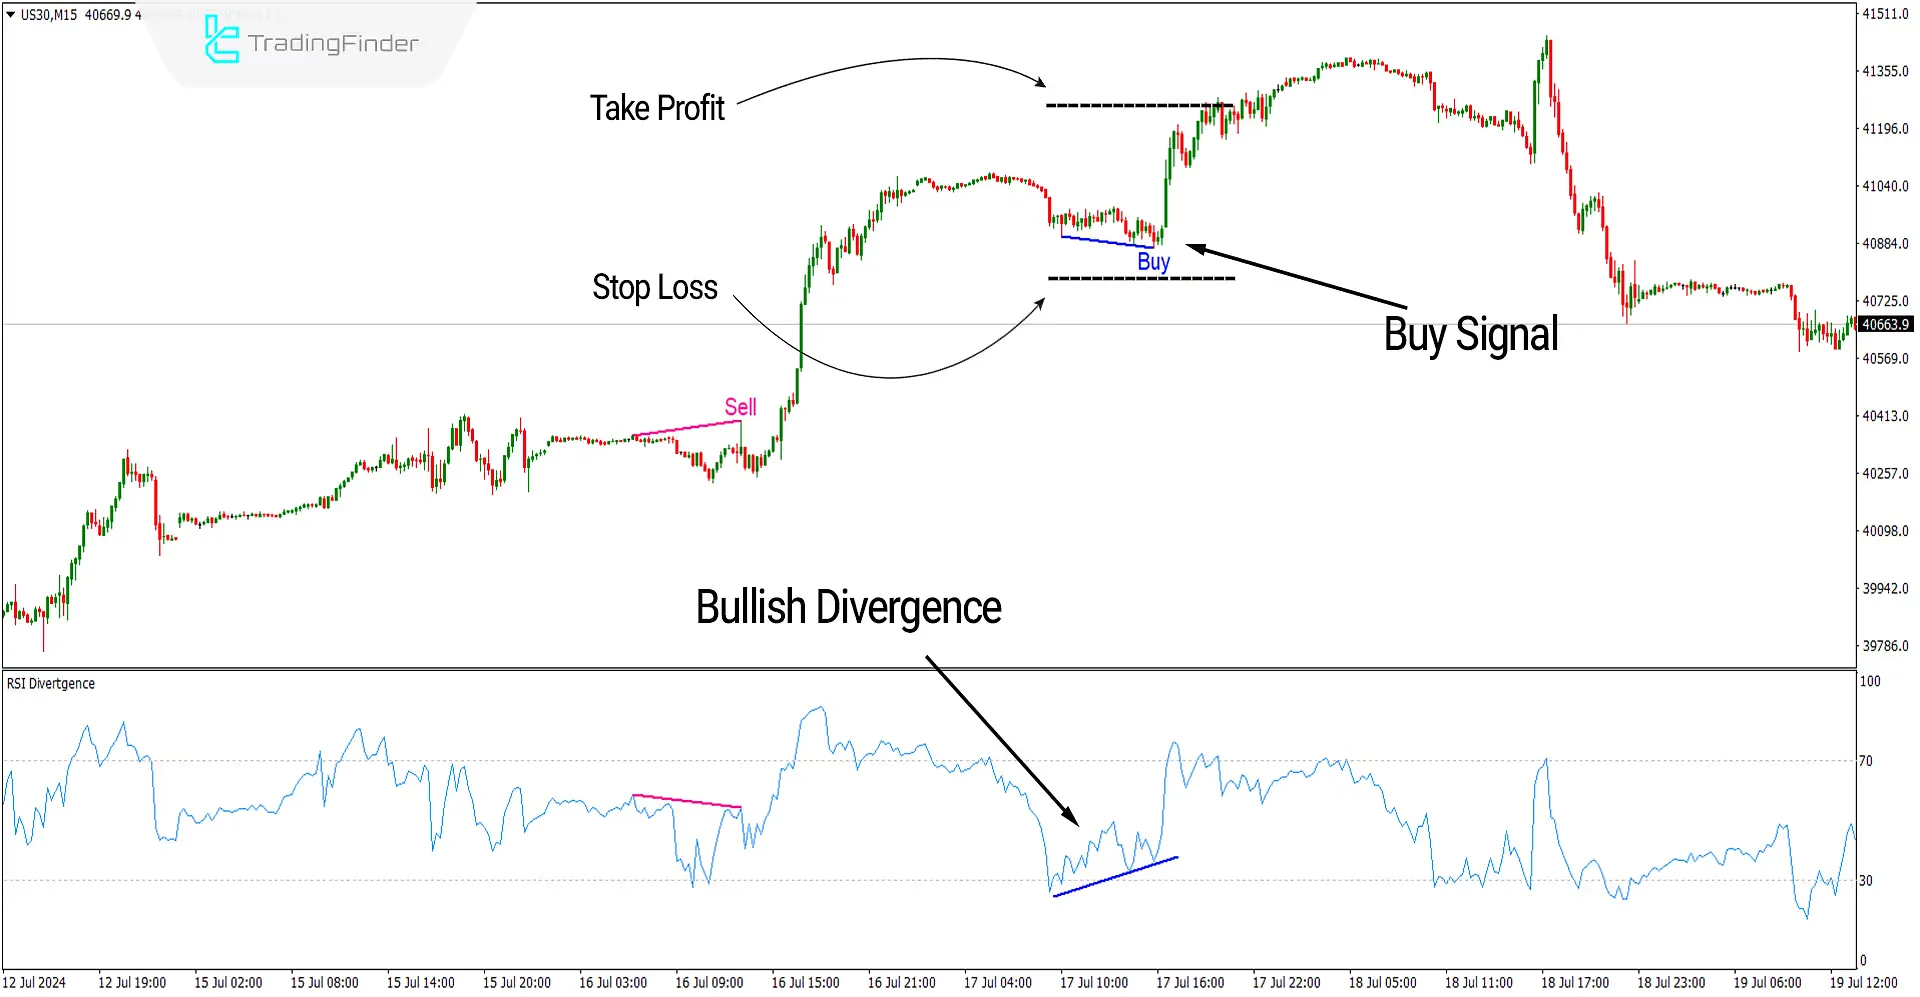
In the image below, the Dow Jones Index chart with the symbol (US30) in a 15-minute timeframe is shown. After a retracement, we witness a weakening of power, and the indicator reaches the oversold zone. The indicator detects a positive divergence between the two lows at the end of the retracement (Swing Low) and issues a (BUY) signal on the price chart.
Take Profit and Stop Loss for Buy Signals
The price reaching the overbought zone can be considered to set the take profit, and the stop loss can be placed near the last low.

Downtrend Signals (Sell Positions)
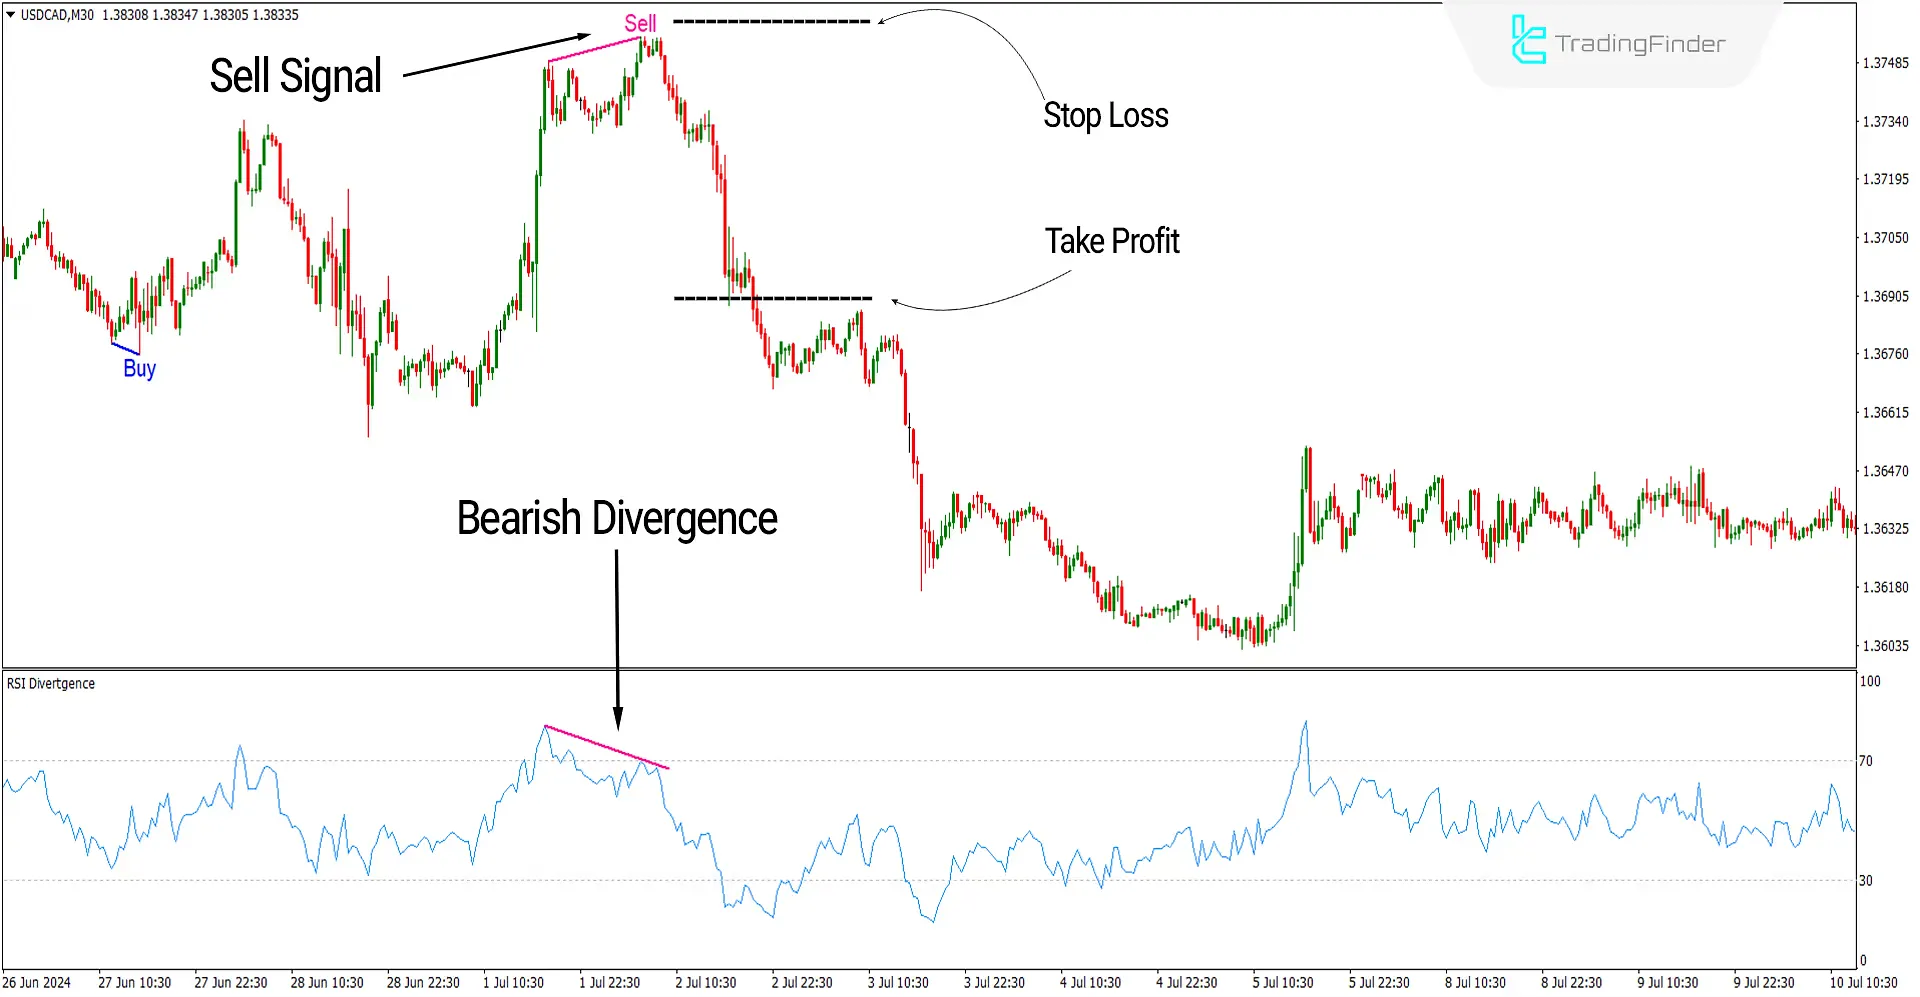
In the image below, the chart of the USD/CAD currency pair in a 30-minute timeframe is shown. After an uptrend, we see a bearish divergence (negative) between the two highs at the end of the trend. Additionally, the indicator has reached the overbought zone, and under these conditions, the (SELL) signal appears on the chart, indicating an entry into sell trades.
Take Profit and Stop Loss for Sell Signals
The price reaching the oversold zone can be considered to set the take profit, and the stop loss can be placed near the last high.

Settings of the RSI Divergence Indicator

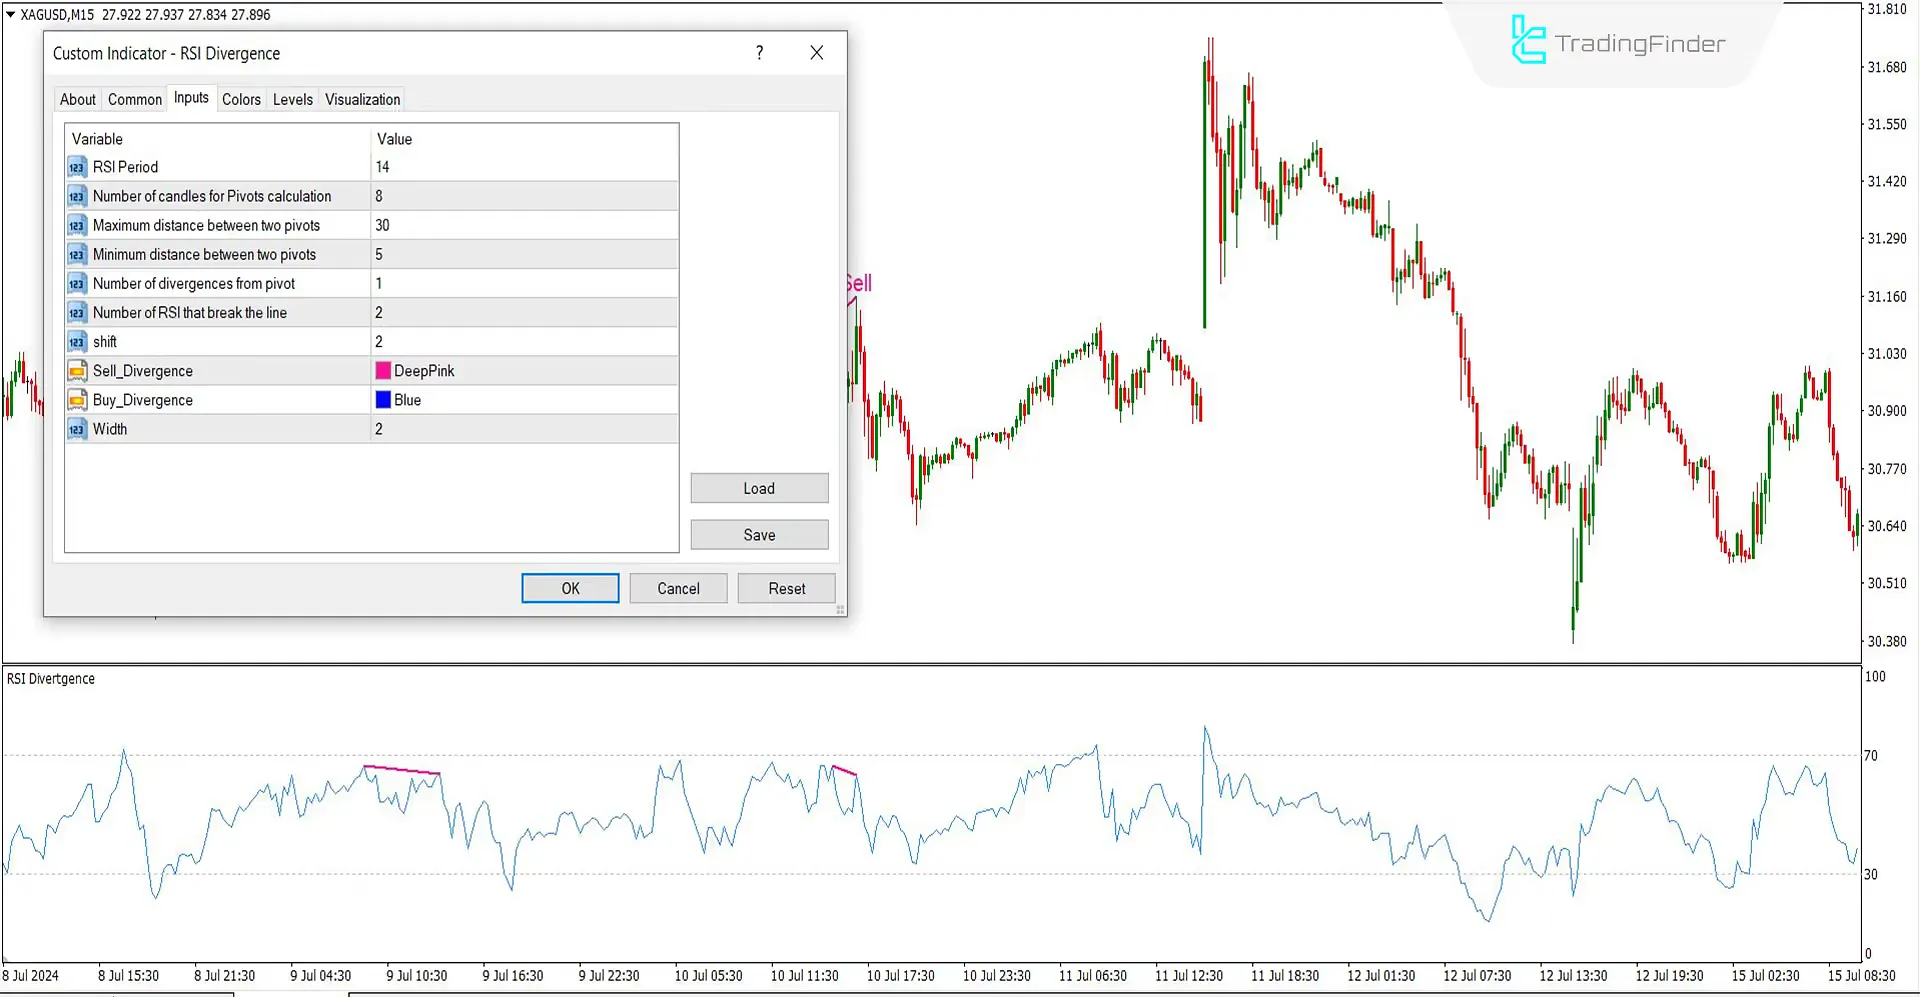
- RSI Period: The RSI period is set to 14
- Number of candles for Pivots calculation: The number for pivot calculation is set to 8
- Maximum distance between two pivots: The maximum distance between two pivots is 30
- Minimum distance between two pivots: The minimum distance between two pivots is 5
- Number of divergences from pivot: The number of divergences from each pivot is 1
- Number of RSI that break the line: The number of RSI line breaks is set to 2
- Shift: The shift is set to 2
- Sell Divergence: Set the color for sell signals to pink or any color you choose
- Buy Divergence: Set the color for buy signals to blue or any color you choose
- Width: The width of the divergence line can be set to 2
Conclusion
The RSI Divergence indicator is a technical analysis tool that helps identify divergence points in the Relative Strength Index (RSI). Divergences occur when the price movement and the RSI move in opposite directions. This type of style Price Action indicator helps traders identify potential trend changes or the continuation of the existing trend.
RSI Divergence MT4 PDF
RSI Divergence MT4 PDF
Click to download RSI Divergence MT4 PDFWhat is the use of the RSI Divergence oscillator?
This oscillator automatically shows divergences on the price chart and identifies reversal points.
When should we use RSI divergence?
RSI divergences are usually very effective at market trend reversal points. Traders use this indicator to identify suitable trade entry and exit points.


