![Schaff Trend Cycle Indicator for MetaTrader 4 Download - Free - [Trading Finder]](https://cdn.tradingfinder.com/image/106745/10-15-en-shaff-trend-cycle-mt4.webp)
![Schaff Trend Cycle Indicator for MetaTrader 4 Download - Free - [Trading Finder] 0](https://cdn.tradingfinder.com/image/106745/10-15-en-shaff-trend-cycle-mt4.webp)
![Schaff Trend Cycle Indicator for MetaTrader 4 Download - Free - [Trading Finder] 1](https://cdn.tradingfinder.com/image/99810/10-15-en-schaff-trend-cycle-mt4-02.webp)
![Schaff Trend Cycle Indicator for MetaTrader 4 Download - Free - [Trading Finder] 2](https://cdn.tradingfinder.com/image/99797/10-15-en-schaff-trend-cycle-mt4-03.webp)
![Schaff Trend Cycle Indicator for MetaTrader 4 Download - Free - [Trading Finder] 3](https://cdn.tradingfinder.com/image/99809/10-15-en-schaff-trend-cycle-mt4-06.webp)
The Schaff Trend Cycle Indicator is one of the indicators in MetaTrader 4 that combines two popular indicators, MACD (Moving Average Convergence Divergence) and Stochastic Oscillator. This indicator is designed to detect overbought and oversold points with greater sensitivity than both indicators.
Values below 25 are considered oversold, and values above 75 are considered overbought. As a result, this indicator is very effective in the early detection of new trends and helps traders identify overbought and oversold zones or stay with the prevailing trend.
Indicator Table
Indicator Categories: | Oscillators MT4 Indicators Signal & Forecast MT4 Indicators |
Platforms: | MetaTrader 4 Indicators |
Trading Skills: | Elementary |
Indicator Types: | Overbought and Oversold MT4 Indicators Reversal MT4 Indicators |
Timeframe: | Multi-Timeframe MT4 Indicators |
Trading Style: | Day Trading MT4 Indicators Scalper MT4 Indicators Swing Trading MT4 Indicators |
Trading Instruments: | Share Stocks MT4 Indicators Forward Market MT4 Indicators Indices Market MT4 Indicators Commodity Market MT4 Indicators Stock Market MT4 Indicators Cryptocurrency MT4 Indicators Forex MT4 Indicators |
Indicator at a Glance
The Schaff Trend Cycle Indicator is a practical tool for traders who rely on indicators for their analysis. It performs its calculations based on two classic indicators: MACD and Stochastic.
Using this MetaTrader4 osillator indicator, traders can quickly identify the price trend and detect overbought and oversold zones.
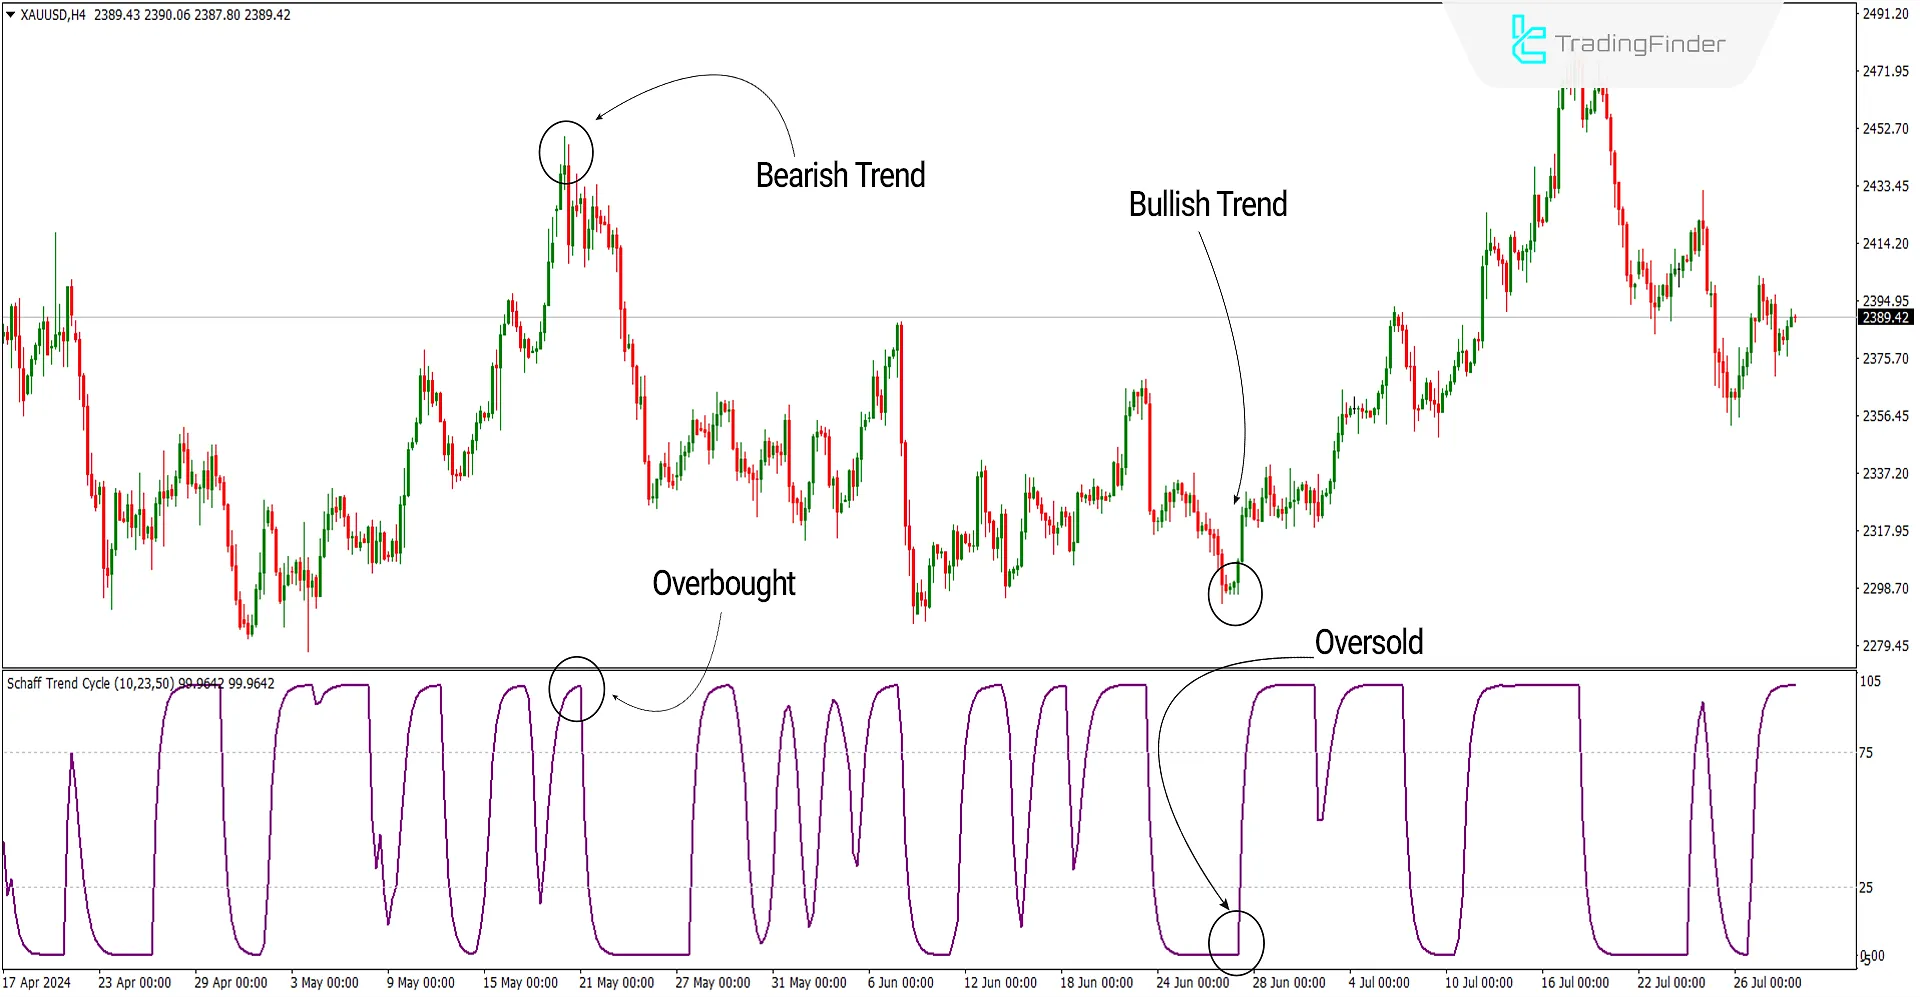
In the image below, the price chart of gold with the symbol [XAUUSD] is shown in the 4-hour timeframe. On the left side of the image, the indicator has reached the overbought zone, issuing a Downtrend signal and sell positions. The price has reached the oversold zone on the right side, issuing an Uptrend signal and buy positions.
Bullish Signal Conditions of the Indicator (Bullish Setup)
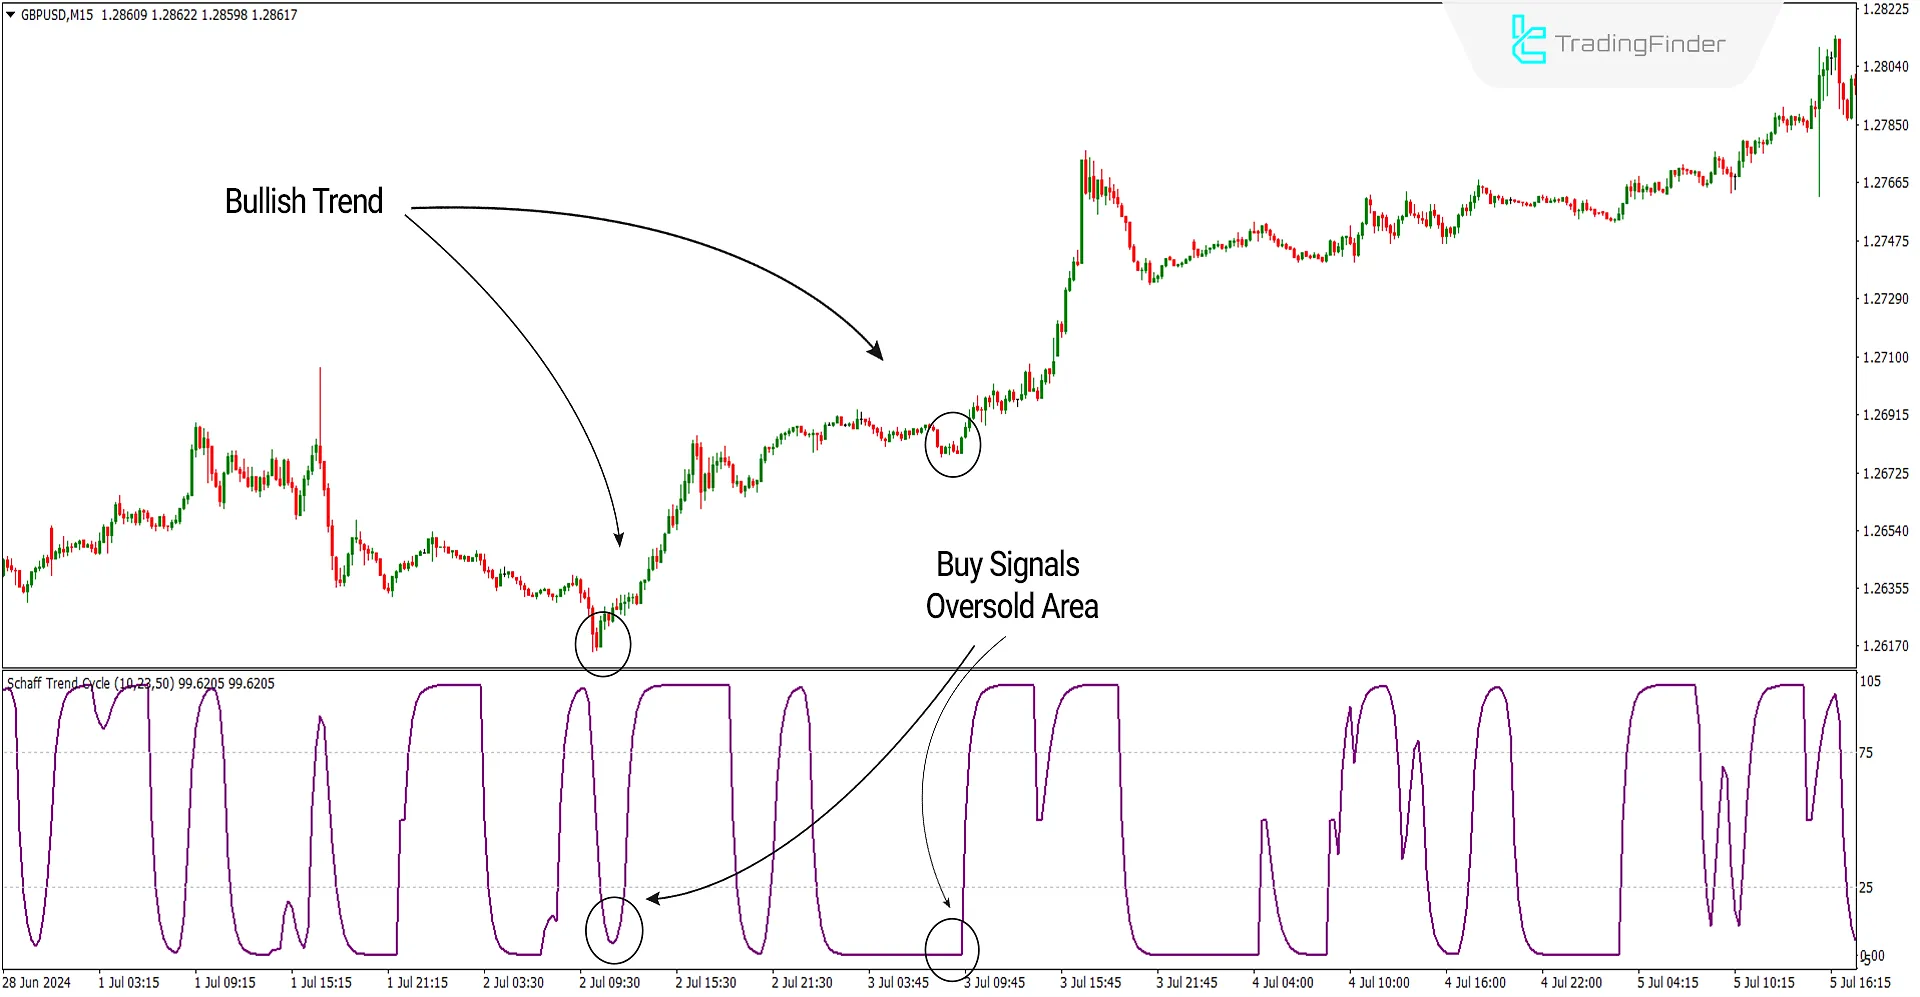
In the image below, the chart of the GBP/USD currency pair is shown in the 15-minute timeframe. The indicator reaches the oversold zone at the indicated points, issuing an Uptrend signal. One can look for buying opportunities using a bullish candlestick pattern or other technical analysis tools.
Bearish Signal Conditions of the Indicator (Bearish Setup)
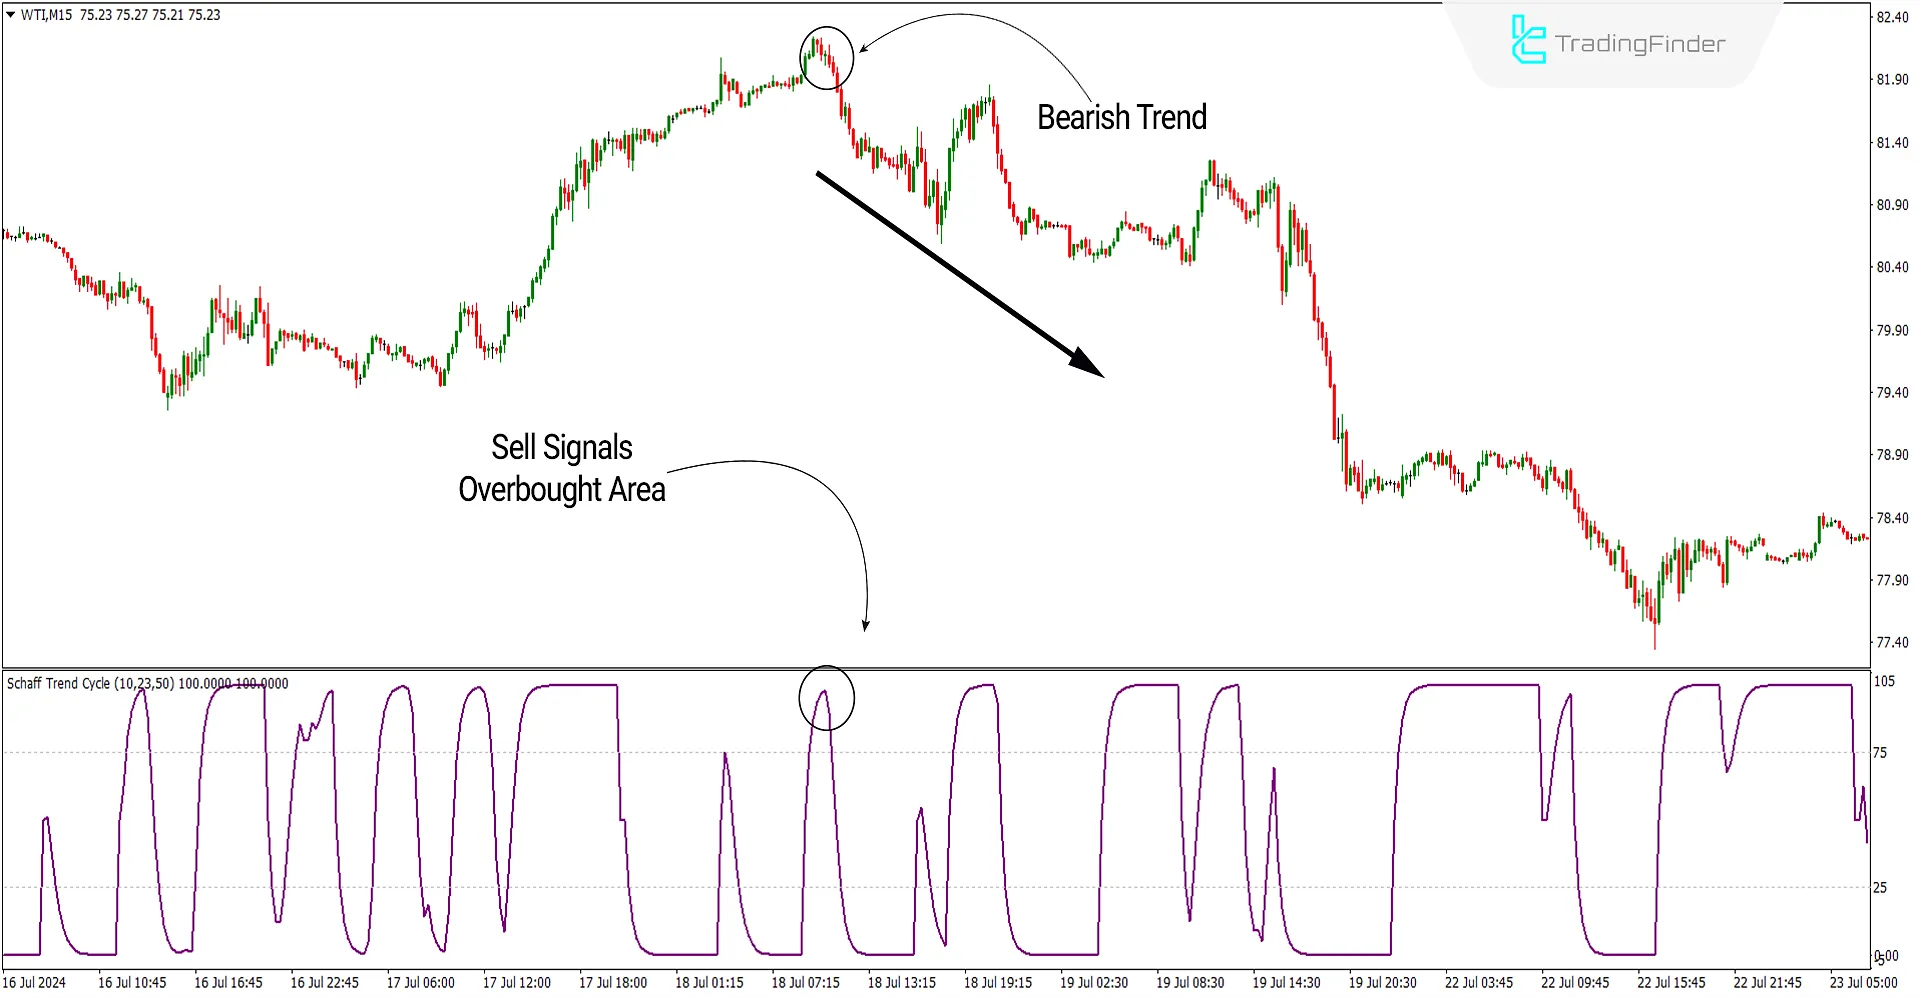
In the image below, the WTI crude oil price chart is shown in the 15-minute timeframe. The indicator reaches the overbought zone in the indicated area, issuing a Downtrend signal. One can look for selling opportunities using a bearish candlestick pattern or other technical analysis tools.
Schaff Trend Cycle Indicator Settings
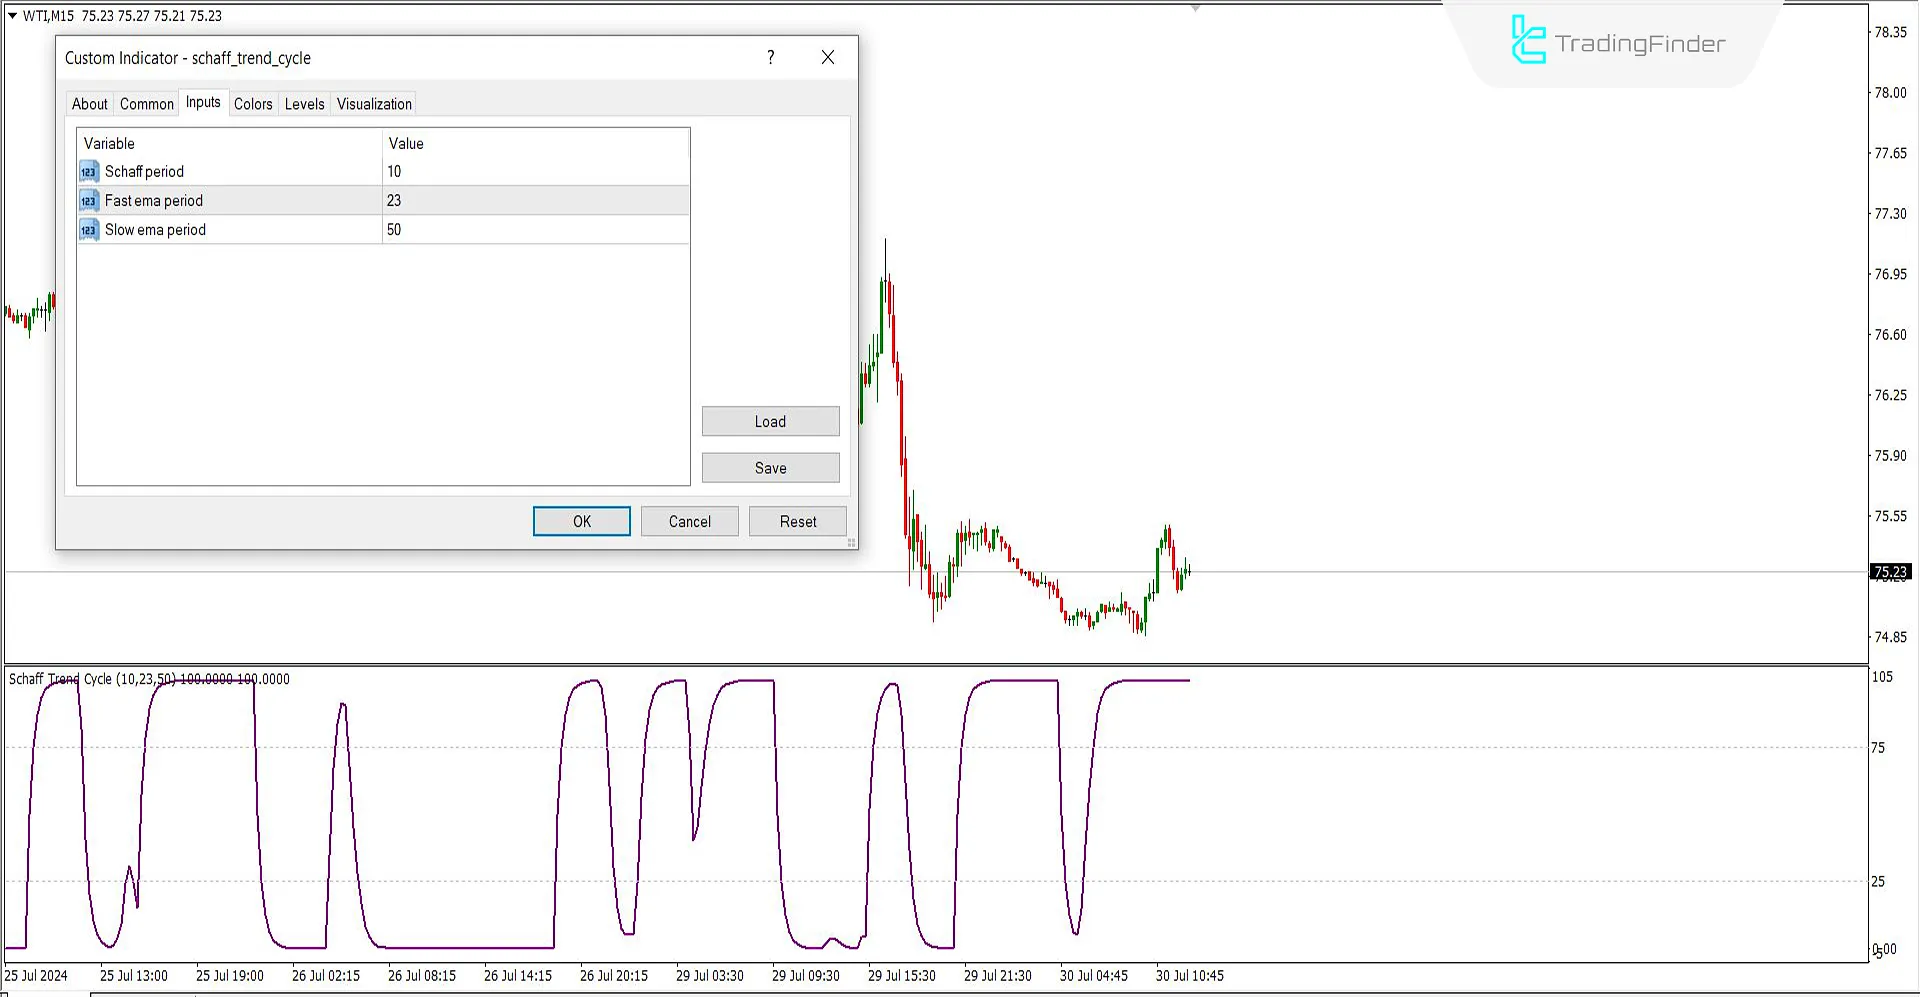
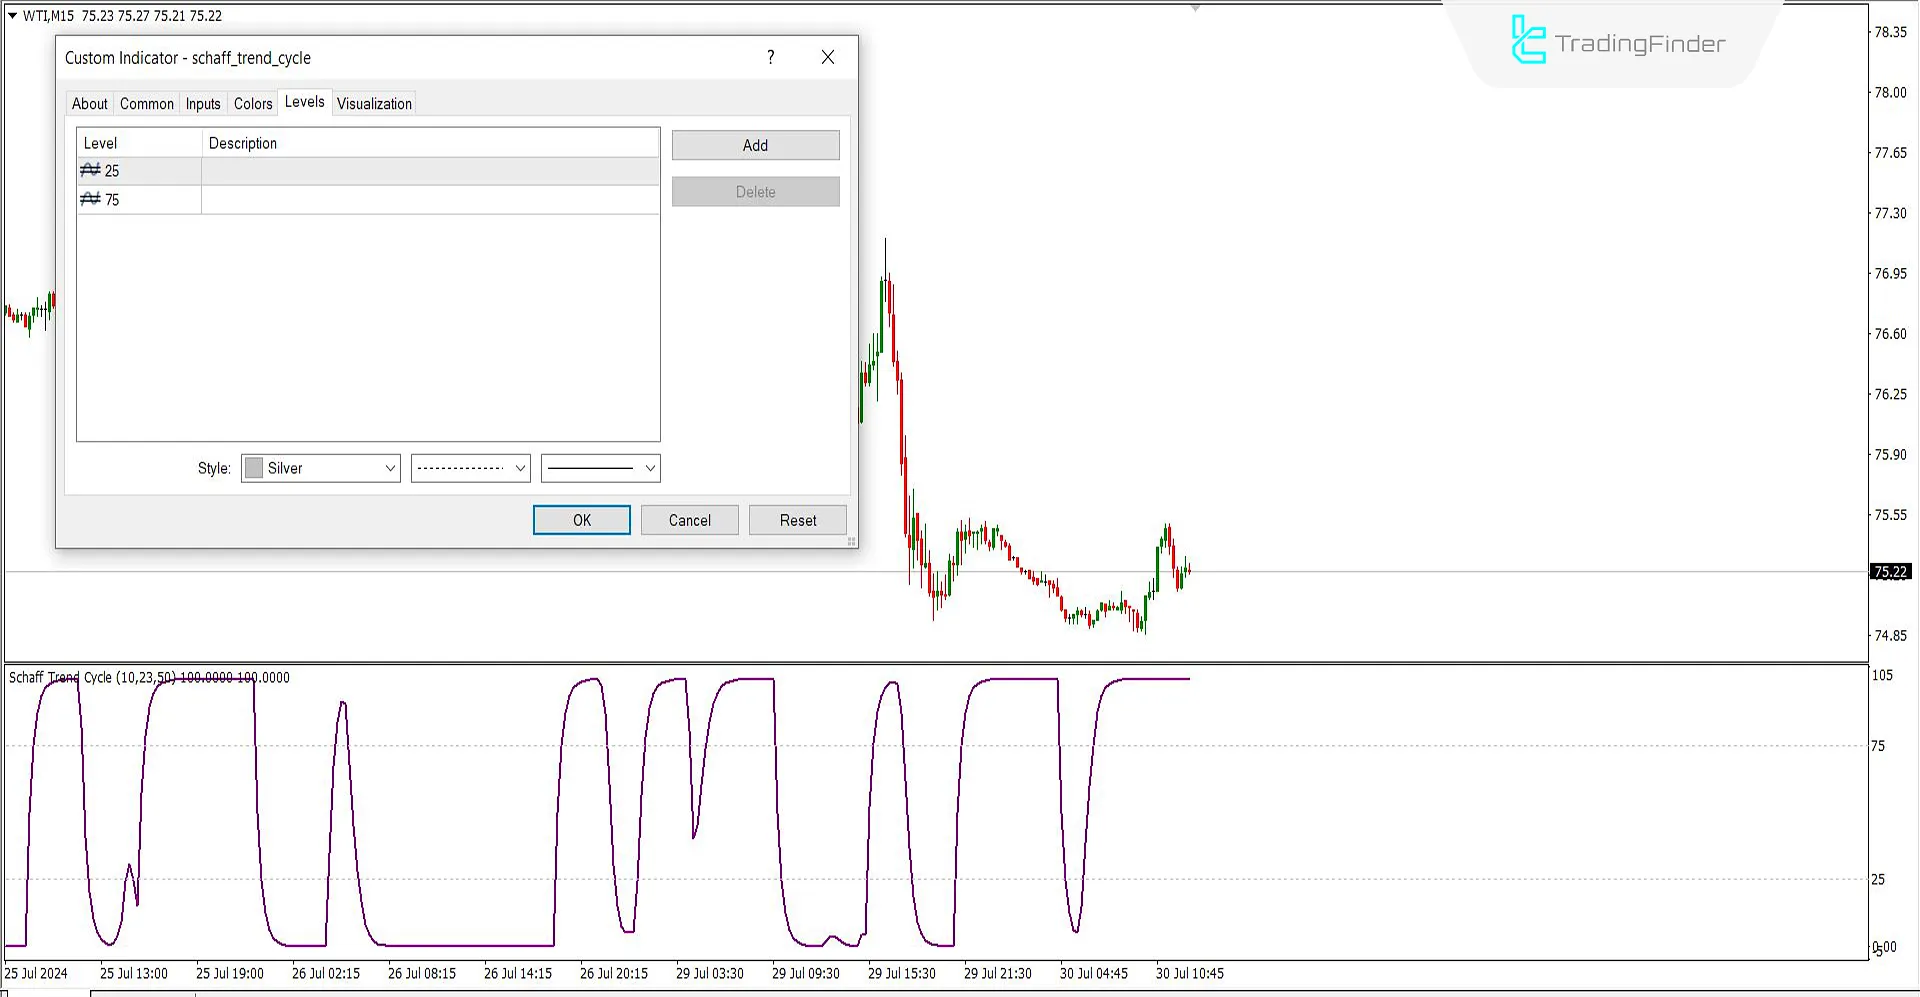
- Schaff period: The indicator period is set to 10;
- Fast EMA period: The fast-moving average period is 23;
- Slow EMA period: The slow-moving average period is 50.
Explanation: To create the 25 and 75 lines on the indicator, as shown in the image below, you can add the desired levels in the (Levels) section.
Conclusion
The Schaff Trend Cycle (STC) helps traders detect market trends more quickly and accurately. By combining MACD and Stochastic, this indicator filters out unnecessary market noise and provides more precise signals. It is also applicable across all timeframes and markets. In shorter timeframes, this indicator may be more sensitive to short-term fluctuations; therefore, it is recommended to use other analytical tools alongside it.
Schaff Trend Cycle MT4 PDF
Schaff Trend Cycle MT4 PDF
Click to download Schaff Trend Cycle MT4 PDFWhat is the Schaff Trend Cycle (STC) Indicator?
The Schaff Trend Cycle indicator is a technical analysis tool that combines MACD and Stochastic to identify market trends and suitable buy and sell points.
Does using the STC require special knowledge?
Yes, to effectively use this indicator, one needs technical analysis knowledge and proper indicator settings to avoid false signals.


