![Sideways Detector indicator for MT4 - Download - [TradingFinder]](https://cdn.tradingfinder.com/image/292103/2-37-en-sideways-detector-mt4-1.webp)
![Sideways Detector indicator for MT4 - Download - [TradingFinder] 0](https://cdn.tradingfinder.com/image/292103/2-37-en-sideways-detector-mt4-1.webp)
![Sideways Detector indicator for MT4 - Download - [TradingFinder] 1](https://cdn.tradingfinder.com/image/292112/2-37-en-sideways-detector-mt4-2.webp)
![Sideways Detector indicator for MT4 - Download - [TradingFinder] 2](https://cdn.tradingfinder.com/image/292111/2-37-en-sideways-detector-mt4-3.webp)
![Sideways Detector indicator for MT4 - Download - [TradingFinder] 3](https://cdn.tradingfinder.com/image/292113/2-37-en-sideways-detector-mt4-4.webp)
The Sideways Detector indicator is a technical analysis tool on the MetaTrader 4 platform that displays range areas and identifies the market condition in blue boxes.
This MetaTrader 4 indicator uses internal algorithms to detect price ranges and determine whether a trend exists.
Sideways Detector Specifications Table
The general specifications and features of the Sideways Detector indicator are displayed in the table below.
Indicator Categories: | Price Action MT4 Indicators Trading Assist MT4 Indicators Cycles MT4 Indicators |
Platforms: | MetaTrader 4 Indicators |
Trading Skills: | Intermediate |
Indicator Types: | Range MT4 Indicators Breakout MT4 Indicators |
Timeframe: | Multi-Timeframe MT4 Indicators |
Trading Style: | Intraday MT4 Indicators |
Trading Instruments: | Stock Market MT4 Indicators Cryptocurrency MT4 Indicators Forex MT4 Indicators |
Indicator Overview
If the price oscillates within a range without a trend, the Sideways Detector indicator displays it in a blue box. This box acts as a zone for exiting trades or an entry opportunity for fast scalpers.
Furthermore, this range may also be considered a support and resistance level. If a stabilizing candle closes outside this zone, the probability of a new trend formation increases.
Uptrend Conditions
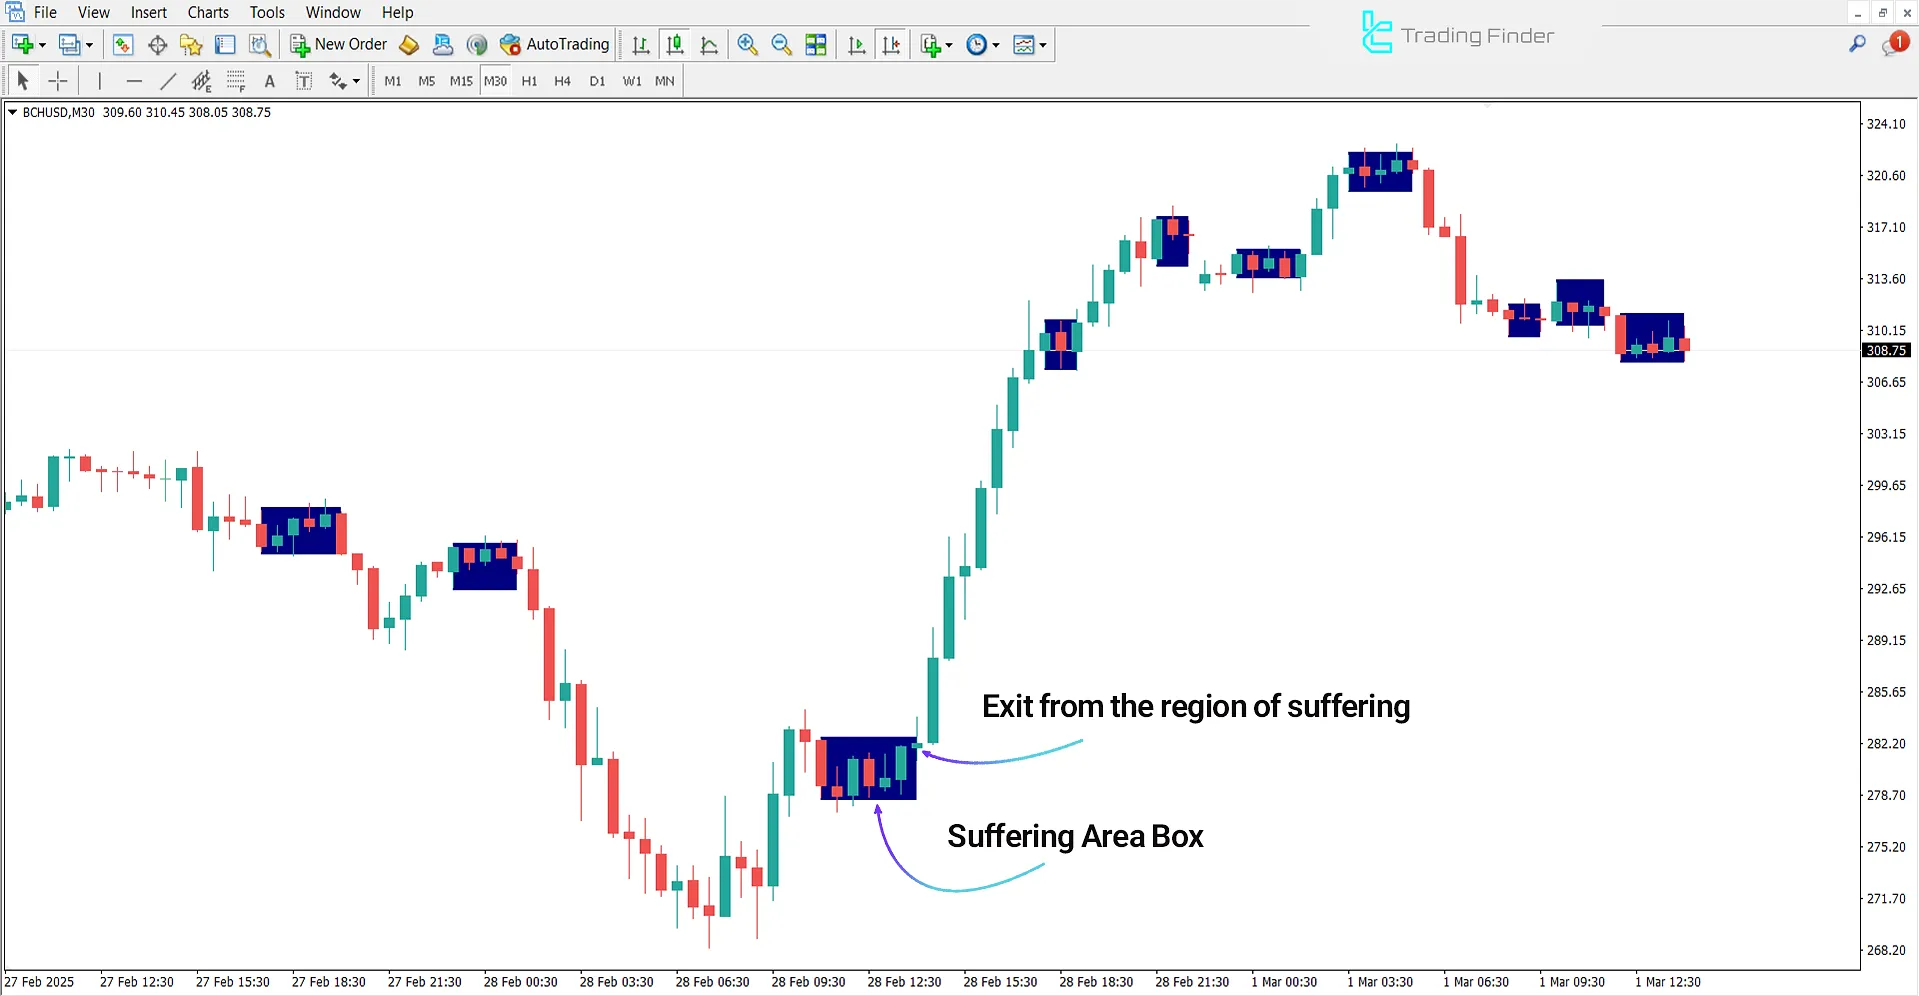
The Bitcoin Cash (BCH/USD) price chart is shown in a 30-minute timeframe. The occurrence of several trendless candles within a price range indicates market indecision.
If the price breaks upward from this range, it signals strong buyer entry and creates a favorable opportunity for entering buy trades.

Downtrend Conditions
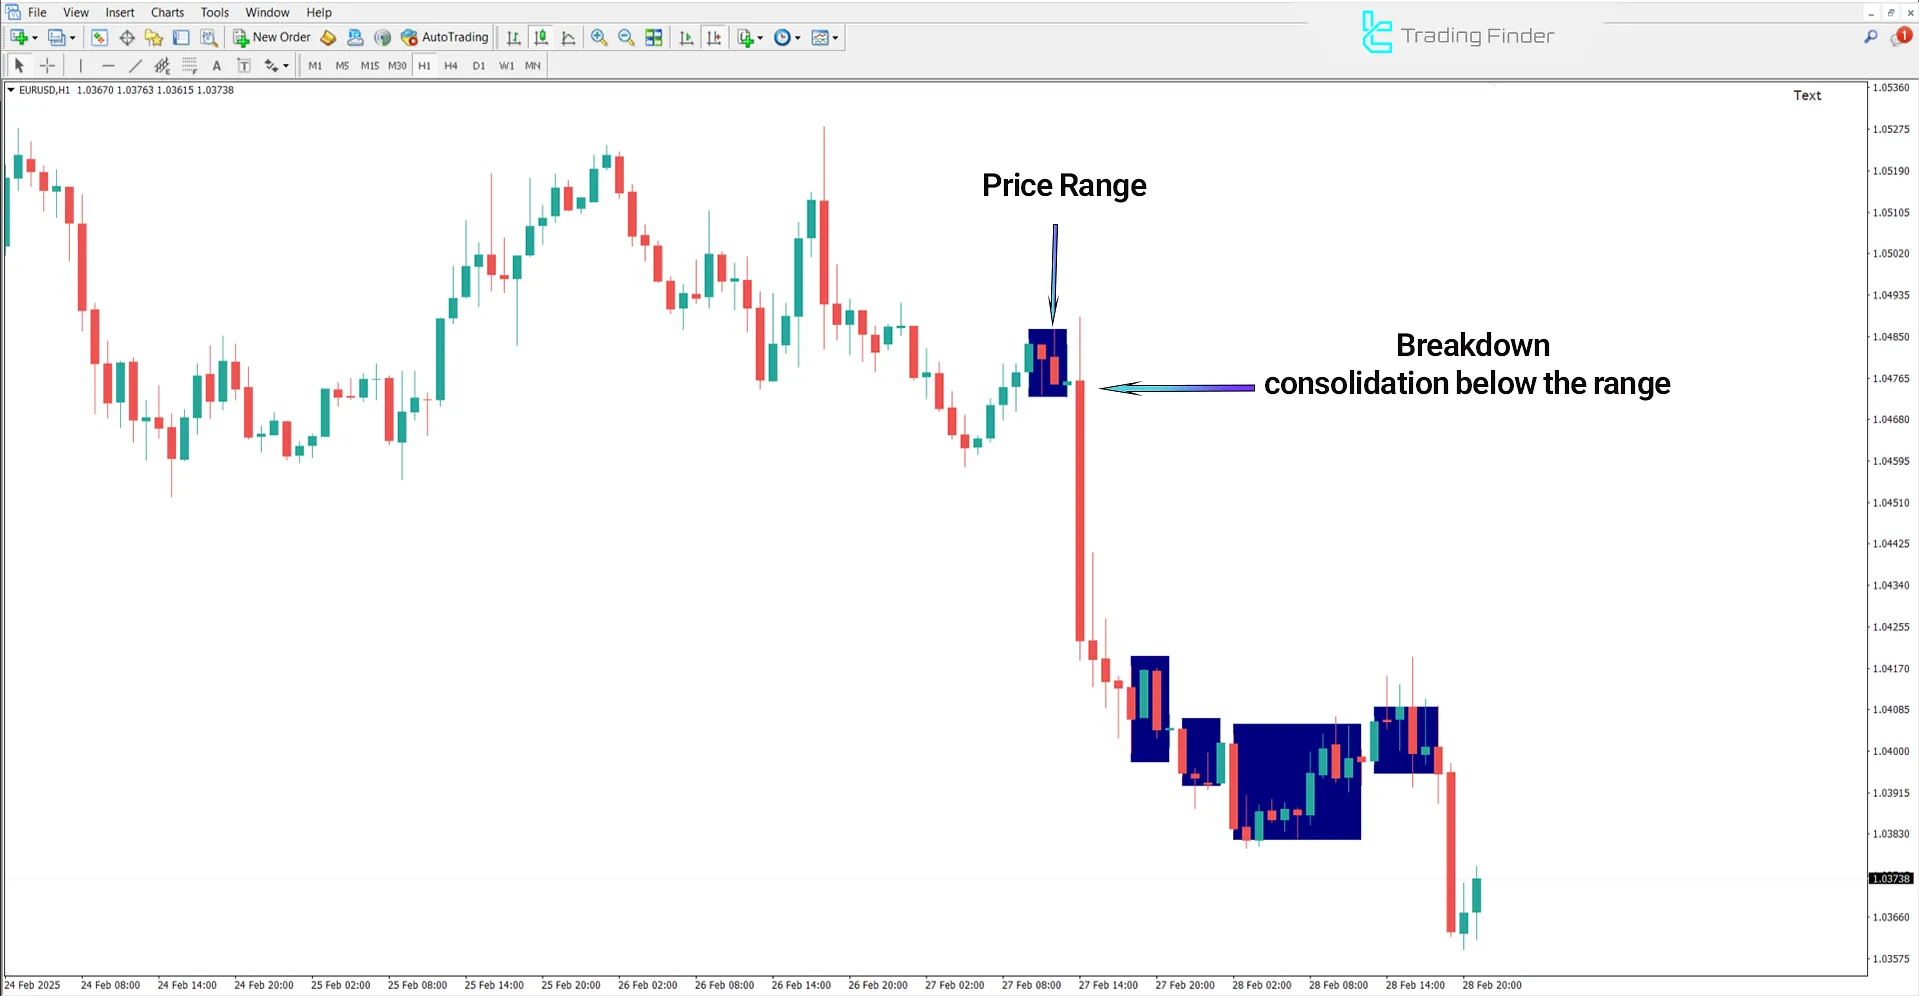
The EUR/USD currency pair chart is displayed in a one-hour timeframe. This MetaTrader 4 Trading Assist, by showing non-trending ranges in blue, enables the detection of a range-bound market.
If a candle stabilizes below this range, it confirms an exit from the range phase and increases the likelihood of a new downtrend beginning.

Indicator Settings
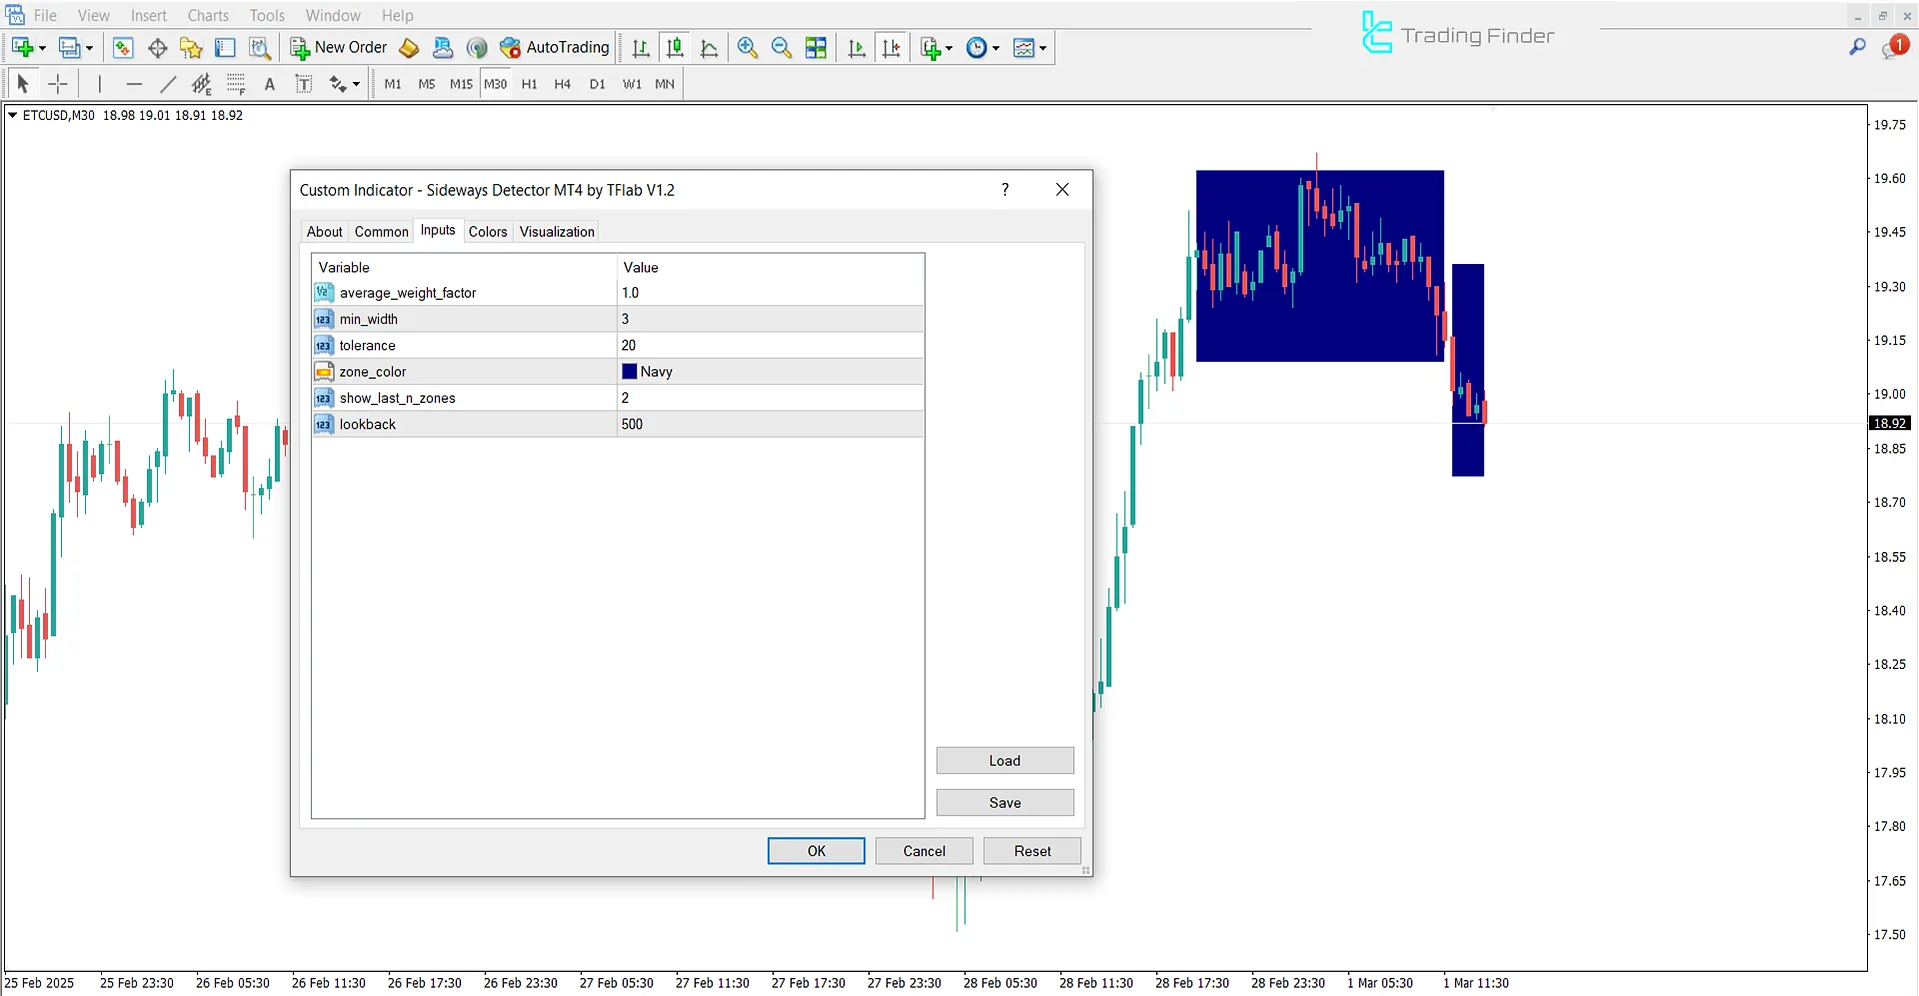
Image below shows the adjustable parameters in the settings panel:

- Average weight factor: Weighted average coefficient
- Min width: Minimum range width
- Tolerance: Tolerance or sensitivity level
- Zone Color: Zone color
- Show Last N Zones: Display the last N zones
- Lookback: Number of candles examined
Conclusion
The Sideways Detector indicator identifies neutral markets and detects trend breakout points. A correct understanding of how this technical analysis indicator works can increase trading accuracy and reduce the risk of entering the market under unfavorable conditions.
Sideways Detector indicator MT4 PDF
Sideways Detector indicator MT4 PDF
Click to download Sideways Detector indicator MT4 PDFWhat is the appropriate timeframe for using this indicator?
This indicator is multi-timeframe and is applicable across all timeframes.
Is this indicator exclusively used for range trends?
This indicator is designed to display the market range trend on the MetaTrader 4 platform.


