![SMT Divergence Oil Indicator for MetaTrader 4 Download - Free - [TFlab]](https://cdn.tradingfinder.com/image/277561/4-40-en-smt-divergence-oil-mt4.webp)
![SMT Divergence Oil Indicator for MetaTrader 4 Download - Free - [TFlab] 0](https://cdn.tradingfinder.com/image/277561/4-40-en-smt-divergence-oil-mt4.webp)
![SMT Divergence Oil Indicator for MetaTrader 4 Download - Free - [TFlab] 1](https://cdn.tradingfinder.com/image/277562/4-40-en-smt-divergence-oil-mt4-2.webp)
![SMT Divergence Oil Indicator for MetaTrader 4 Download - Free - [TFlab] 2](https://cdn.tradingfinder.com/image/277564/4-40-en-smt-divergence-oil-mt4-3.webp)
![SMT Divergence Oil Indicator for MetaTrader 4 Download - Free - [TFlab] 3](https://cdn.tradingfinder.com/image/277563/4-40-en-smt-divergence-oil-mt4-4.webp)
The SMT Divergence Oil Indicator analyzes price movements by identifying divergence patterns within MetaTrader 4 indicators.
This tool detects divergences between Crude Oil (XTIUSD), the US Dollar/Canadian Dollar pair (USD/CAD), and Brent Crude (XBRUSD), plotting divergences in buying and selling pressure directly on the chart.
SMT Divergence Oil Indicator Table
The key features of the SMT Divergence Oil Indicator are summarized in the table below.
Indicator Categories: | ICT MT4 Indicators Smart Money MT4 Indicators Trading Assist MT4 Indicators |
Platforms: | MetaTrader 4 Indicators |
Trading Skills: | Advanced |
Indicator Types: | Range MT4 Indicators Leading MT4 Indicators |
Timeframe: | Multi-Timeframe MT4 Indicators |
Trading Style: | Day Trading MT4 Indicators |
Trading Instruments: | Stock Market MT4 Indicators Cryptocurrency MT4 Indicators Forex MT4 Indicators |
Quick Overview of the Indicator
This indicator focuses on divergence analysis between multiple correlated assets, utilizing these divergences to determine trend reversals or trend continuation strength.
When divergence appears on the main asset (base currency), the indicator displays the divergence strength in related assets.
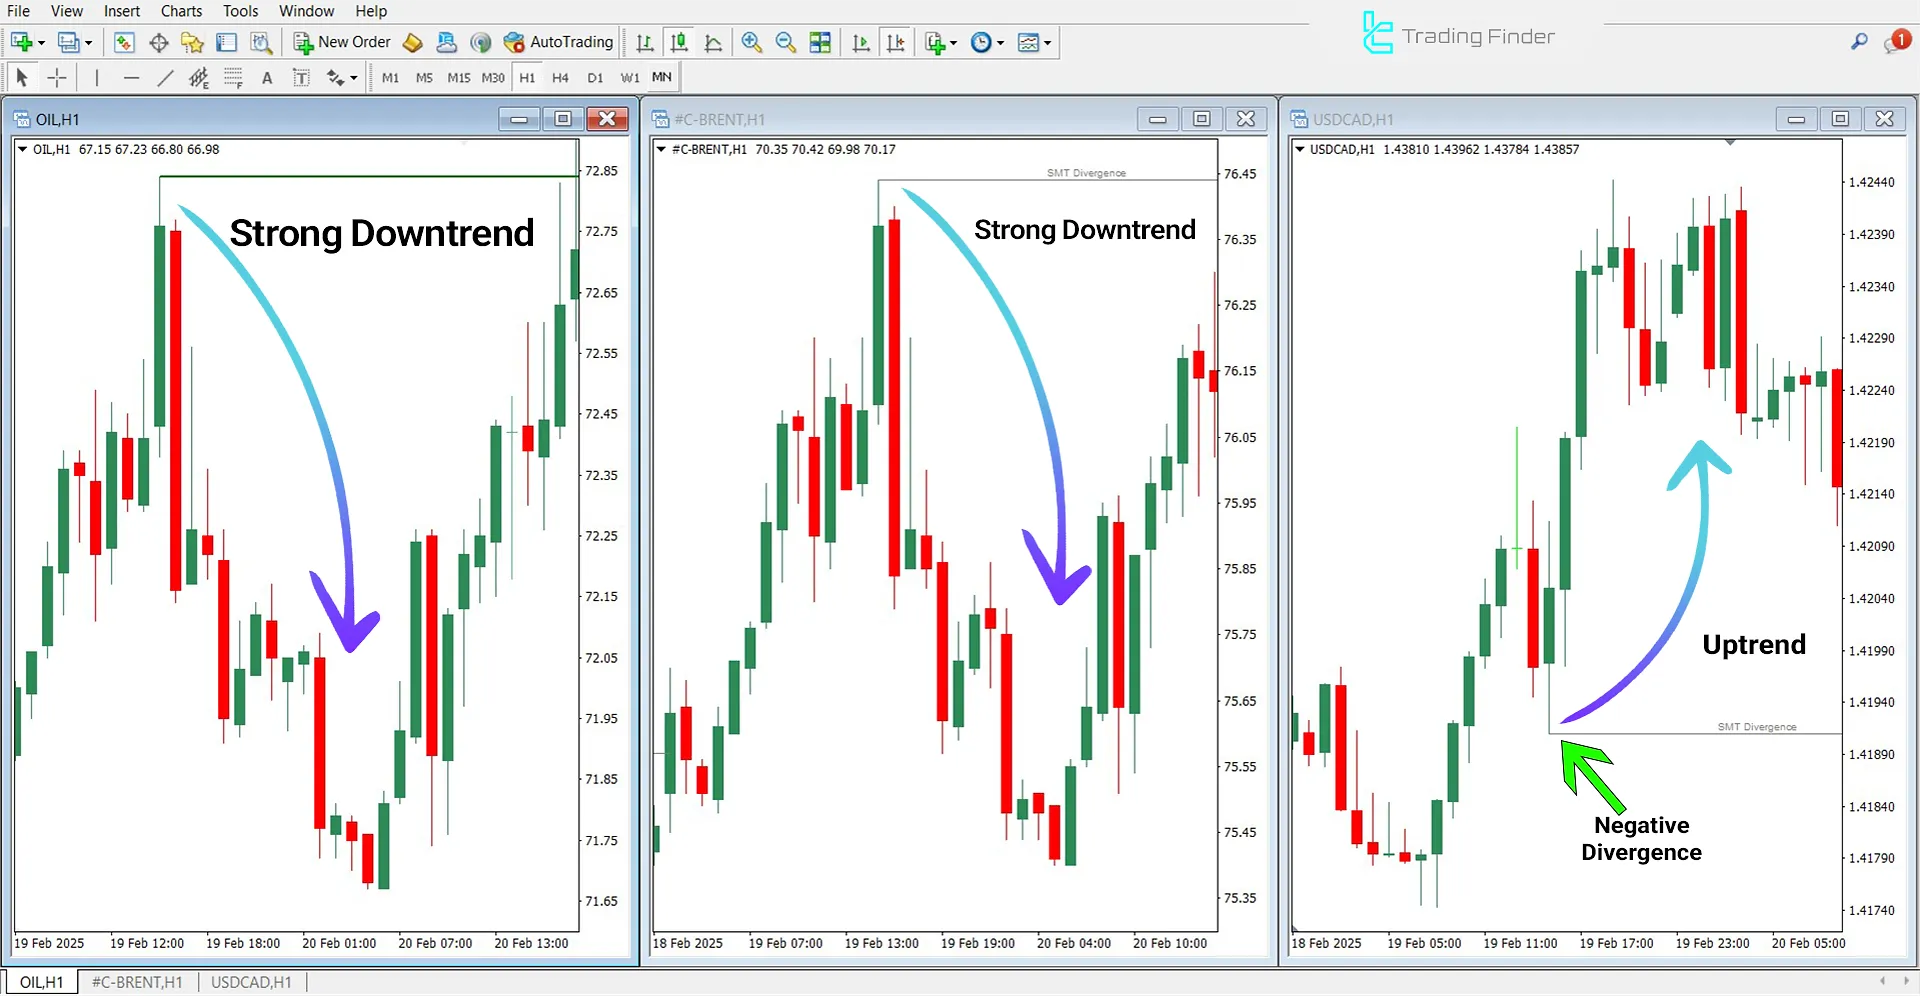
Indicator in an Uptrend
In a bullish trend, the Smart Money Divergence Indicator for Oil Index identifies divergence between crude oil, Brent crude oil, and the USD/CAD currency pair. As crude oil and Brent crude reach a peak and start a downward movement, the USD/CAD pair forms a lower low before reversing into an uptrend.
In this scenario, the breakout peak in Brent crude oil and USD/CAD is displayed in gray, while in the base asset (crude oil), it is highlighted in green, signaling a potential trend reversal.

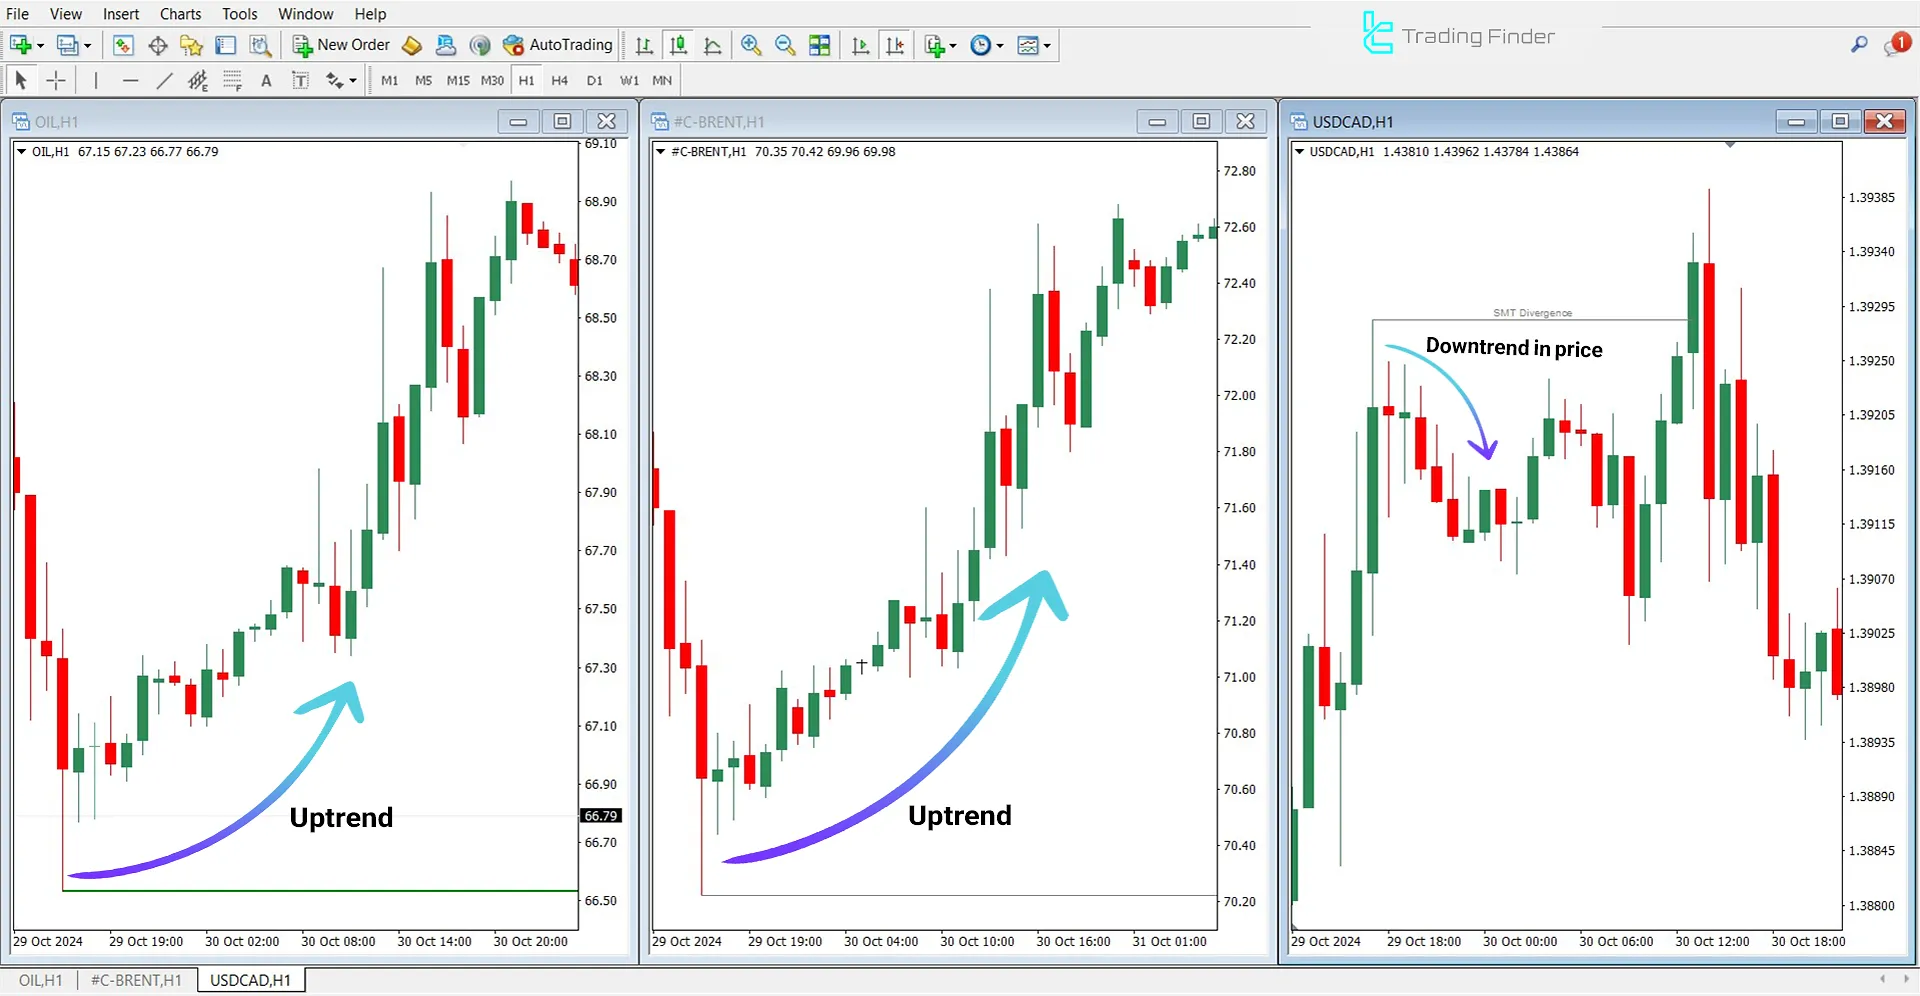
Indicator in a Downtrend
In a bearish trend, the Smart Money Divergence Indicator for Oil Index detects divergence between crude oil, Brent crude oil, and the USD/CAD currency pair. Here, crude oil and Brent crude create a bottom and initiate an uptrend, while USD/CAD moves in the opposite direction and experiences a price drop.
This inverse movement between oil prices and USD/CAD serves as a key signal for traders, helping them anticipate potential trend reversals and liquidity shifts in the market.

SMT Divergence Oil Indicator Settings
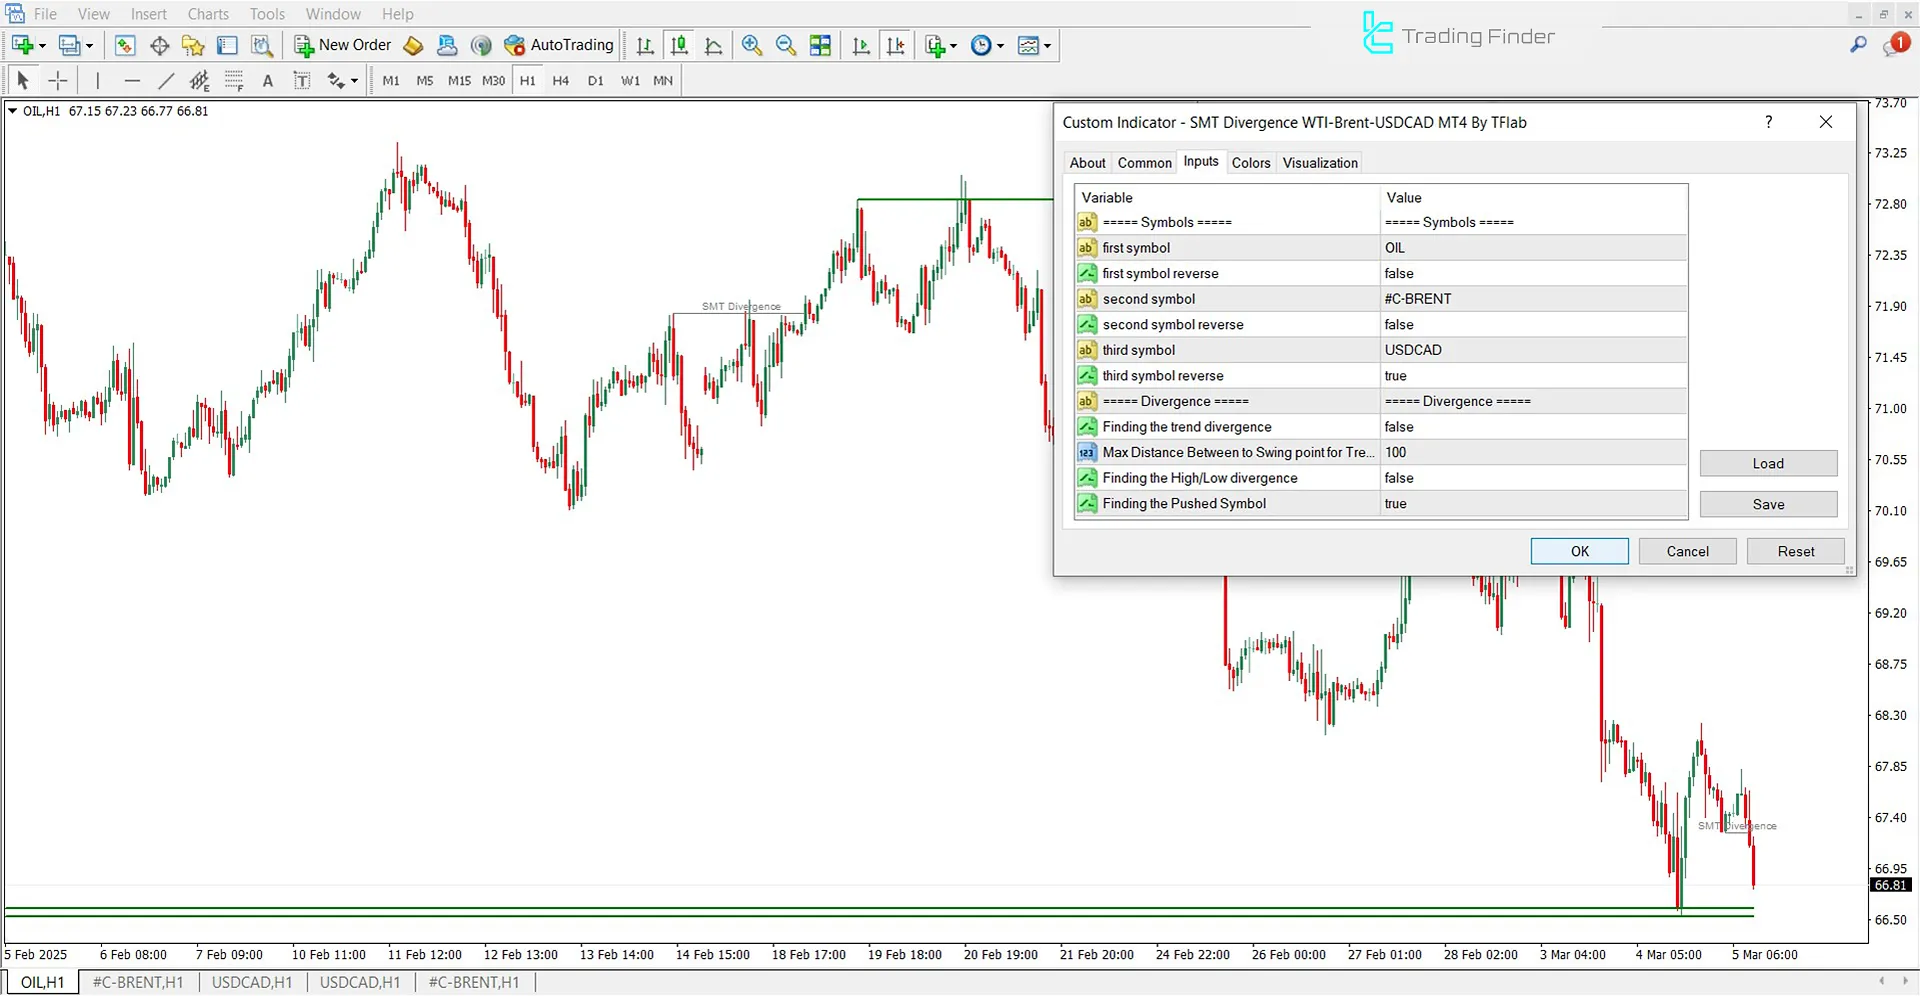
The image below showcases the full settings panel of the indicator, including sections like Display, Symbols, and more:

- First Symbol: Select the primary symbol
- Second Symbol: Select the secondary symbol
- Third Symbol: Select the tertiary symbol
- Finding the Trend Divergence: Locate trend divergences
- Max Distance Between Swing Points for Trend Divergence: Set the maximum distance for divergence detection
- Finding the High/Low Divergence: Identify SMT line intersections
- Finding the Pushed Symbol: Detect SMT line overlaps
Conclusion
The SMT Divergence Oil Indicator is a trading assistant in MetaTrader 4 that focuses on identifying divergences among related assets.
By analyzing price movements of both primary and secondary asset price movements, this indicator enhances traders’ ability to detect trends, spot reversal points, and anticipate potential market shifts.
SMT Divergence Oil MT4 PDF
SMT Divergence Oil MT4 PDF
Click to download SMT Divergence Oil MT4 PDFWhat is the SMT Divergence Oil Indicator?
It is a tool to identify divergences between energy assets such as oil and currency pairs.
How does the SMT Divergence Oil Indicator work?
It compares price movements across assets to detect positive or negative divergences.


