![SSL Channel Chart Alert Indicator for MetaTrader 4 Download – Free – [TFlab]](https://cdn.tradingfinder.com/image/281177/4-43-en-ssl-channel-chart-alert-mt4-1.webp)
![SSL Channel Chart Alert Indicator for MetaTrader 4 Download – Free – [TFlab] 0](https://cdn.tradingfinder.com/image/281177/4-43-en-ssl-channel-chart-alert-mt4-1.webp)
![SSL Channel Chart Alert Indicator for MetaTrader 4 Download – Free – [TFlab] 1](https://cdn.tradingfinder.com/image/281184/4-43-en-ssl-channel-chart-alert-mt4-2.webp)
![SSL Channel Chart Alert Indicator for MetaTrader 4 Download – Free – [TFlab] 2](https://cdn.tradingfinder.com/image/281188/4-43-en-ssl-channel-chart-alert-mt4-3.webp)
![SSL Channel Chart Alert Indicator for MetaTrader 4 Download – Free – [TFlab] 3](https://cdn.tradingfinder.com/image/281187/4-43-en-ssl-channel-chart-alert-mt4-4.webp)
The SSL Channel Chart Alert Indicator is one of the MetaTrader 4 indicators, designed based on a combination of Moving Averages (MA).
This indicator consists of two Moving Average lines (green and red) calculated based on Highs and Lows.
SSL Channel Chart Alert Indicator Specifications
The table below summarizes the key features of the SSL Channel Chart Alert Indicator.
Indicator Categories: | Support & Resistance MT4 Indicators Volatility MT4 Indicators Trading Assist MT4 Indicators |
Platforms: | MetaTrader 4 Indicators |
Trading Skills: | Elementary |
Indicator Types: | Reversal MT4 Indicators |
Timeframe: | Multi-Timeframe MT4 Indicators |
Trading Style: | Day Trading MT4 Indicators |
Trading Instruments: | Forward Market MT4 Indicators Stock Market MT4 Indicators Cryptocurrency MT4 Indicators Forex MT4 Indicators |
Indicator Overview
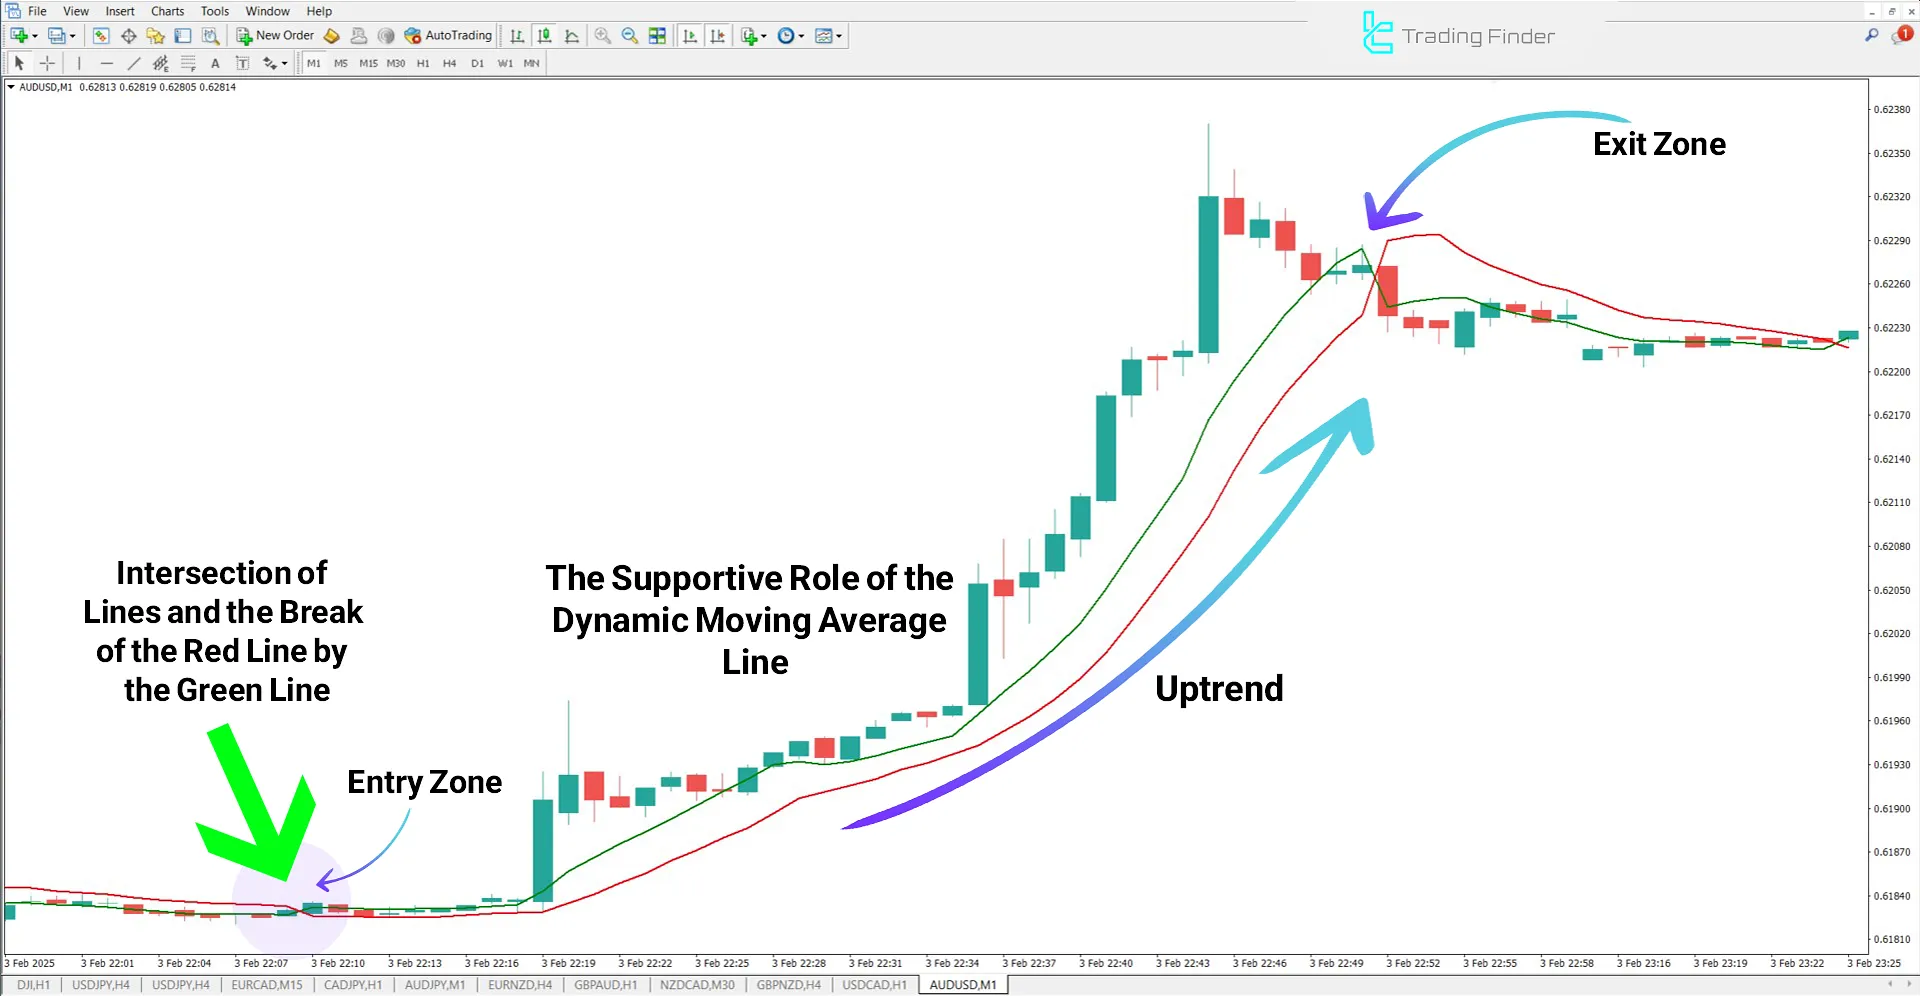
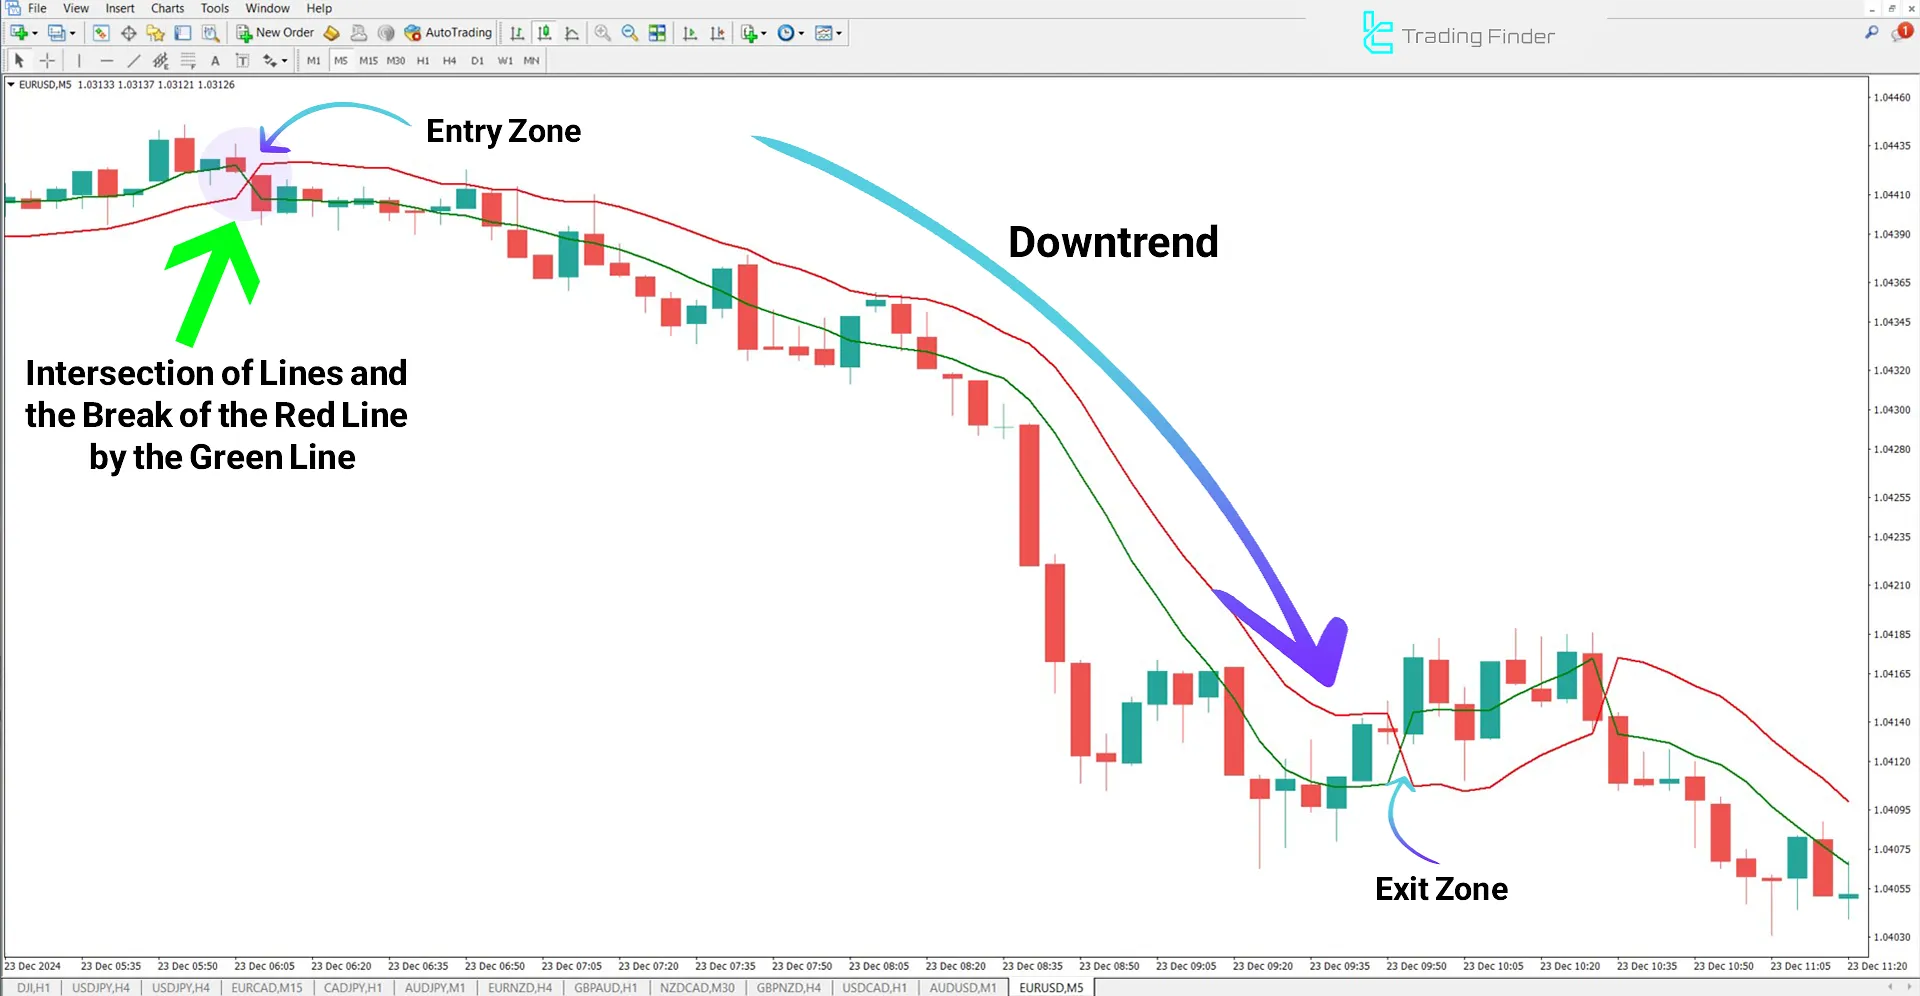
The SSL Channel Chart Alert Indicator generates buy and sell signals based on the crossovers of its Moving Average lines. When the green line crosses above the red line, it signals a buy. Conversely, when the green line crosses below the red line, it indicates a sell.
Additionally, these lines serve as dynamic support and resistance zones.
Bullish Market Scenario
To initiate a buy trade, the green line must cross above the red line. For example, in the AUD/USD currency pair chart, after this crossover, an uptrend formed, leading to a significant price increase.

Bearish Market Scenario
The following image shows the 5-minute chart of the EUR/USD currency pair. To execute a sell trade, the green line must cross below the red line.
After this crossover, traders enter sell positions and set their stop-losses above key levels to manage risk.

Indicator Settings
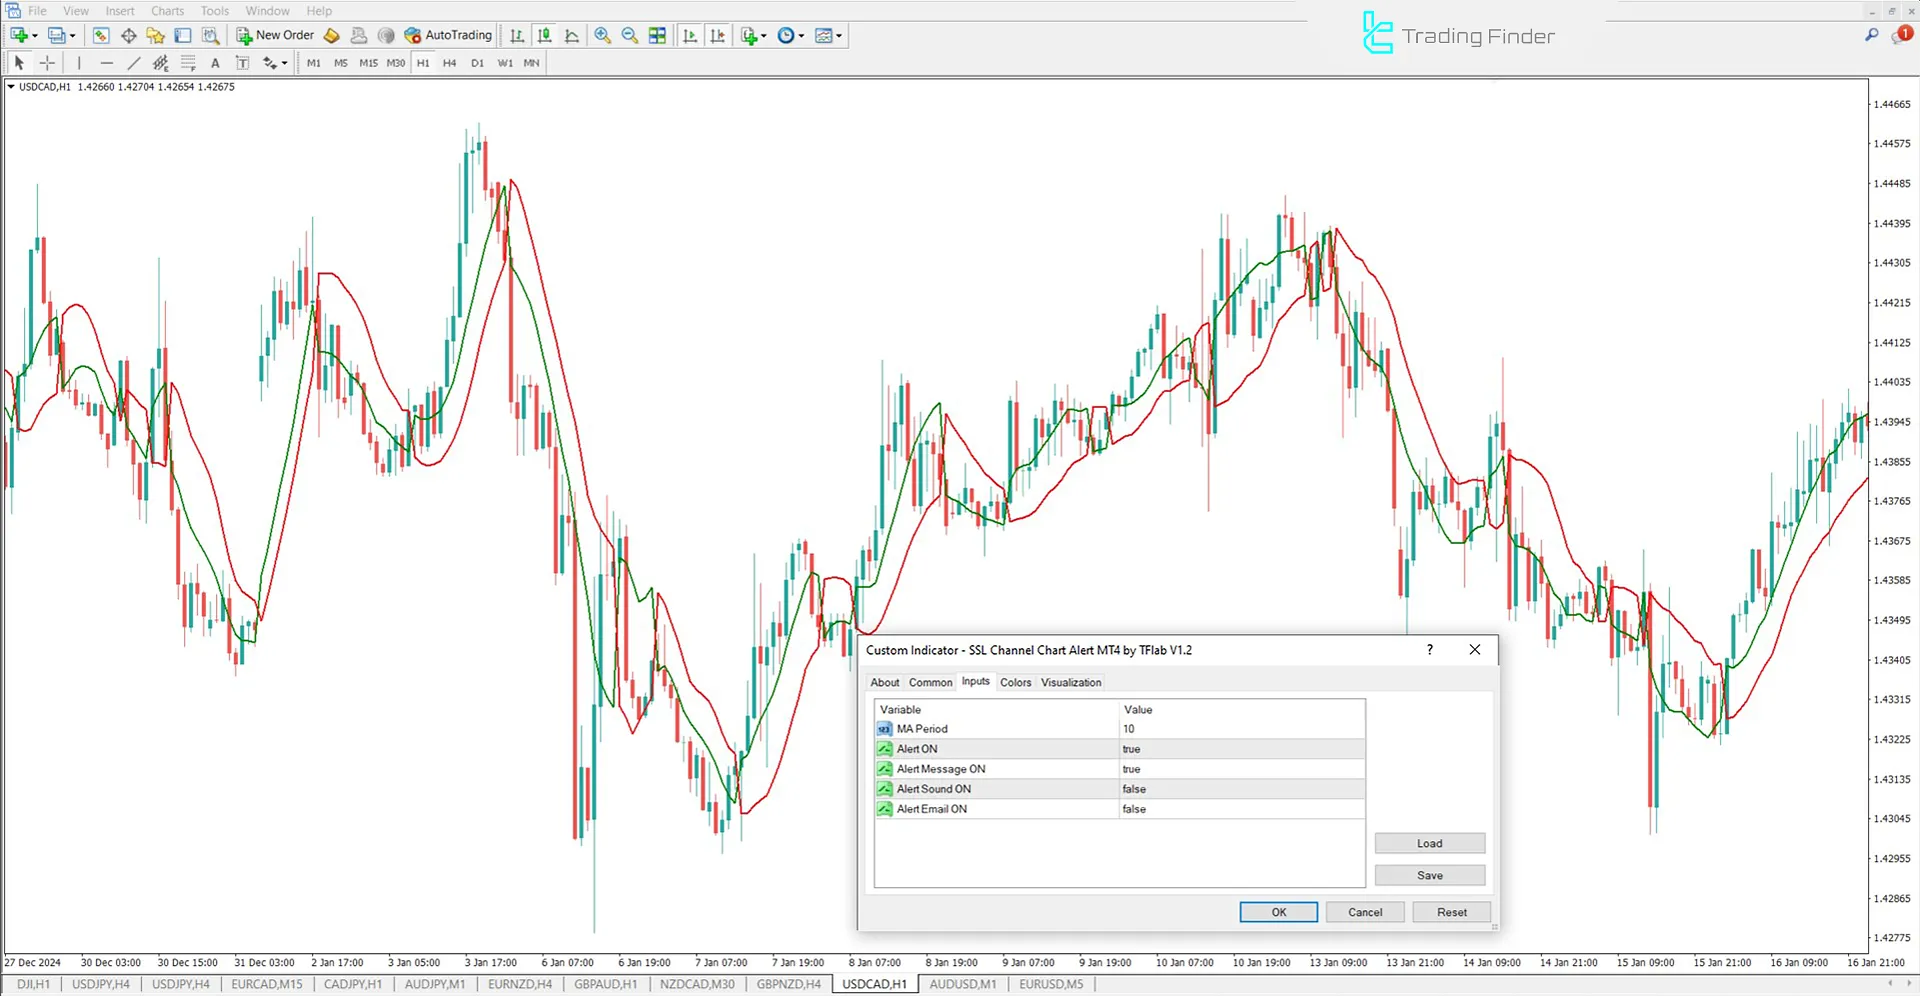
The image below displays the settings panel for the SSL Channel Chart Alert Indicator:

- MA Period: Define the calculation period
- Alert: Enable signal detection alerts
- Alert Message: Set a custom message for alerts
- Alert Sound: Choose a sound alert for signals
- Alert Email: Enable email alerts for signal notifications
Conclusion
The SSL Channel Chart Alert Indicator, as one of the trading assist indicators MetaTrader 4, is widely used for identifying entry and exit zones using two Moving Averages (green and red).
SSL Channel Chart Alert MT4 PDF
SSL Channel Chart Alert MT4 PDF
Click to download SSL Channel Chart Alert MT4 PDFWhat is the SSL Channel Chart Alert Indicator?
The SSL Channel Chart Alert Indicator is designed using two price-based Moving Averages and serves as an effective tool for identifying buy and sell signals in technical analysis.
How does the SSL Channel Chart issue buy and sell signals?
- When the green line crosses above the red line, it generates a Buy signal.
- When the green line crosses below the red line, it generates a Sell signal.


