![SSMT 4 Quarter Divergence Indicator MT4 – Free Download [TradingFinder]](https://cdn.tradingfinder.com/image/497766/2-122-en-ssmt-4quarter-divergence-mt4-1.webp)
![SSMT 4 Quarter Divergence Indicator MT4 – Free Download [TradingFinder] 0](https://cdn.tradingfinder.com/image/497766/2-122-en-ssmt-4quarter-divergence-mt4-1.webp)
![SSMT 4 Quarter Divergence Indicator MT4 – Free Download [TradingFinder] 1](https://cdn.tradingfinder.com/image/497776/2-122-en-ssmt-4quarter-divergence-mt4-2.webp)
![SSMT 4 Quarter Divergence Indicator MT4 – Free Download [TradingFinder] 2](https://cdn.tradingfinder.com/image/497780/2-122-en-ssmt-4quarter-divergence-mt4-3.webp)
![SSMT 4 Quarter Divergence Indicator MT4 – Free Download [TradingFinder] 3](https://cdn.tradingfinder.com/image/497779/2-122-en-ssmt-4quarter-divergence-mt4-4.webp)
The SSMT 4 Quarter Divergence Smart Money Sequential Divergence Indicator is designed based on advanced technical analysis concepts within the framework of market structure theory and smart money behavioral models.
Using precise time and structural analysis, this tool identifies divergence between correlated assets within the four quarterly timeframes (Q1–Q4).
The SSMT begins by selecting two correlated assets, such as NQ100 and US400. This correlation is a necessary prerequisite for the tool’s functionality.
SSMT 4 Quarter Divergence Indicator Table
General specifications of the SSMT 4 Quarter Divergence Indicator are presented in the table below.
Indicator Categories: | ICT MT4 Indicators Smart Money MT4 Indicators Trading Assist MT4 Indicators |
Platforms: | MetaTrader 4 Indicators |
Trading Skills: | Advanced |
Indicator Types: | Reversal MT4 Indicators |
Timeframe: | Multi-Timeframe MT4 Indicators |
Trading Style: | Intraday MT4 Indicators |
Trading Instruments: | Stock Market MT4 Indicators Cryptocurrency MT4 Indicators Forex MT4 Indicators |
SSMT 4Quarter Divergence Indicator Overview
The SSMT 4 Quarter Divergence Indicator helps identify critical phase-shift zones by analyzing structural divergence between correlated assets and aligning it with market time cycles.
The emergence of divergence during transitions between quarters increases the likelihood of smart money entry and trend reversal.
Final confirmation is obtained through the pivot point and market structure break in lower timeframes.
This combination provides precise entry points with controlled risk in premium or discount zones, indicated by two arrows – blue for bullish, red for bearish.
Indicator in Bullish Trend
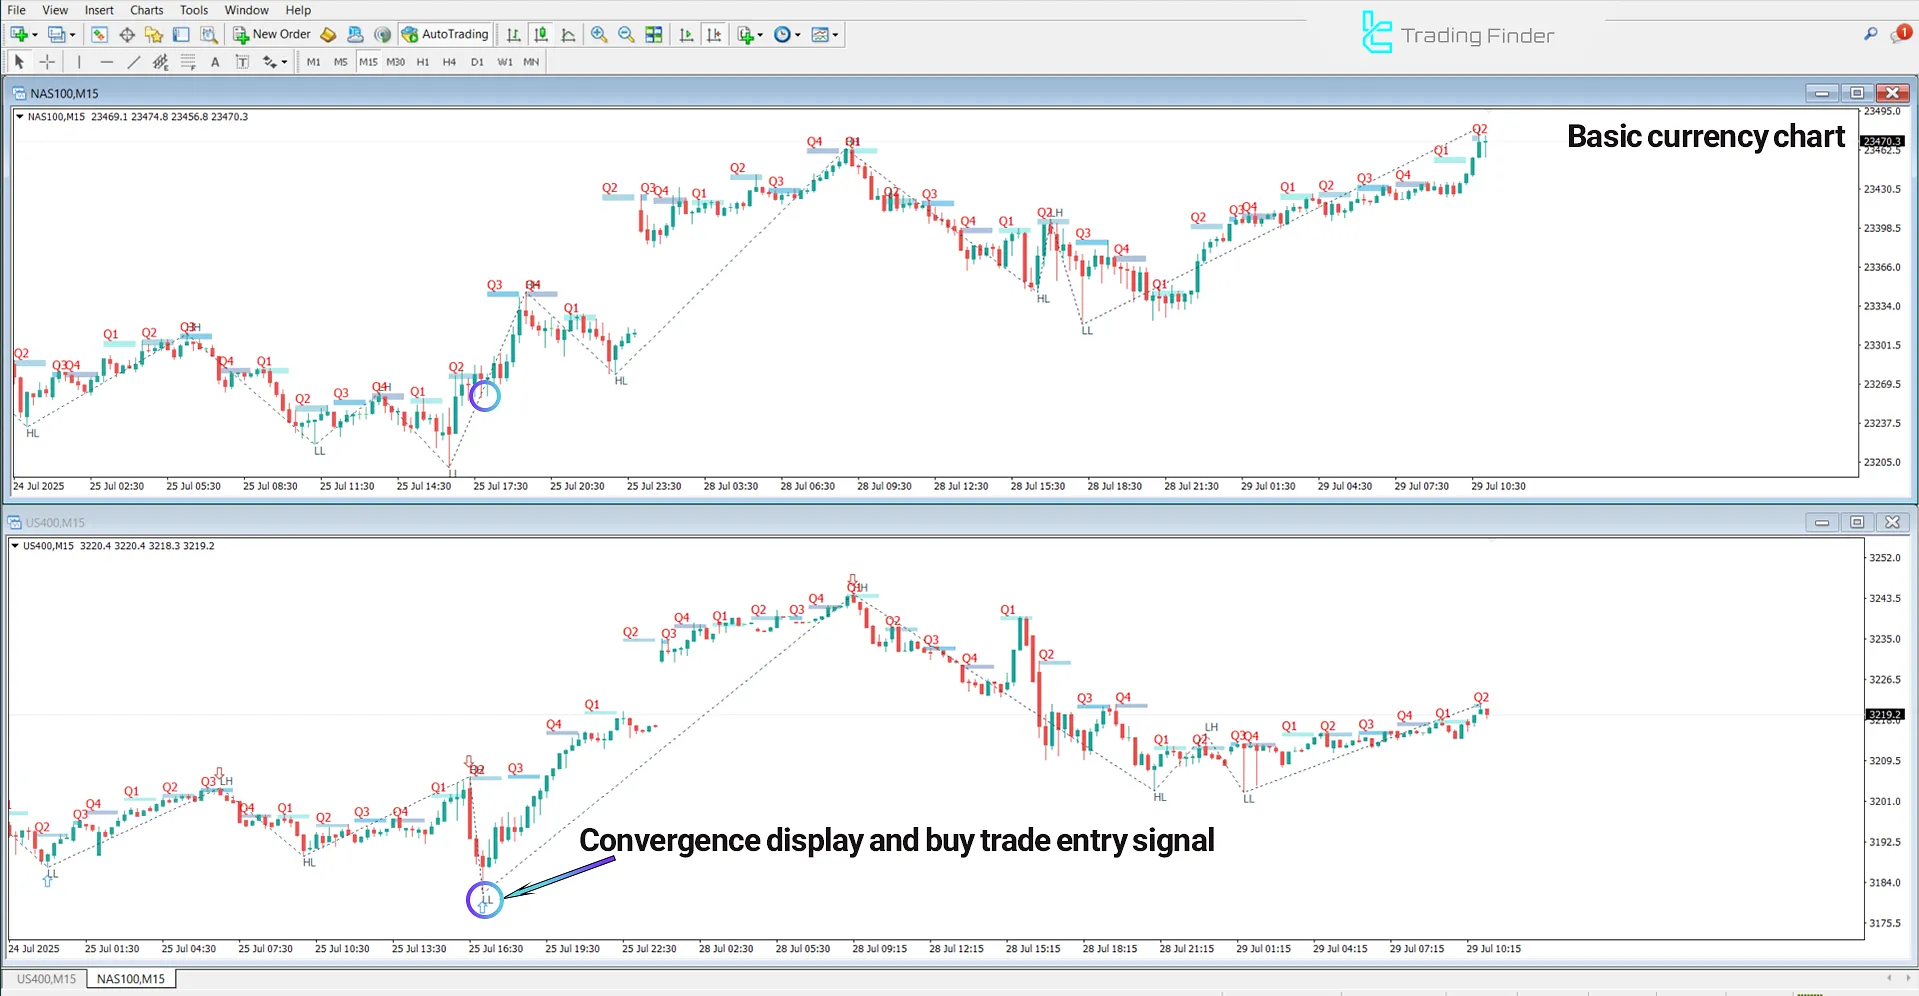
In the bullish SSMT scenario, time divergence forms between the NAS100 and US400 charts in the 5-minute timeframe.
In this setup, the US400 index breaks the previous swing low, while the NAS100 remains structurally intact.
This structural mismatch signals that smart money is absorbing selling pressure.
With confirmation of market reversal through a bullish candlestick and a structure break in the lower timeframe, ideal buy opportunities arise, marked by the blue arrow.

Indicator in Bearish Trend
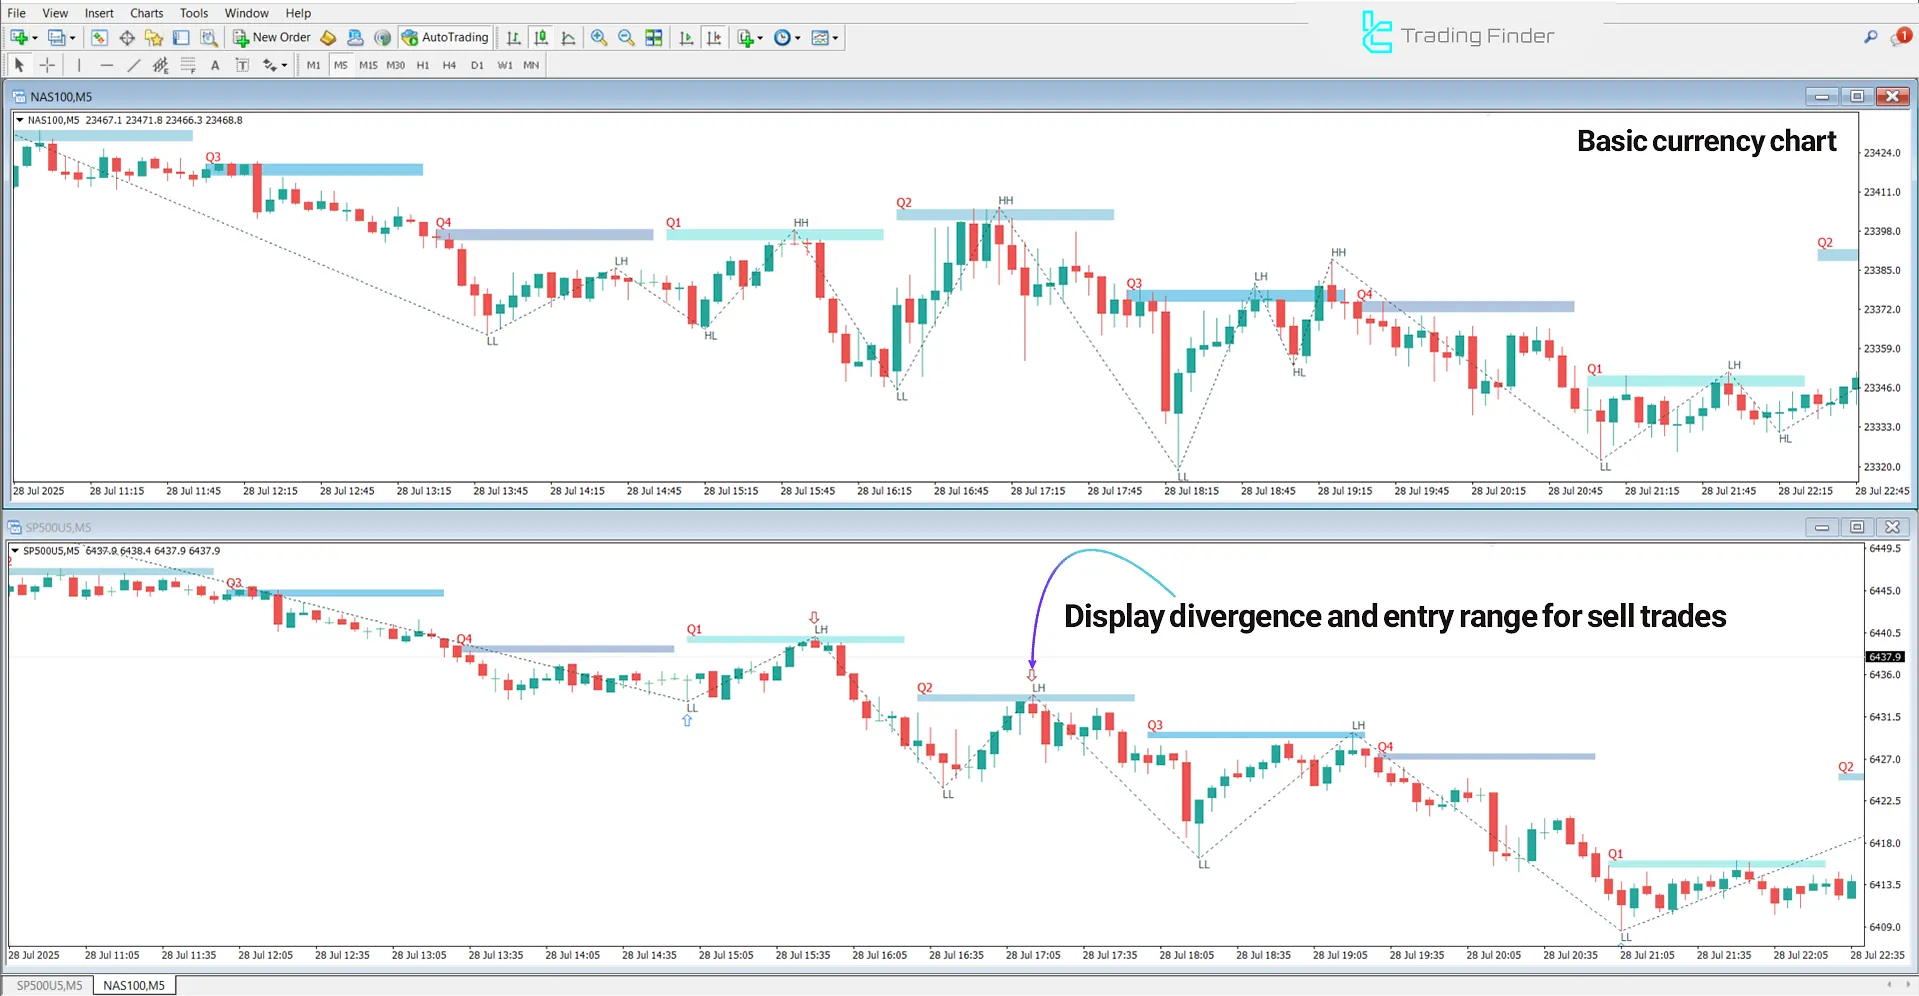
In the bearish SSMT scenario, time divergence occurs between the Nasdaq 100 and S&P 500 when the S&P 500 breaks the previous quarter’s swing high, but the Nasdaq 100 fails to confirm.
This indicates weakening buying pressure and a gradual smart money exit from the market. Upon confirmation of a structure break by a strong bearish candlestick, a high-probability short setup is formed.

SSMT 4 Quarter Divergence Settings
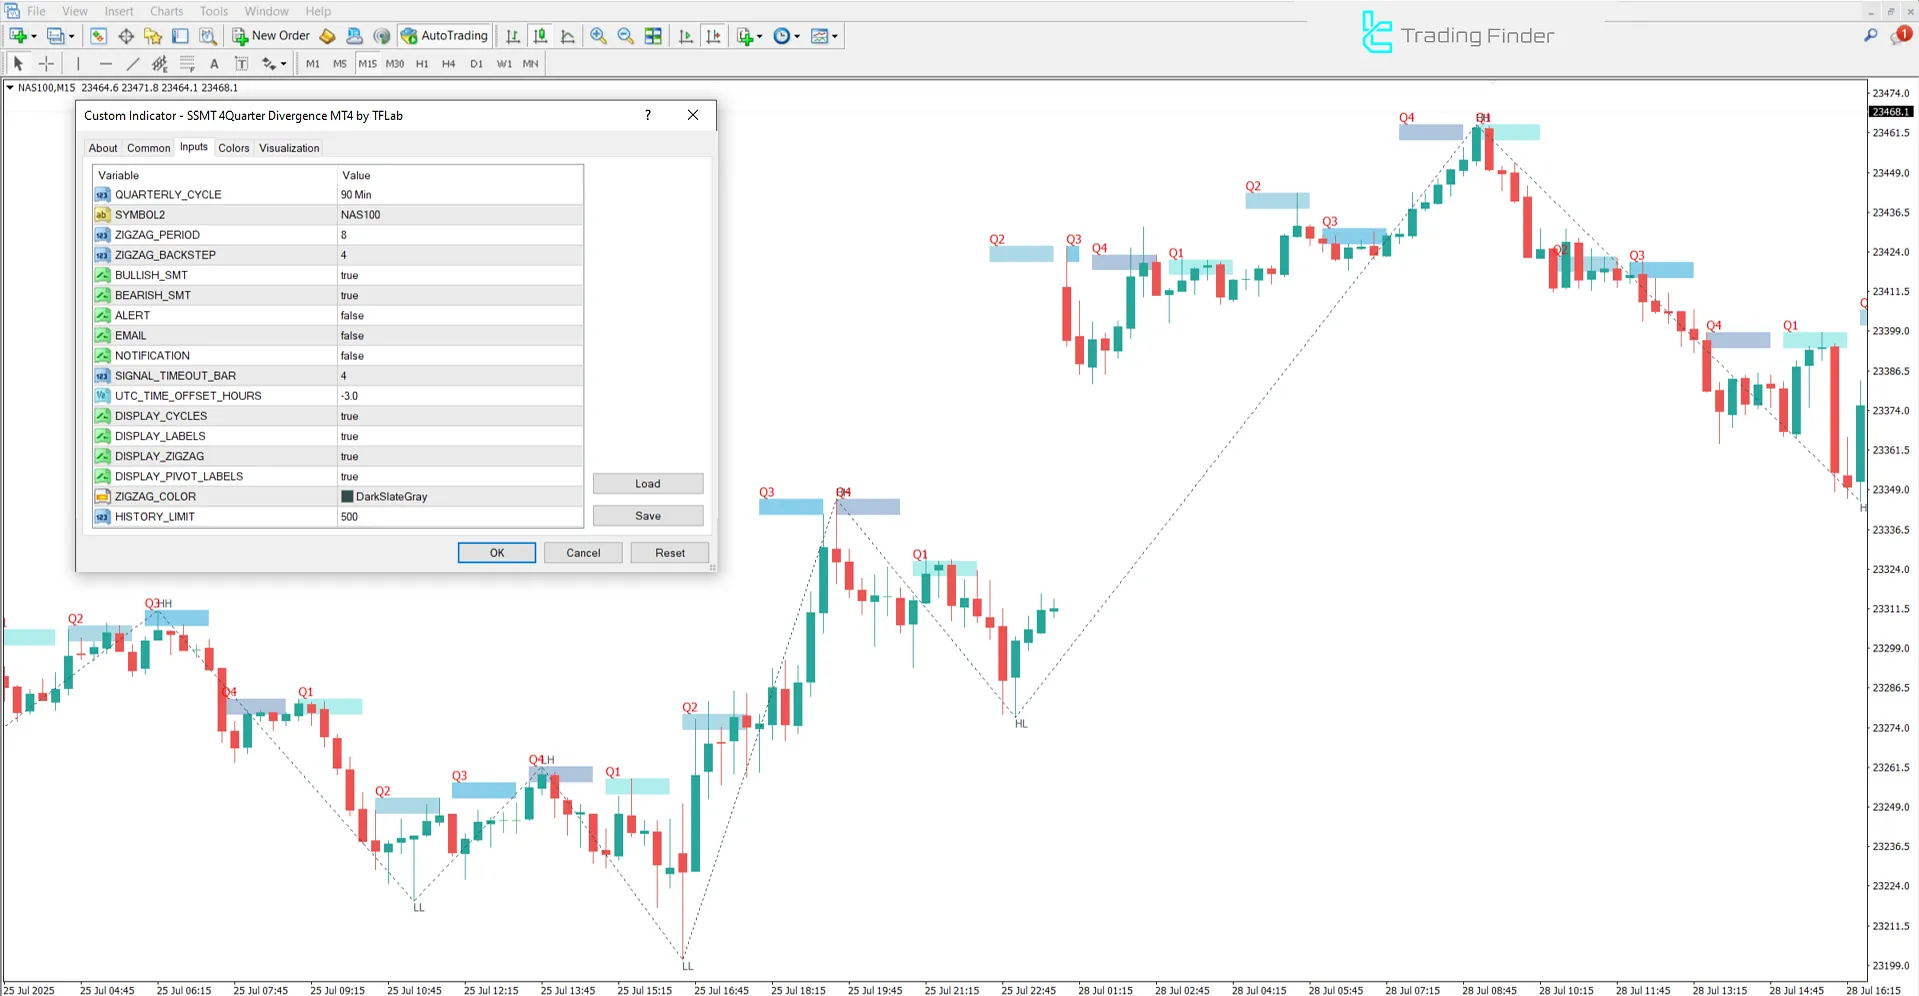
The image below shows the settings panel for the SSMT 4 Quarter Divergence Indicator:

- QUARTERLY CYCLE: Type of quarterly time division
- SYMBOL2: Symbol of the second asset
- ZIGZAG PERIOD: Zigzag sensitivity period
- ZIGZAG BACKSTEP: Number of retracement candles needed to confirm a pivot in the zigzag algorithm
- BULLISH SMT: Bullish SMT divergence signal
- BEARISH SMT: Bearish SMT divergence signal
- ALERT: Alert setting
- EMAIL: Send email notification
- NOTIFICATION: Send push notification
- SIGNAL TIMEOUT BAR: Duration of signal in number of candles
- UTC TIME OFFSET HOURS: Time offset adjustment for correct alert timing
- DISPLAY CYCLES: Visual display of quarterly cycles
- DISPLAY LABELS: Display of signal labels
- DISPLAY ZIGZAG: Graphical display of zigzag lines on a chart
- DISPLAY PIVOT LABELS: Display of pivot-related labels
- ZIGZAG COLOR: Color selection for zigzag lines
- HISTORY LIMIT: Limit on the number of indicator candles for analysis and signal display
Conclusion
In the SSMT 4 Quarter Divergence tool, a quarter refers to dividing a period (e.g., a day or a week) into four equal parts for analyzing price behavior in sequential market phases.
This time structure enables precise identification of divergence between correlated assets.
Market phase shifts usually accompany divergences occurring between quarters; therefore, quarterly analysis plays a key role in detecting smart money entry or exit.
SSMT 4 Quarter Divergence Indicator MT4 PDF
SSMT 4 Quarter Divergence Indicator MT4 PDF
Click to download SSMT 4 Quarter Divergence Indicator MT4 PDFWhat type of divergence does the SSMT 4Quarter Divergence Indicator identify?
This trading tool identifies structural/time divergence between two correlated assets.
What is the role of Quarterly Cycles in the SSMT 4Quarter Divergence Indicator?
In this indicator, dividing timeframes into four quarters provides a systematic framework for market behavior analysis and serves as the basis for detecting phase shifts and divergence.


