![Stochastic RSI Indicator for MetaTrader4 Download - Free - [TradingFinder]](https://cdn.tradingfinder.com/image/105470/10-12-en-stochastic-rsi-mt4.webp)
![Stochastic RSI Indicator for MetaTrader4 Download - Free - [TradingFinder] 0](https://cdn.tradingfinder.com/image/105470/10-12-en-stochastic-rsi-mt4.webp)
![Stochastic RSI Indicator for MetaTrader4 Download - Free - [TradingFinder] 1](https://cdn.tradingfinder.com/image/30937/10-12-en-stochastic-rsi-mt4-02.avif)
![Stochastic RSI Indicator for MetaTrader4 Download - Free - [TradingFinder] 2](https://cdn.tradingfinder.com/image/30939/10-12-en-stochastic-rsi-mt4-03.avif)
![Stochastic RSI Indicator for MetaTrader4 Download - Free - [TradingFinder] 3](https://cdn.tradingfinder.com/image/30942/10-12-en-stochastic-rsi-mt4-04.avif)
On June 25, 2025, in version 2, alert/notification functionality was added to this indicator
The Stochastic RSI (StochRSI) indicator is one of the MetaTrader 4 indicators, which combines two popular indicators: The Relative Strength Index (RSI) and the Stochastic Oscillator.
This indicator is designed to identify overbought and oversold points with higher sensitivity than regular RSI. TheStochRSI indicator consists of a blue line representing the RSI and a red dashed line representing the %D line of the Stochastic indicator.
Values below 20 are considered oversold, and values above 80 are considered overbought. A trading signal is generated whenever the indicator curve reaches theoverbought or oversold zones, and the two curves cross.
Indicator Table
Indicator Categories: | Oscillators MT4 Indicators Signal & Forecast MT4 Indicators Currency Strength MT4 Indicators |
Platforms: | MetaTrader 4 Indicators |
Trading Skills: | Elementary |
Indicator Types: | Overbought and Oversold MT4 Indicators Reversal MT4 Indicators |
Timeframe: | Multi-Timeframe MT4 Indicators |
Trading Style: | Day Trading MT4 Indicators Fast Scalper MT4 Indicators Scalper MT4 Indicators Swing Trading MT4 Indicators |
Trading Instruments: | Share Stocks MT4 Indicators Stock Market MT4 Indicators Cryptocurrency MT4 Indicators Forex MT4 Indicators |
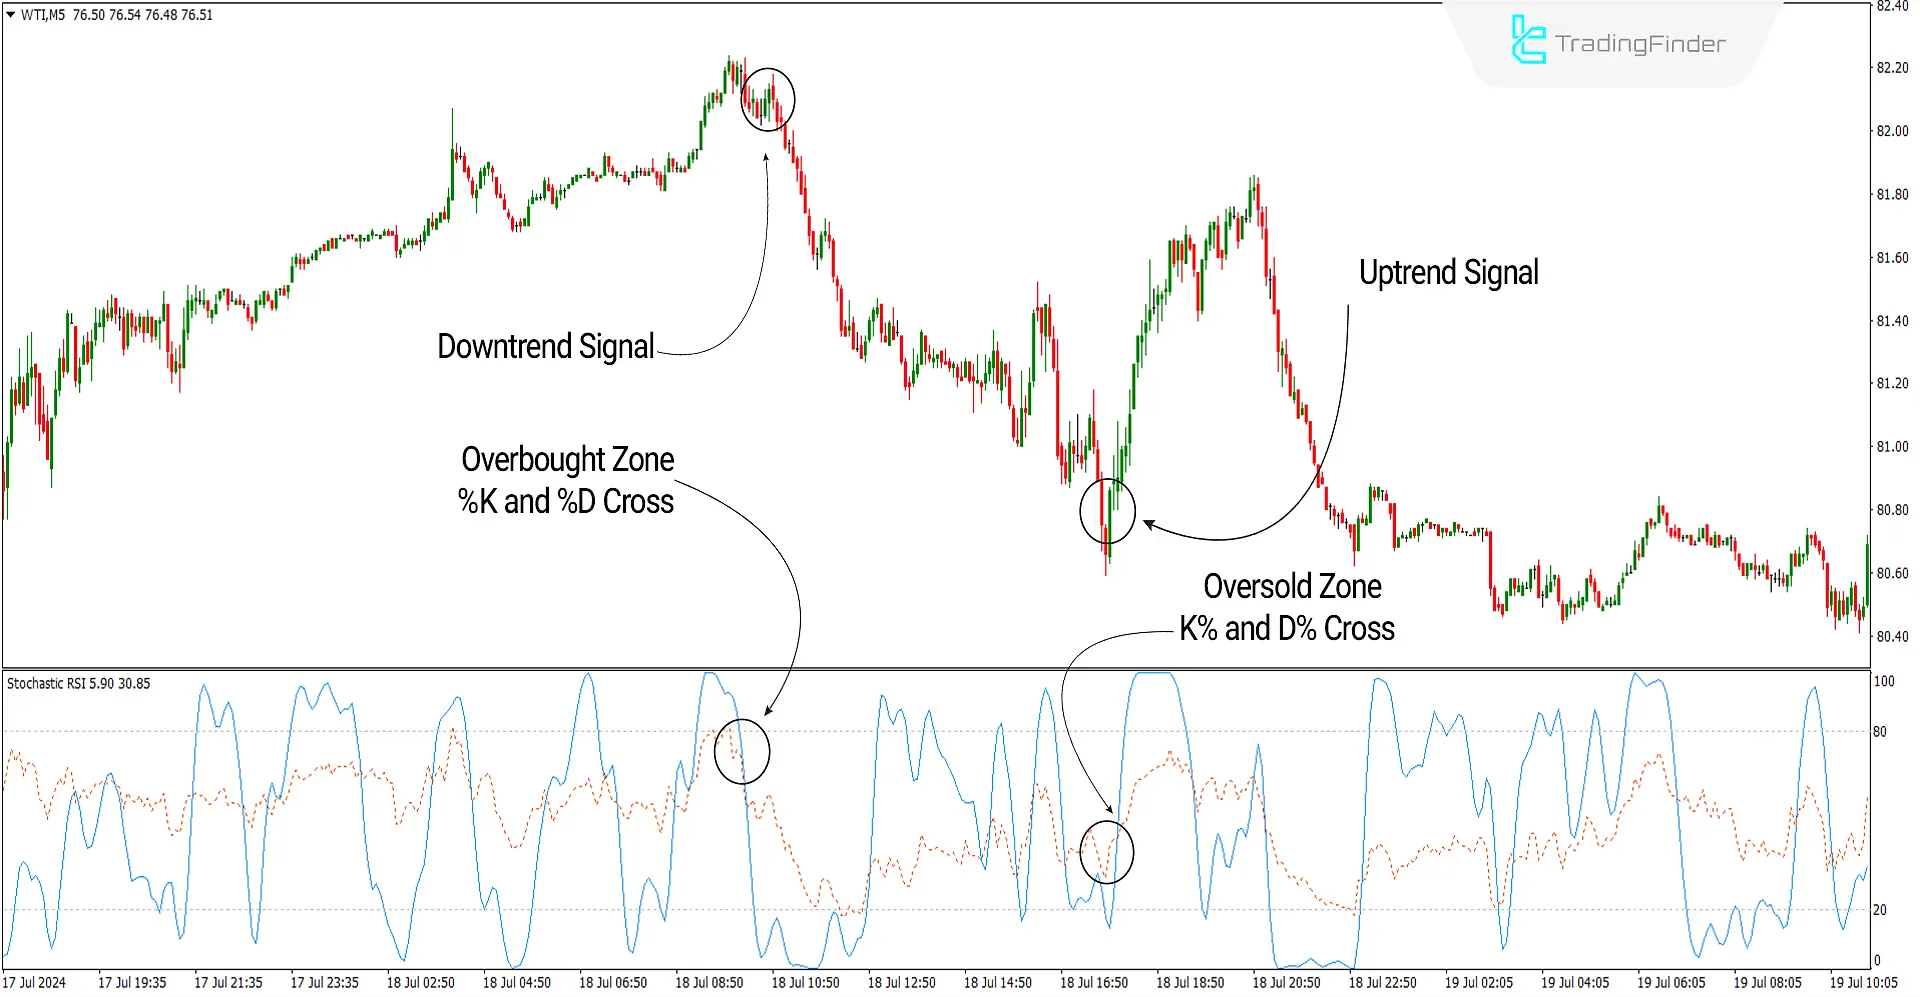
In the image below, the price chart of Texas Crude Oil with the symbol WTI is shown in a 5-minute time frame. On the left side of the image, the MT4 signal and forecast indicator has reached the overbought zone, and the two lines (K%) and (D%) cross each other downward.
Under these conditions, adowntrend signal and selling opportunities are issued. On the right side of the image, the price has reached the oversold zone, and the two lines (K%) and (D%) cross each other upward. In this condition, an uptrend signal and buying opportunities are issued.

Overview
The Stochastic RSI (StochRSI) indicator is one of the tools of Technical Analysis used to identify trends and price reversals in financial markets.
This indicator can help traders identify points where the price is overbought or oversold. This indicator can be combined with other tools and analytical methods, such as static and dynamic Support and Resistance levels, to enhance its effectiveness.
Uptrend Signal Conditions of the Indicator (Buy Position)
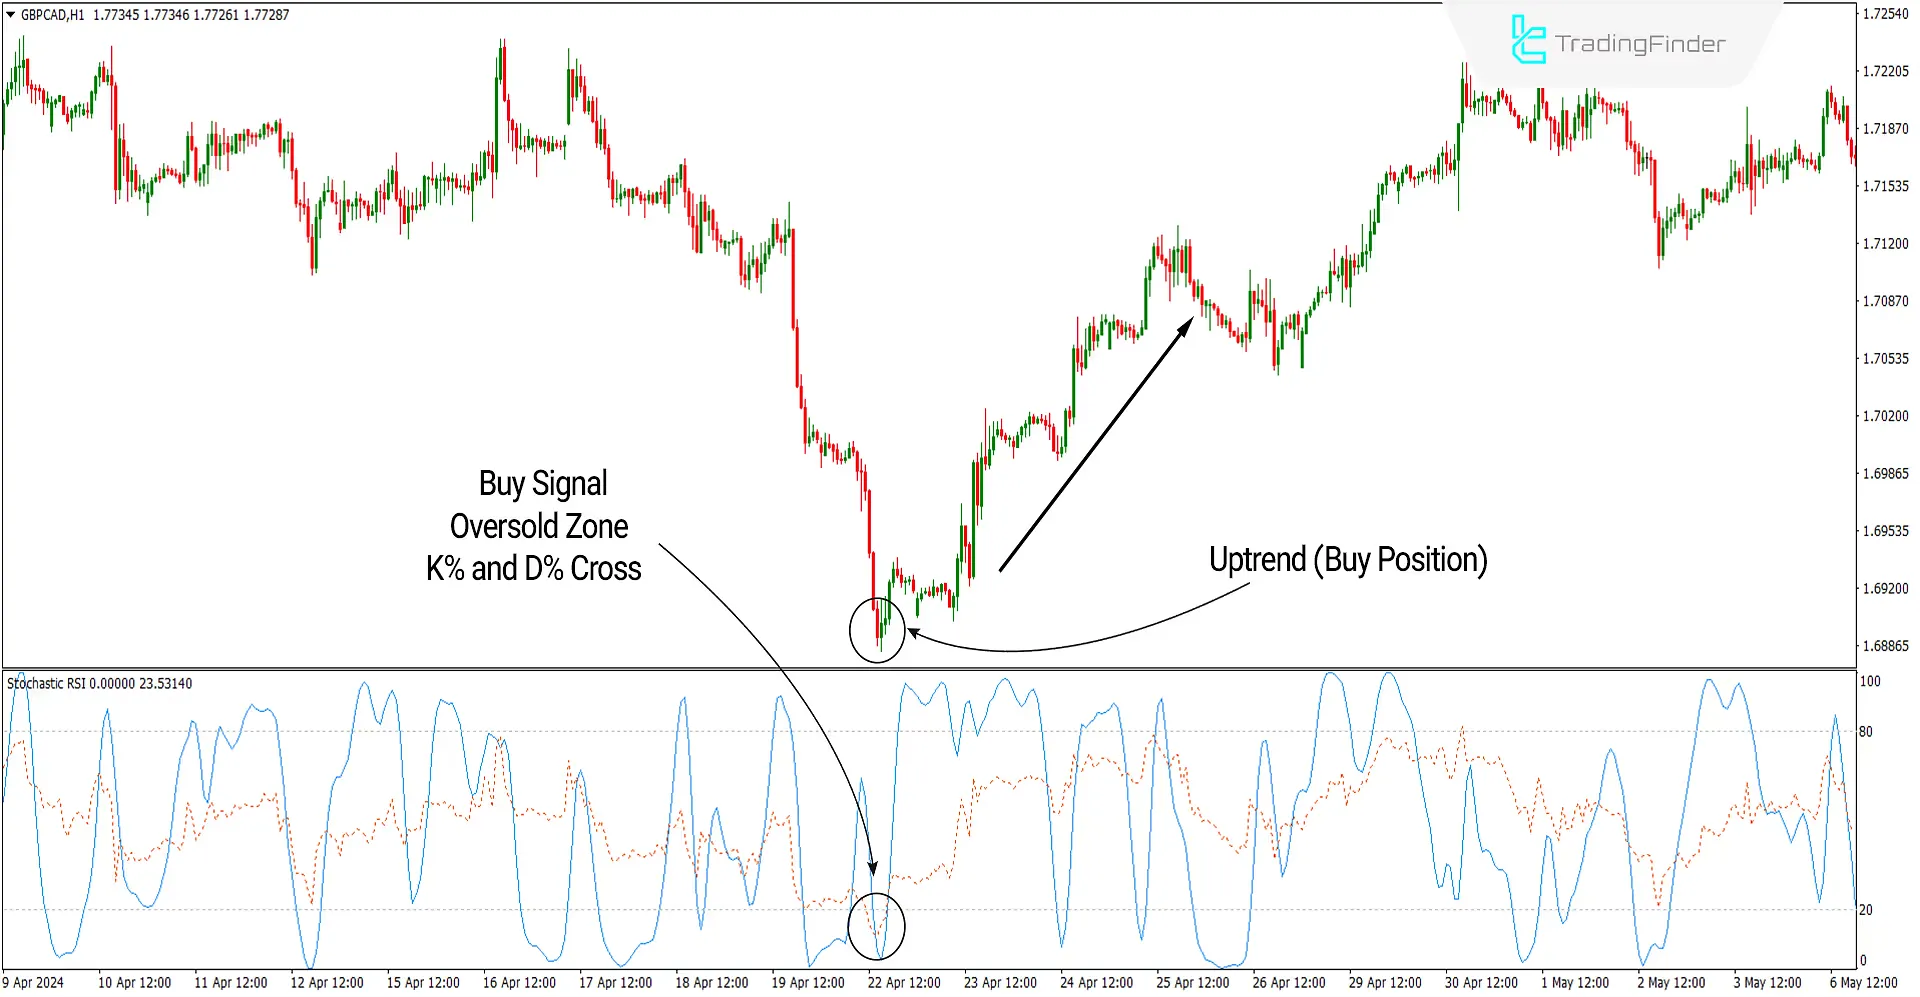
In the image below, the price chart of the GBP to CAD currency pair with the symbol GBPCAD is shown in a 1-hour time frame.
The indicator has reached the oversold zone, and the two lines(K%) and (D%) cross each other upward. Under these conditions, an uptrend signal is issued, and one can look for buying opportunities.

Downtrend Signal Conditions of the Indicator (Sell Positions)
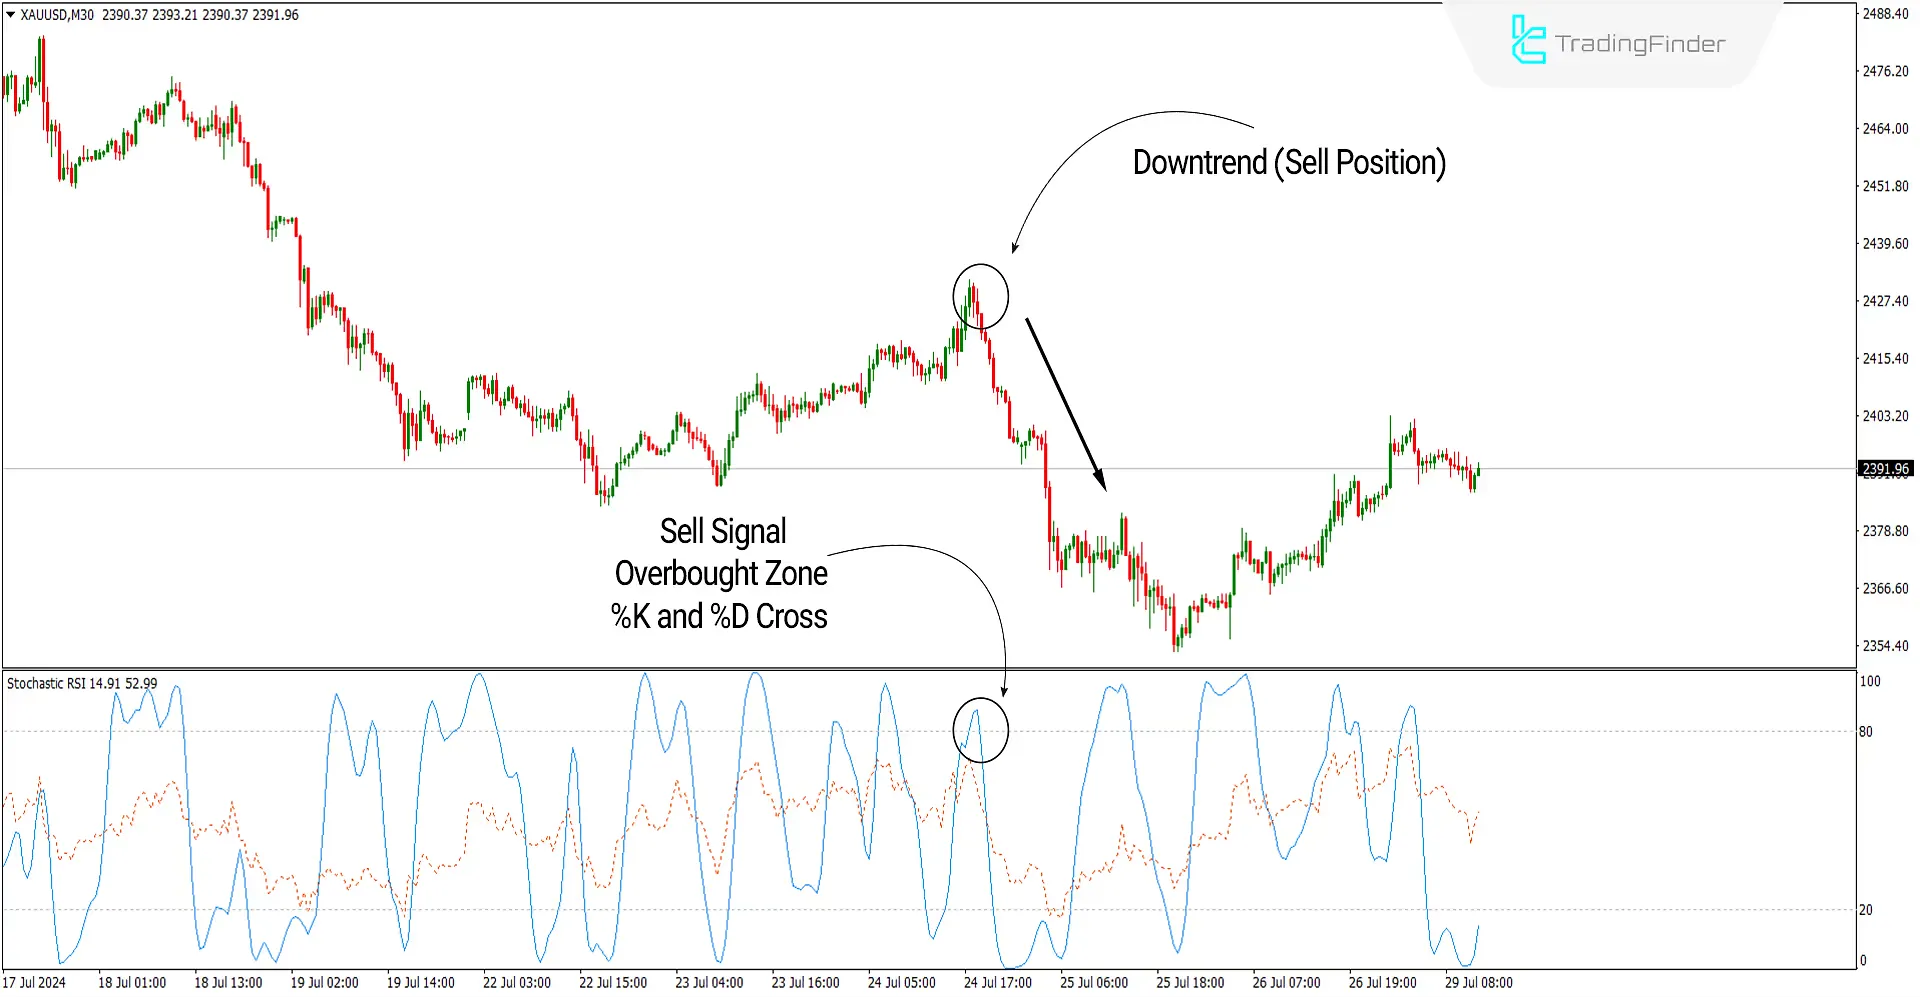
In the image below, the price chart of Gold to USD with the symbol XAUUSD is shown in a 30-minute time frame.
The indicator has reached the overbought zone, and the two lines(K%) and (D%) cross each other downward. Under these conditions, a downtrend signal is issued, and one can look for selling opportunities.

StochRSI Indicator Settings

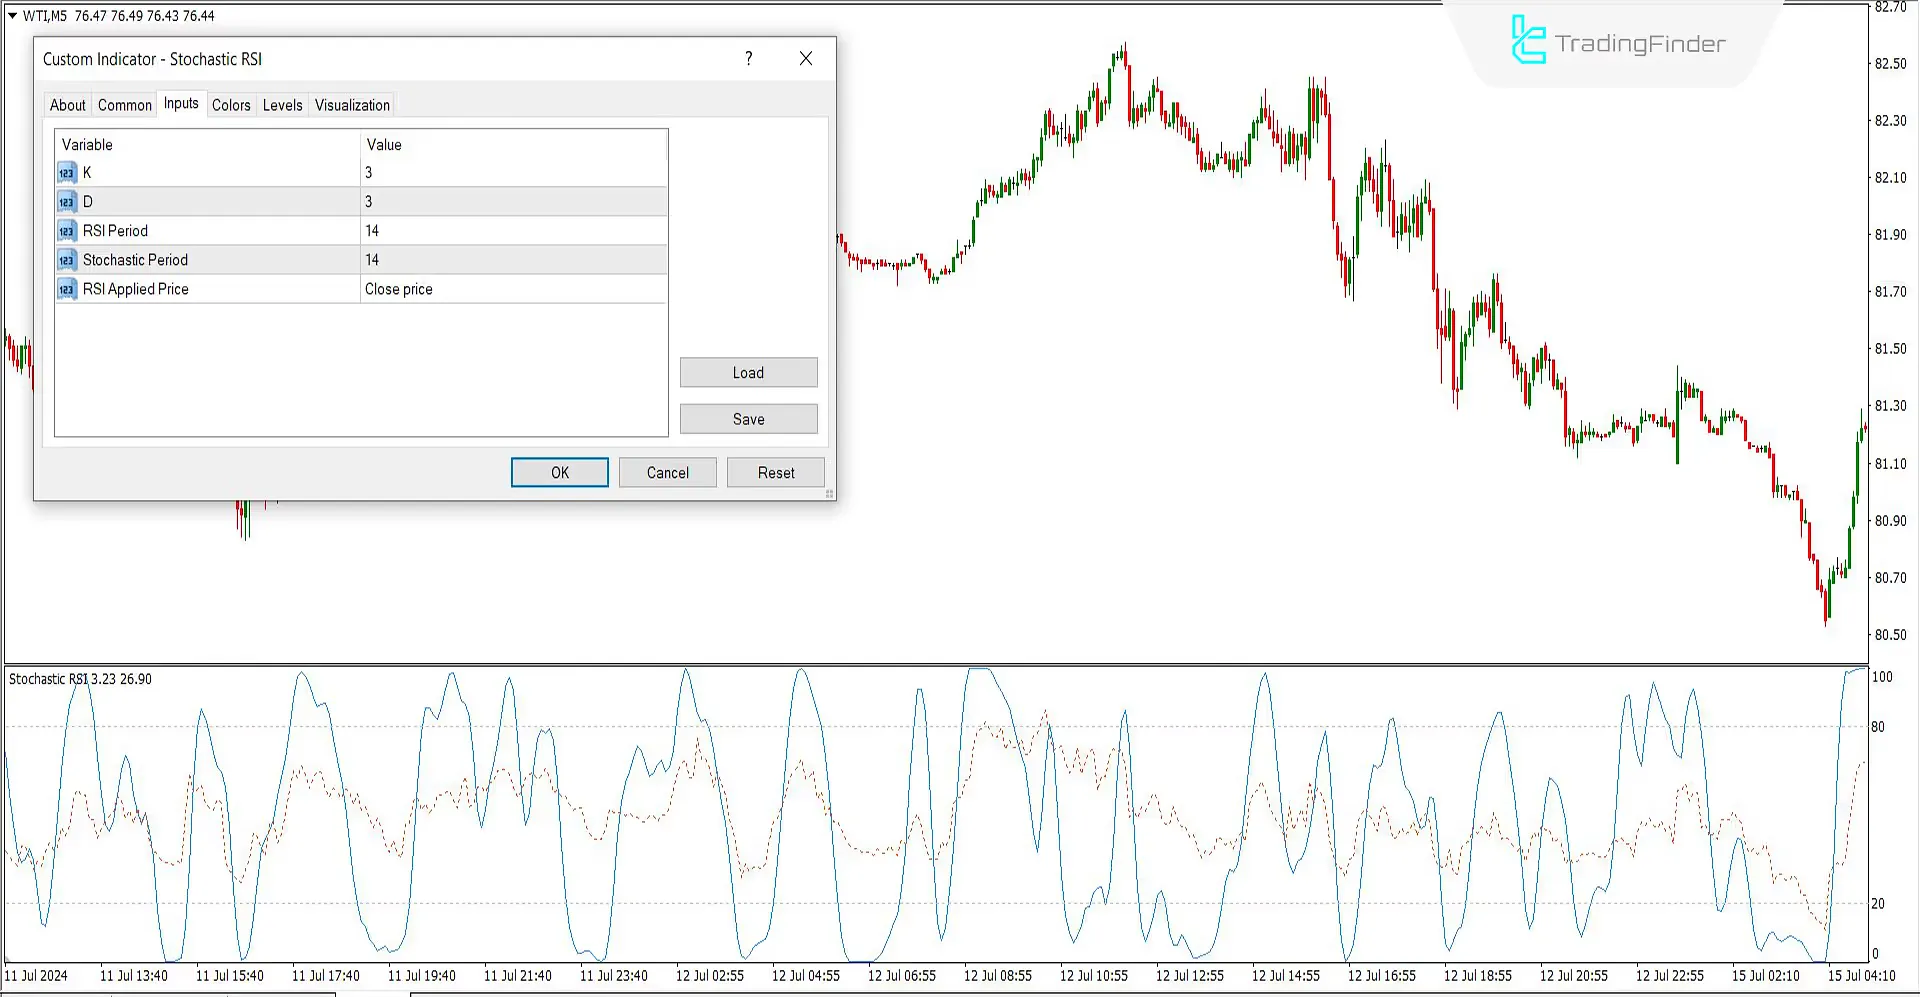
- K: The main line in the Stochastic indicator equals 3.
- D: The moving average line in Stochastic equals 3.
- RSI Period: The RSI indicator period equals 14.
- Stochastic Period: The Stochastic indicator period equals 14.
- RSI Applied Price: The calculation criterion for the RSI indicator is based on the Close Price.
To install, use, and change the settings of this indicator in MetaTrader 4, the Trading Finder Indicators Installation article will be a comprehensive guide for you.
Conclusion
The Stochastic RSI indicator generates more signals than the regular RSI, helping identify price changes faster.
By combining theStochastic RSI with other technical analysis tools, such as Moving Averages, the accuracy of the signals can be increased, as this indicator's high sensitivity might result in more false signals compared to the regular RSI.
Stochastic RSI MT4 PDF
Stochastic RSI MT4 PDF
Click to download Stochastic RSI MT4 PDFHow to use Stochastic RSI in trading?
This indicator can identify overbought and oversold points, confirm trends, and identify price reversals.
What is Stochastic RSI?
The Stochastic RSI is a technical analysis tool that combines the Stochastic Oscillator and the Relative Strength Index (RSI) to identify overbought and oversold conditions.


