![Support & Resistance Breakout Indicator for MT4 Download - Free - [TFlab]](https://cdn.tradingfinder.com/image/105140/11-5-en-support-resistance-breakout-arrow-mt4.webp)
![Support & Resistance Breakout Indicator for MT4 Download - Free - [TFlab] 0](https://cdn.tradingfinder.com/image/105140/11-5-en-support-resistance-breakout-arrow-mt4.webp)
![Support & Resistance Breakout Indicator for MT4 Download - Free - [TFlab] 1](https://cdn.tradingfinder.com/image/2140/11-05-en-support-resisrance-break-out-mt4-02-avif)
![Support & Resistance Breakout Indicator for MT4 Download - Free - [TFlab] 2](https://cdn.tradingfinder.com/image/2139/11-05-en-support-resisrance-break-out-mt4-03-avif)
![Support & Resistance Breakout Indicator for MT4 Download - Free - [TFlab] 3](https://cdn.tradingfinder.com/image/2141/11-05-en-support-resisrance-break-out-mt4-04-avif)
The Support and Resistance Breakout in MetaTrader 4 Indicator (MT4) identifies pivot points and determines support and resistance levels.
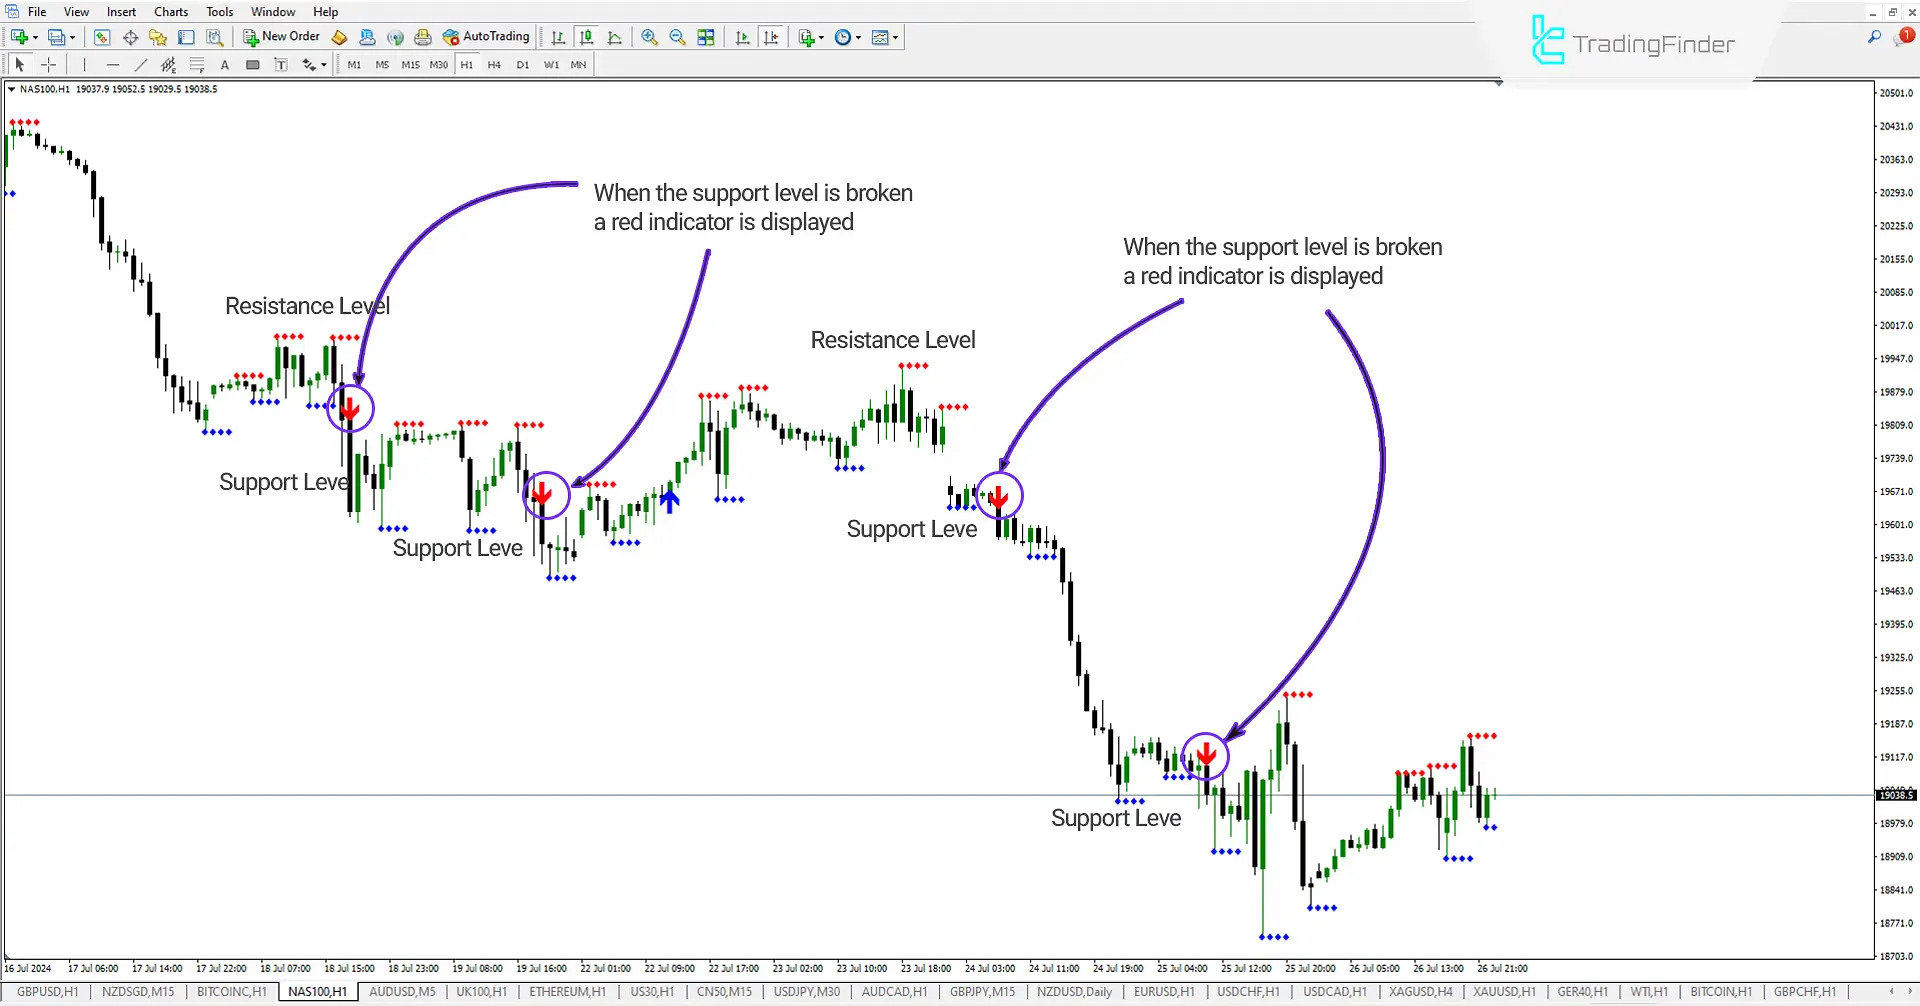
Support levels are displayed with blue dashed lines, and resistance levels are shown with red dashed lines. When a support level is broken (breakout), a sell signal (red downward arrow) is issued, and when a resistance level is broken, a buy signal (blue upward arrow) is issued.
Indicator table
Indicator Categories: | Support & Resistance MT4 Indicators Signal & Forecast MT4 Indicators Educational MT4 Indicators |
Platforms: | MetaTrader 4 Indicators |
Trading Skills: | Intermediate |
Indicator Types: | Breakout MT4 Indicators Lagging MT4 Indicators |
Timeframe: | M1-M5 Time MT4 Indicators M15-M30 Time MT4 Indicators H4-H1 Time MT4 Indicators |
Trading Style: | Day Trading MT4 Indicators Intraday MT4 Indicators Scalper MT4 Indicators |
Trading Instruments: | Share Stocks MT4 Indicators Stock Market MT4 Indicators Cryptocurrency MT4 Indicators Forex MT4 Indicators |
Principles of Using the SRBAI Indicator
The SRBAI indicator is an effective tool for traders to identify support and resistance breakout areas. This indicator detects these breakouts and issues buy and sell signals.
Breakout of Resistance Level

In the 1-hour chart of Gold (XAUUSD), if the resistance levels marked in red are broken, a buy signal (Buy) is issued in blue.
Breakout of Support Level

In the 30-minute chart of the NASDAQ index (NAS100), if the support levels marked in blue are broken, a sell signal (Sell) is issued in red.
Indicator setting

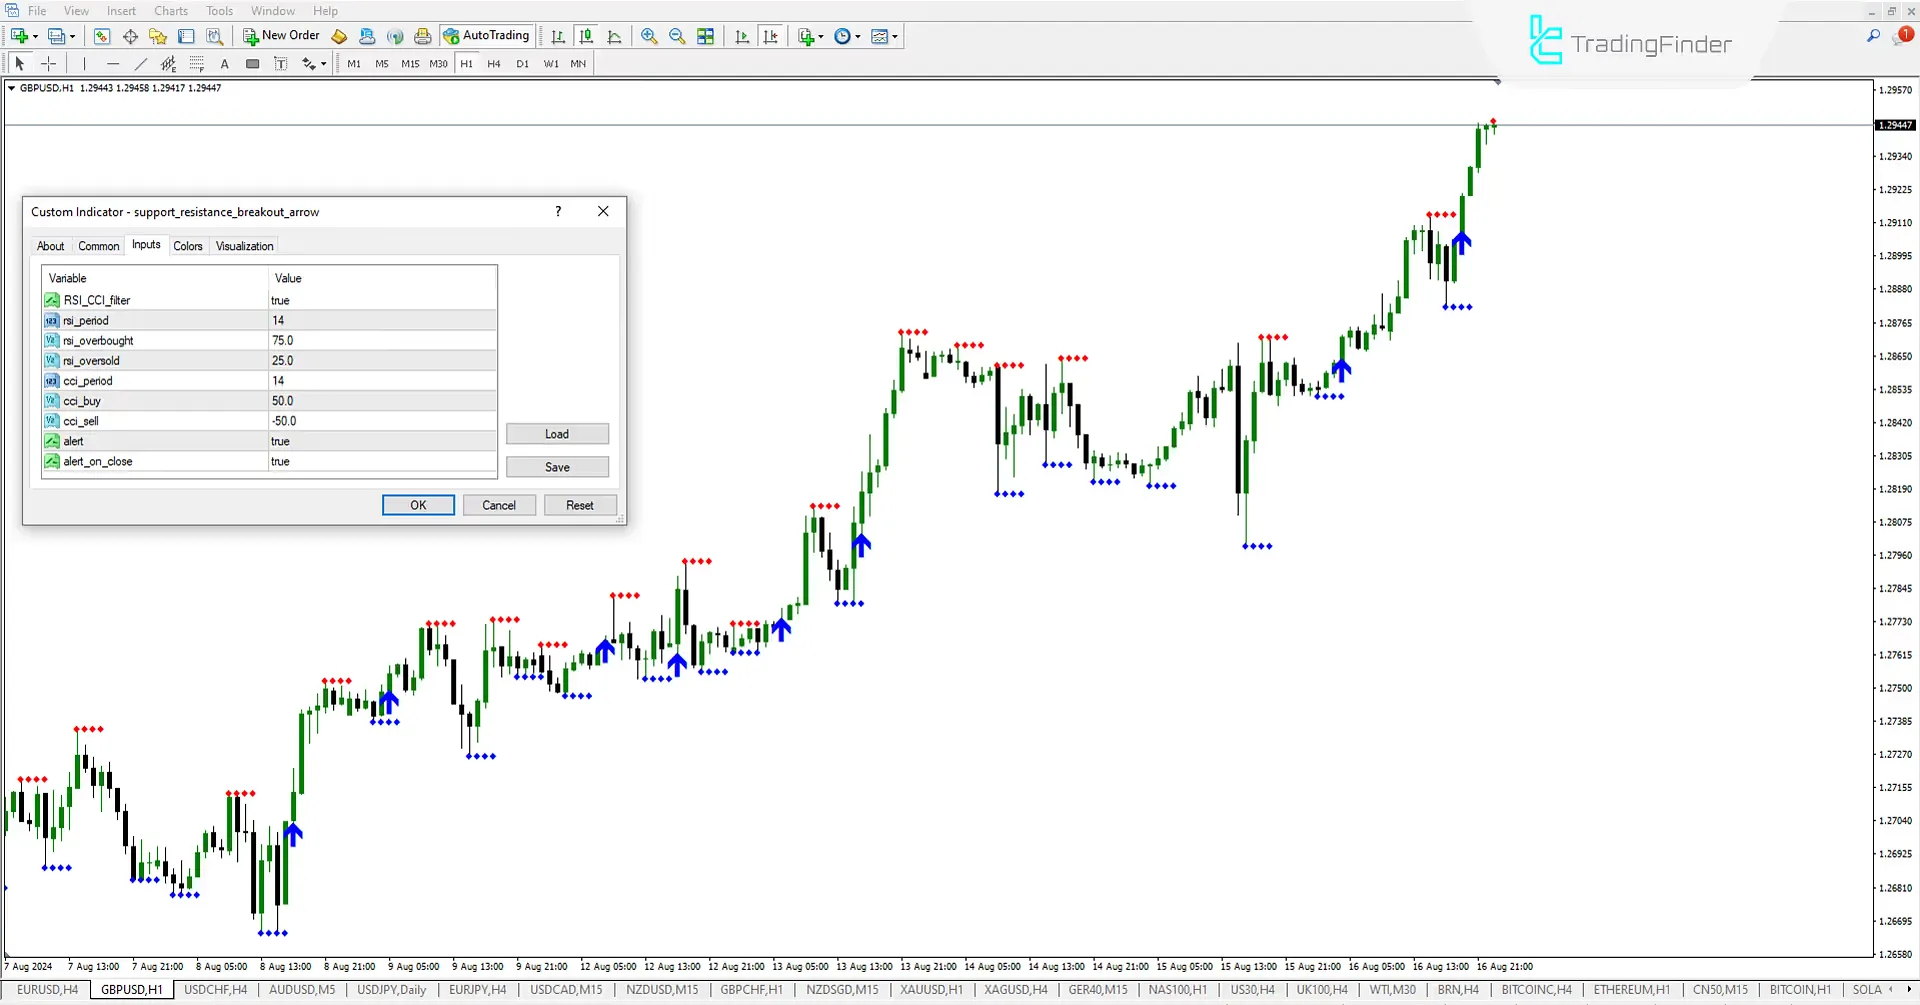
Traders can receive stronger signals on the chart by enabling the RSI_CCI_Filter.
- RSI_CCI_Filter: Filters the signal using CCI and RSI.
- RSI_Period: RSI calculation period.
- RSI_Overbought: RSI overbought level.
- RSI_Oversold: RSI oversold level.
- CCI_Period: CCI calculation period.
- CCI_Buy: CCI level for buy signals.
- CCI_Sell: CCI level for sell signals.
- Alerts: Turns on alerts.
- Alert_On_Close: Alerts when the candle closes.
Conclusion
The Support and Resistance Breakout Indicator (SRBAI) provides strong buy and sell signals by combining RSI indicators and CCI. This MetaTrader 4 support and resistance indicator helps traders receive stronger signals on the chart.
Support Resistance Breakout MT4 PDF
Support Resistance Breakout MT4 PDF
Click to download Support Resistance Breakout MT4 PDFWhat is the purpose of the RSI_CCI_Filter option?
Enabling this option reduces the number of signals. However, it provides traders with more robust signals with solid confirmations.
Can the (SRBAI) Indicator be used in different trading styles?
Yes. Depending on the trader's strategy, it can be used in all trading styles.


