![Sweet Spots Indicator for MT4 Download – Free – [TradingFinder]](https://cdn.tradingfinder.com/image/495972/13-184-en-sweet-spots-mt4-01.webp)
![Sweet Spots Indicator for MT4 Download – Free – [TradingFinder] 0](https://cdn.tradingfinder.com/image/495972/13-184-en-sweet-spots-mt4-01.webp)
![Sweet Spots Indicator for MT4 Download – Free – [TradingFinder] 1](https://cdn.tradingfinder.com/image/495969/13-184-en-sweet-spots-mt4-02.webp)
![Sweet Spots Indicator for MT4 Download – Free – [TradingFinder] 2](https://cdn.tradingfinder.com/image/495973/13-184-en-sweet-spots-mt4-03.webp)
![Sweet Spots Indicator for MT4 Download – Free – [TradingFinder] 3](https://cdn.tradingfinder.com/image/495968/13-184-en-sweet-spots-mt4-04.webp)
The Sweet Spots indicator is designed to plot psychological price levels, or round numbers. Price typically reacts to these levels, as many traders and financial institutions use these zones to set their take-profit and stop loss levels.
These levels appear on the chart as both major and minor levels and act as important support and resistance zones.
Sweet Spots Indicator Specifications Table
The table below includes the specifications of the Sweet Spots indicator.
Indicator Categories: | Support & Resistance MT4 Indicators Trading Assist MT4 Indicators Levels MT4 Indicators |
Platforms: | MetaTrader 4 Indicators |
Trading Skills: | Elementary |
Indicator Types: | Breakout MT4 Indicators Reversal MT4 Indicators |
Timeframe: | Multi-Timeframe MT4 Indicators |
Trading Style: | Day Trading MT4 Indicators Scalper MT4 Indicators Swing Trading MT4 Indicators |
Trading Instruments: | Stock Market MT4 Indicators Cryptocurrency MT4 Indicators Forex MT4 Indicators |
Sweet Spots Indicator at a Glance
The levels drawn by the Sweet Spots indicator are key psychological levels that often act as price reaction points. Traders can enter buy or sell positions when the price touches these levels, using price action strategies.
Bullish Trend Conditions
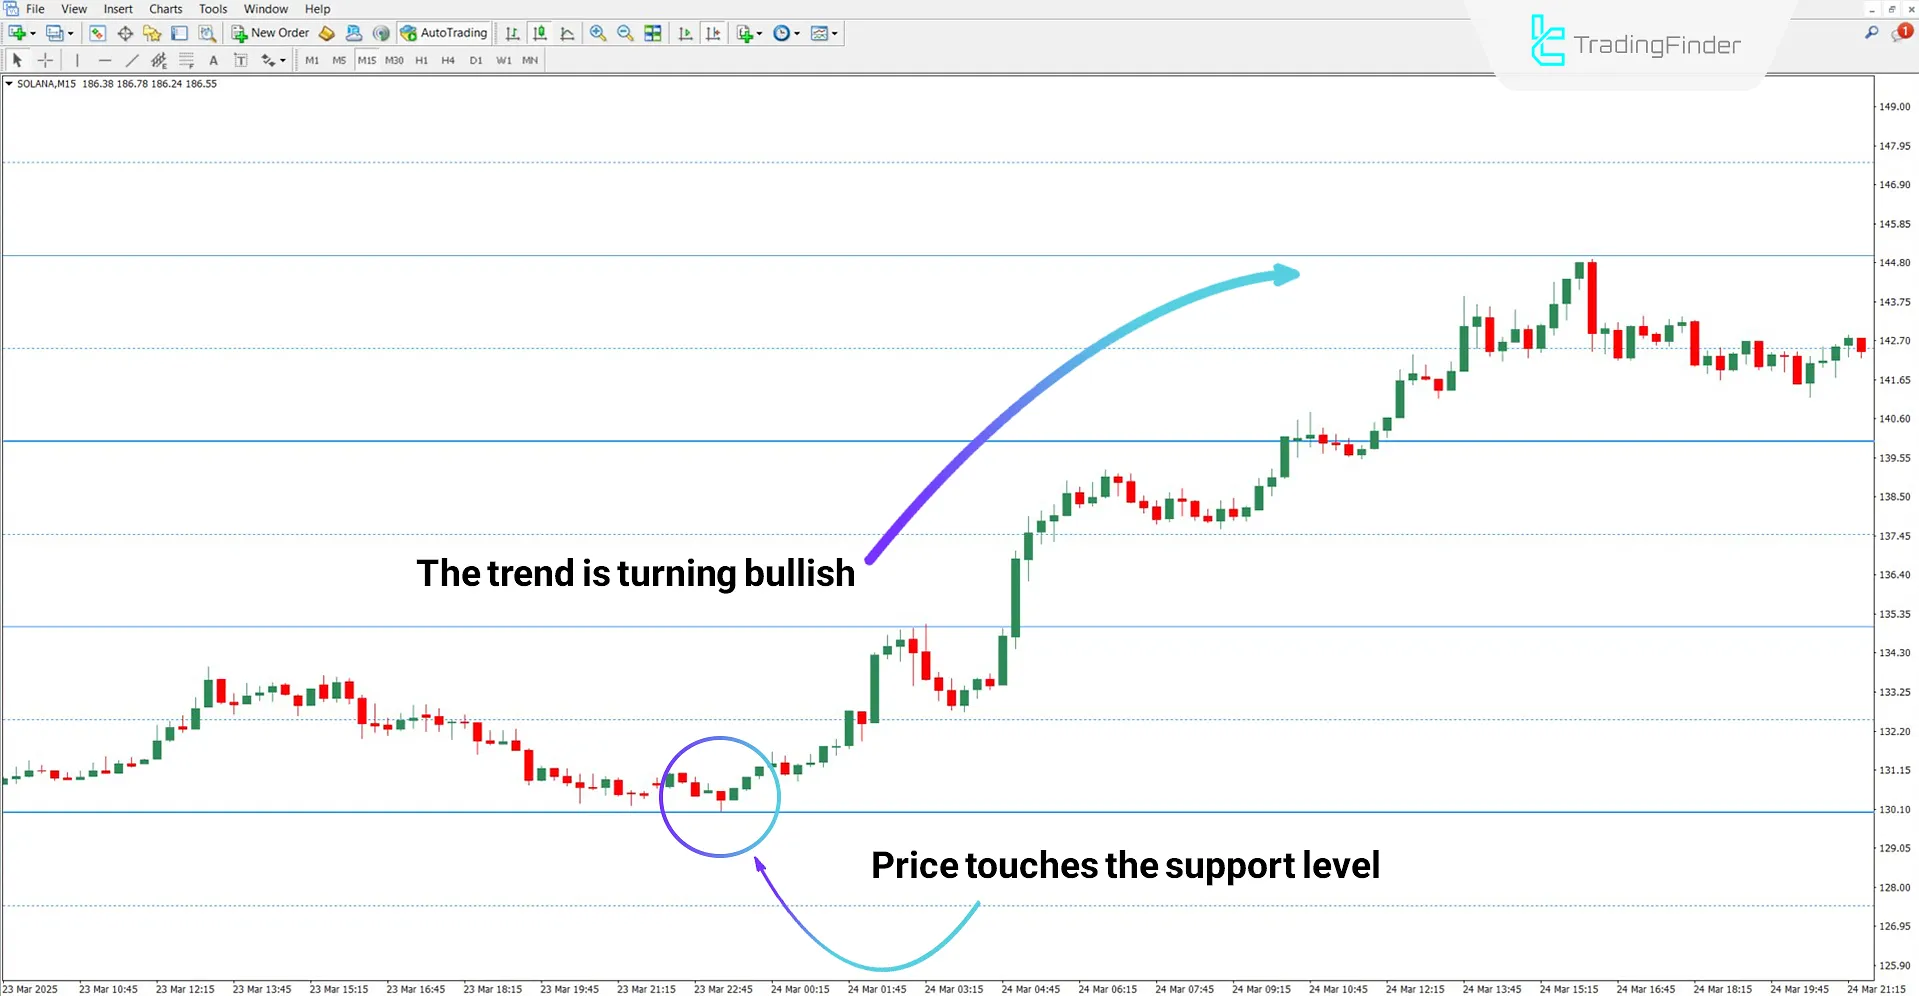
In the 15-minute timeframe chart of Solana (SOL), the price touches a marked level and starts to move upward.
As shown in the image, the blue line acts as a support level and offers a suitable entry opportunity for traders.

Bearish Trend Conditions
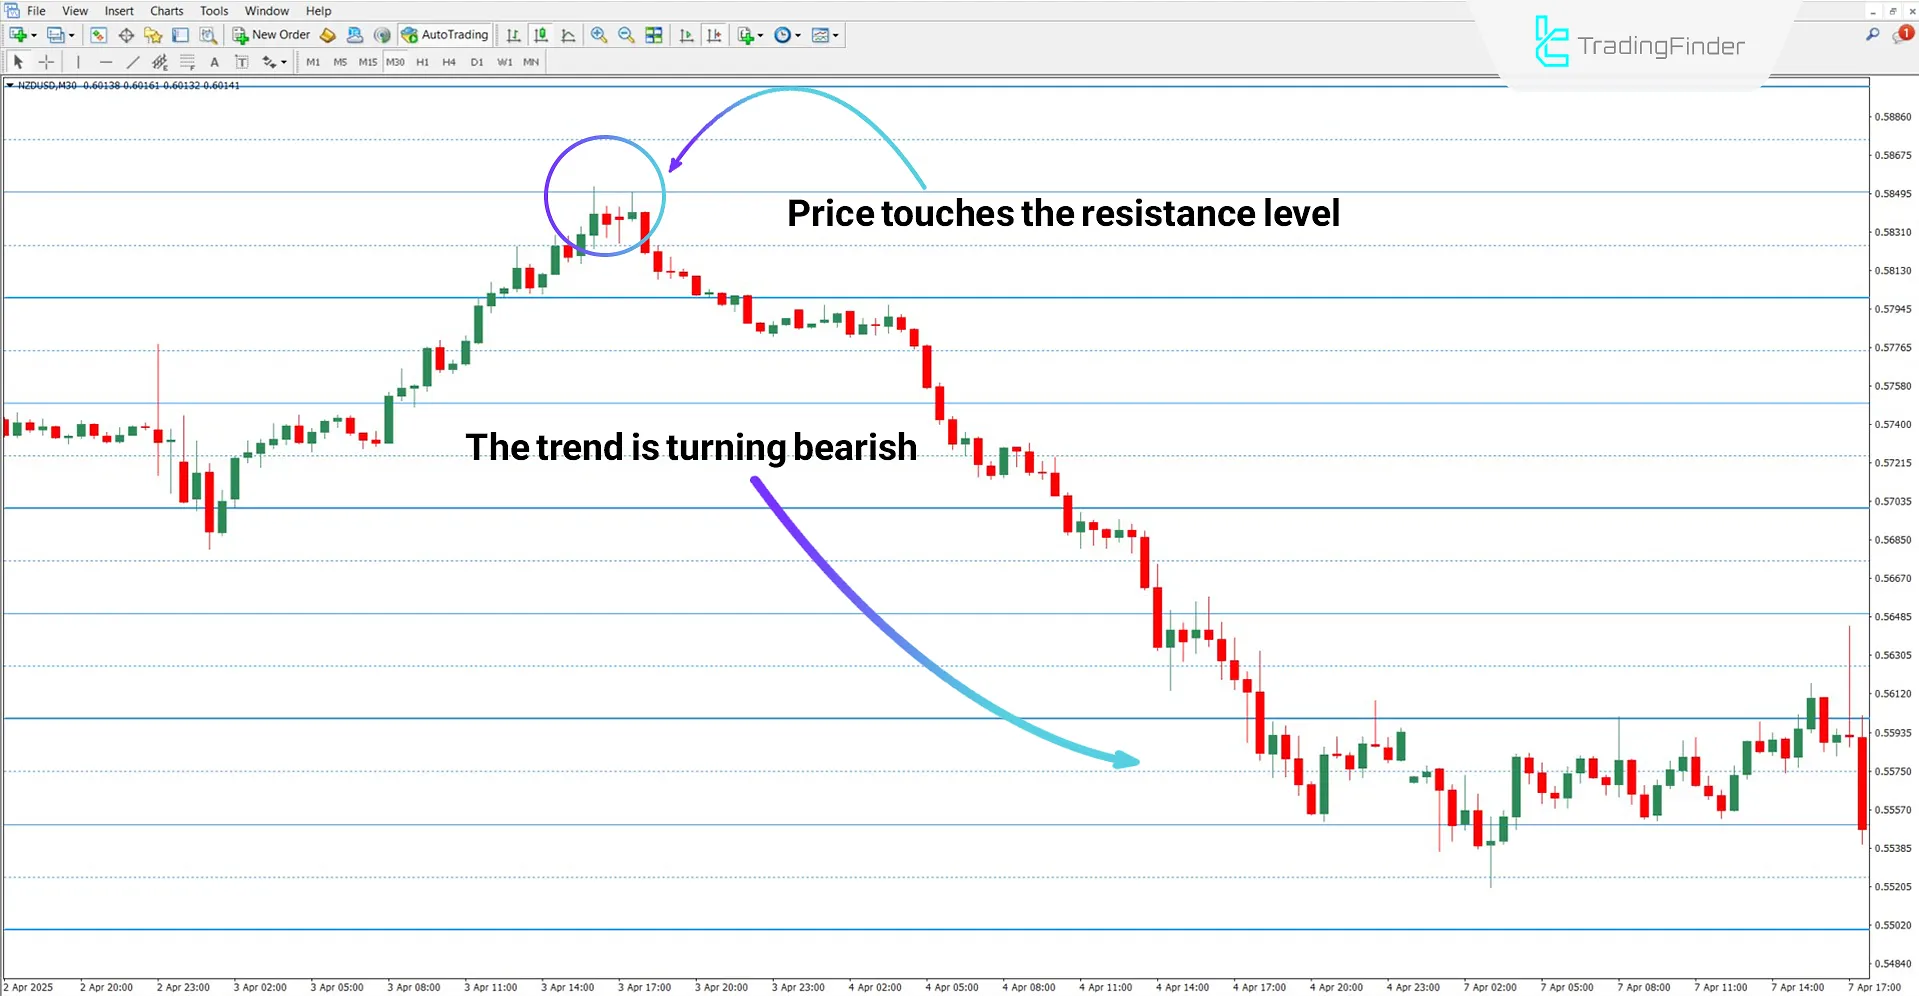
Based on the 30-minute chart of the NZD/USD pair, the blue line acts as a resistance level, and the price starts declining after touching it.
According to the chart below, the presence of a pin bar followed by a strong bearish candlestick may serve as a warning for sell trade setups.

Sweet Spots Indicator Settings
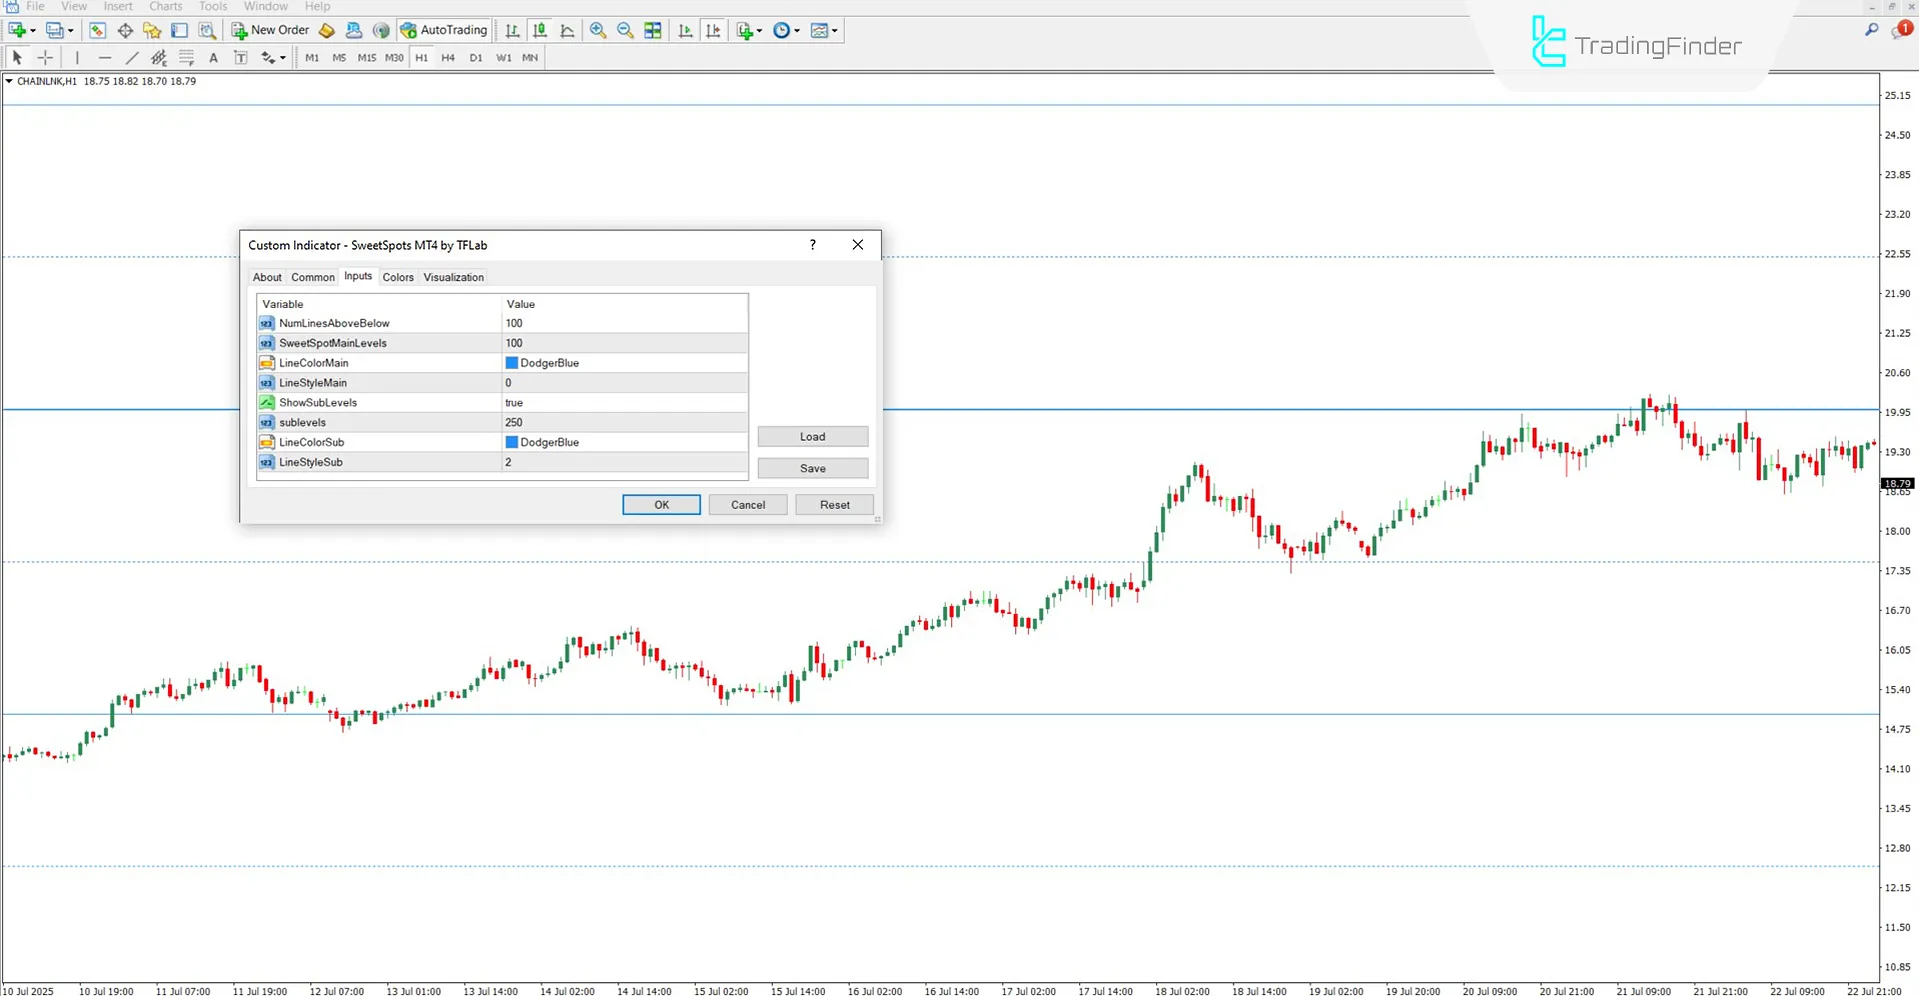
The settings of the Sweet Spots indicator are as follows:

- NumLinesAboveBelow: Number of lines above and below the current price
- SweetSpotMainLevels: Distance between main price levels
- LineColorMain: Color of main level lines
- LineStyleMain: Style of the main level lines
- ShowSubLevels: Enable display of sub-levels
- Sublevels: Distance between sub-levels
- LineColorSub: Color of sub-level lines
- LineStyleSub: Style of the sub-level lines
Conclusion
The Sweet Spots indicator is a widely used tool in technical analysis that automatically marks key price touch levels on the chart.
These levels are typically critical support and resistance zones where the price tends to react.
Sweet Spots Indicator MT4 PDF
Sweet Spots Indicator MT4 PDF
Click to download Sweet Spots Indicator MT4 PDFDoes the Sweet Spots indicator provide entry and exit signals?
No, this trading tool is designed to plot round and psychological market levels and does not issue any entry or exit signals.
Why are these levels important?
Because many traders and financial institutions place their orders around these areas.


