
On June 23, 2025, in version 2, alert/notification functionality was added to this indicator
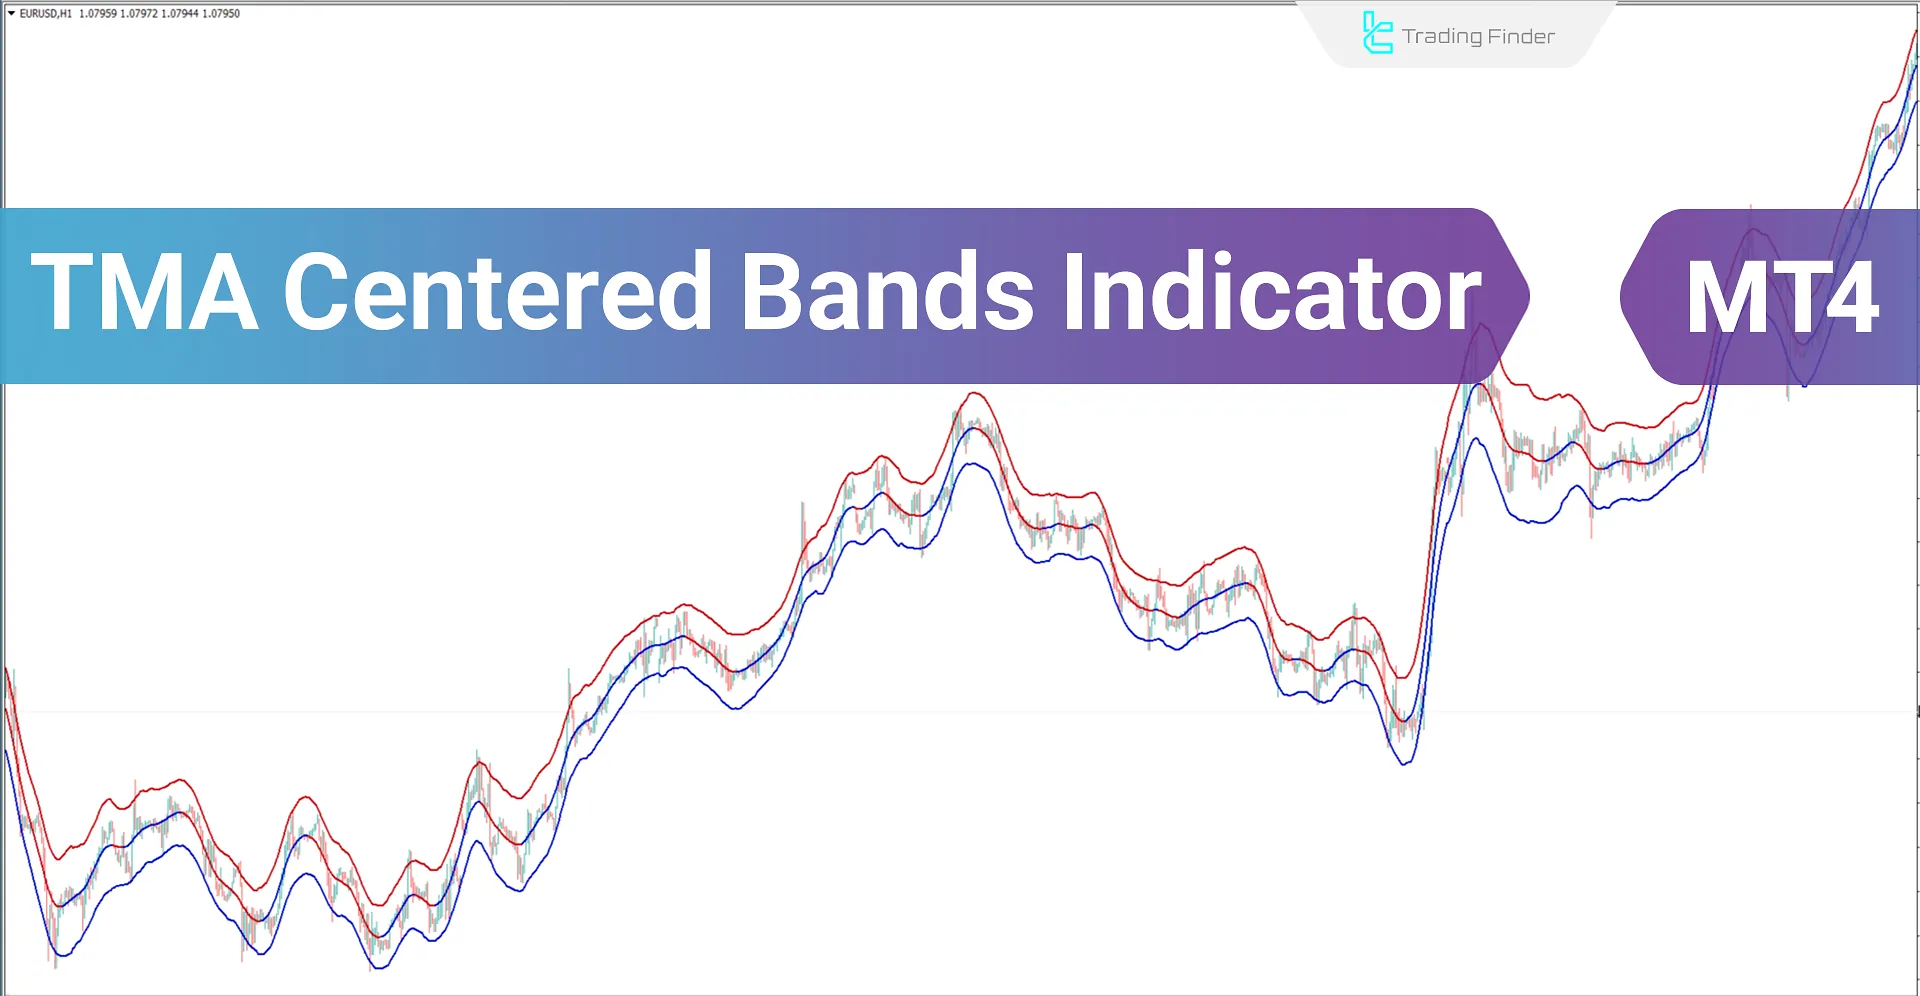
TheTMA Centered Bands Indicator is a MetaTrader 4 indicator that uses the power of the Moving Average to detect the overall trend direction shown by the bands on the chart.
This indicator consists of three bands: the upper band is red, the middle band is red-blue, and the lower band is blue. In uptrends, the middle band turns blue, and in downtrends, it turns red.
Whenever the price moves outside the upper or lower bands, it may return inside them, providing an entry signal for a trade. Exiting the upper band generates a sell signal while exiting the lower band generates a buy signal.
Indicator Table
Indicator Categories: | Signal & Forecast MT4 Indicators Bands & Channels MT4 Indicators Levels MT4 Indicators |
Platforms: | MetaTrader 4 Indicators |
Trading Skills: | Elementary |
Indicator Types: | Breakout MT4 Indicators Reversal MT4 Indicators |
Timeframe: | Multi-Timeframe MT4 Indicators |
Trading Style: | Day Trading MT4 Indicators Intraday MT4 Indicators Scalper MT4 Indicators Swing Trading MT4 Indicators |
Trading Instruments: | Share Stocks MT4 Indicators Indices Market MT4 Indicators Commodity Market MT4 Indicators Stock Market MT4 Indicators Cryptocurrency MT4 Indicators Forex MT4 Indicators |
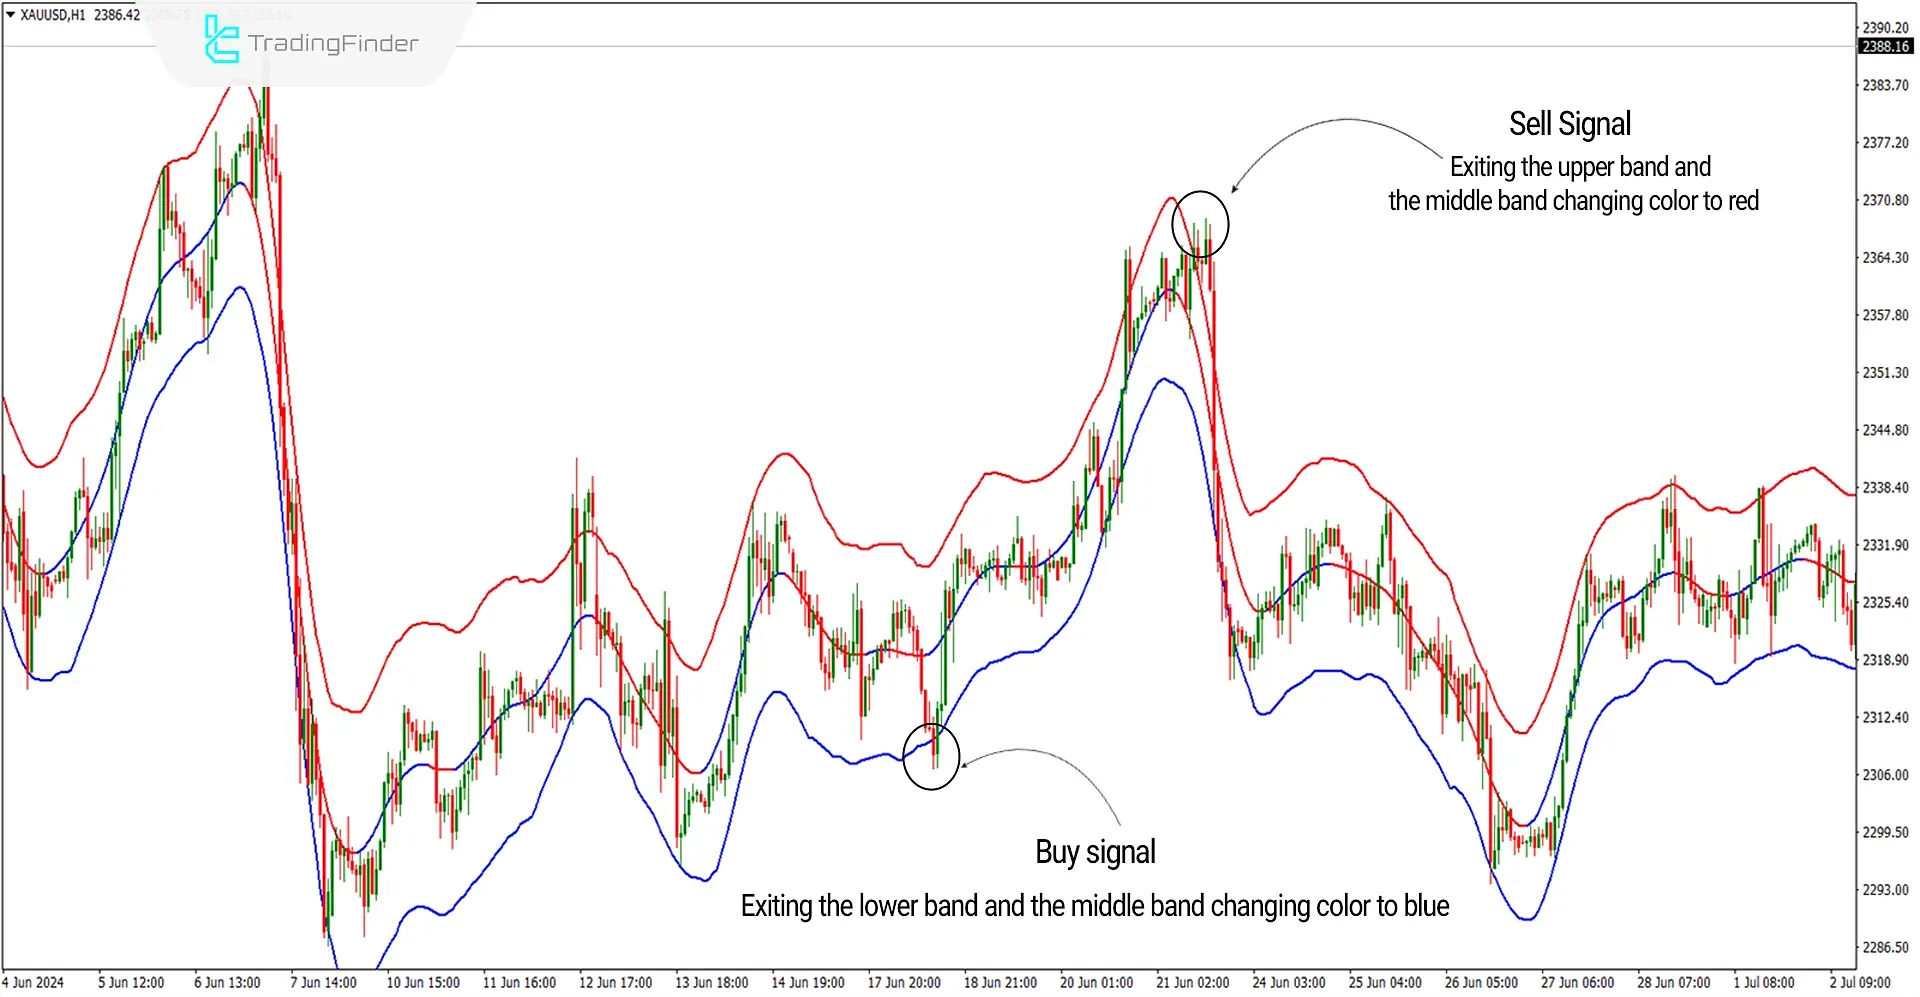
The image below shows the price chart of Gold against the US dollar [XAUUSD] in the 1-hour timeframe. Around the $2300 price range, the price breaks below the lower band of the indicator and then re-enters the band, causing the middle band of the indicator to turn blue.
A trend reversal occurs in this scenario, and abullish trend and buy signal (Buy Position) are generated. Additionally, around the $2370 price range, the price exits the upper band of the indicator, and the middle band turns red. A bearish trend and sell signal (Sell Position) are generated in this scenario.

Overview
Given the importance of identifying trend direction and trading in line with it, the TMA Indicator is one of those indicators that, by utilizing Moving Averages, can provide a general view of the future trend direction and generate entry signals for trades aligned with the trend.
The TMA Indicator optimizes entry signals by averaging prices and calculating market volatility using theATR (Average True Range) indicator.
Uptrend Signals (Buy Positions)
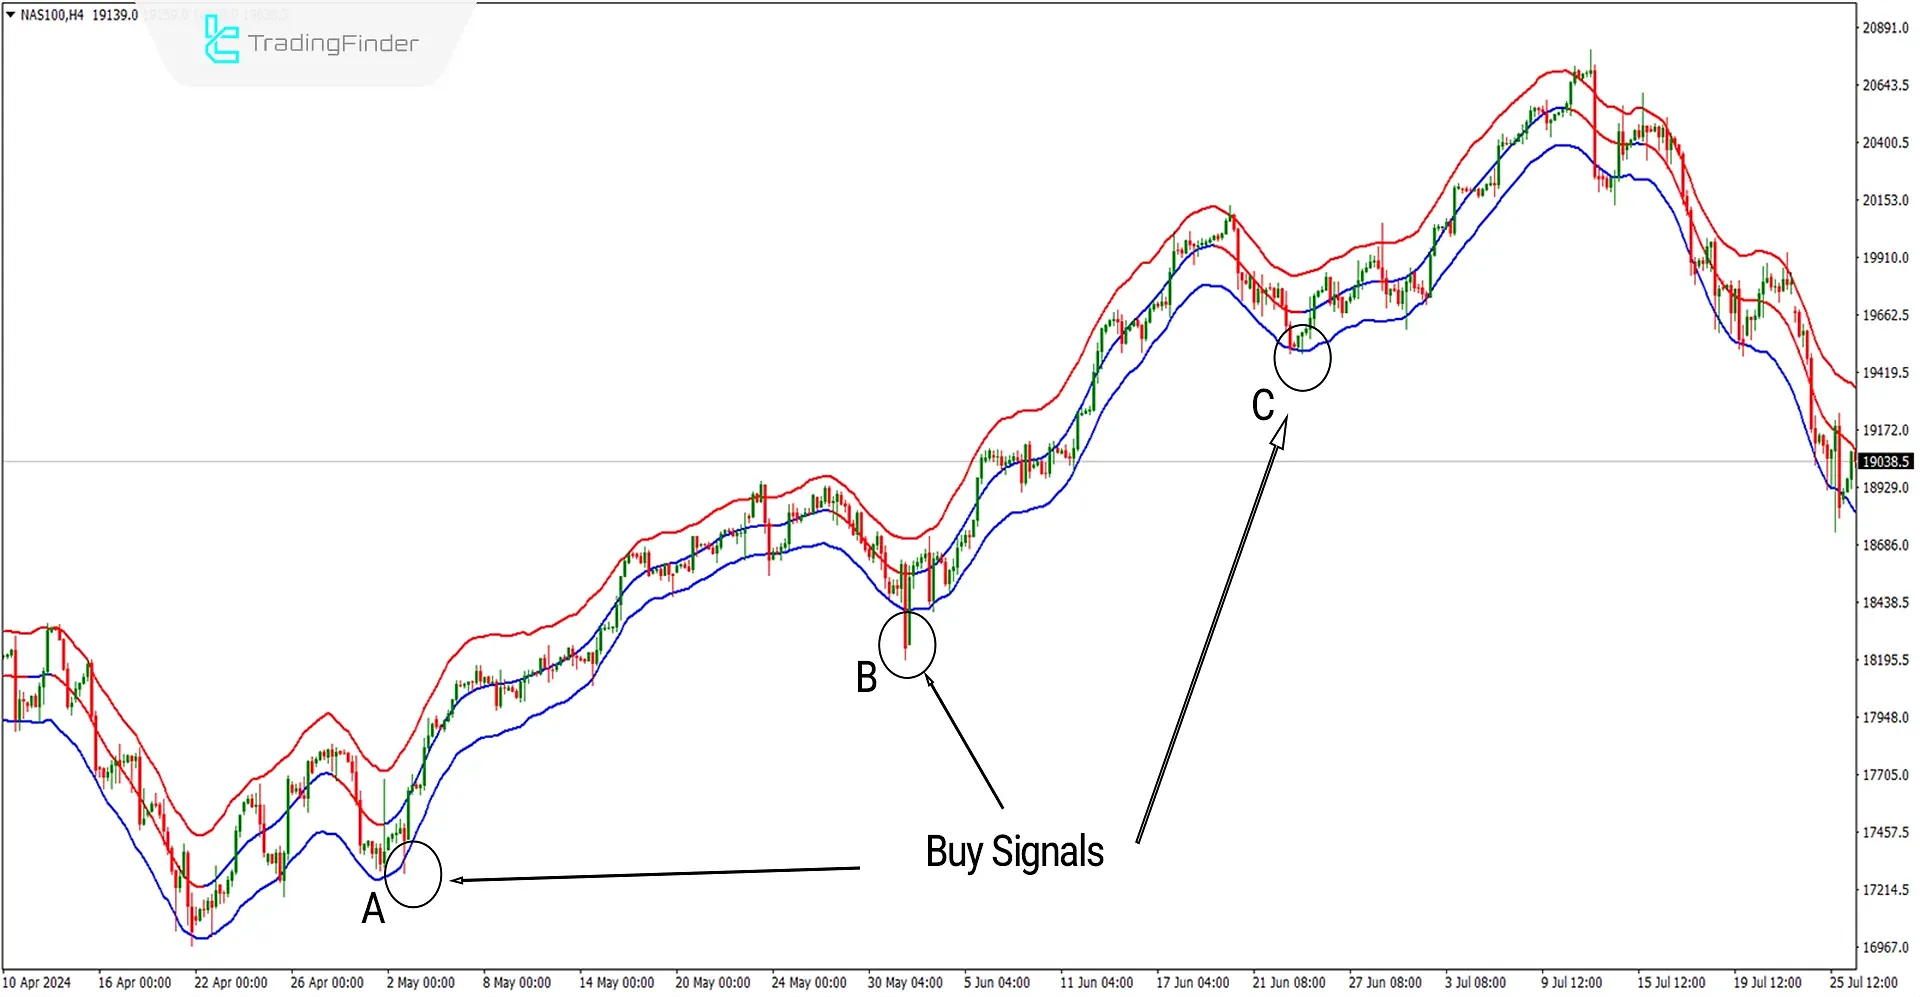
The image below displays the NASDAQ index chart with the symbol (NAS100) in the 4-hour timeframe. At points A, B, and C, the price exits the lower band and then re-enters the band, causing the middle band of the indicator to turn blue.
In this scenario, the indicator generates aBuy Signal and indicates an Uptrend. You can enter buy trades alongside other confirmations, such as the RSI.

Downtrend Signals (Sell Positions)
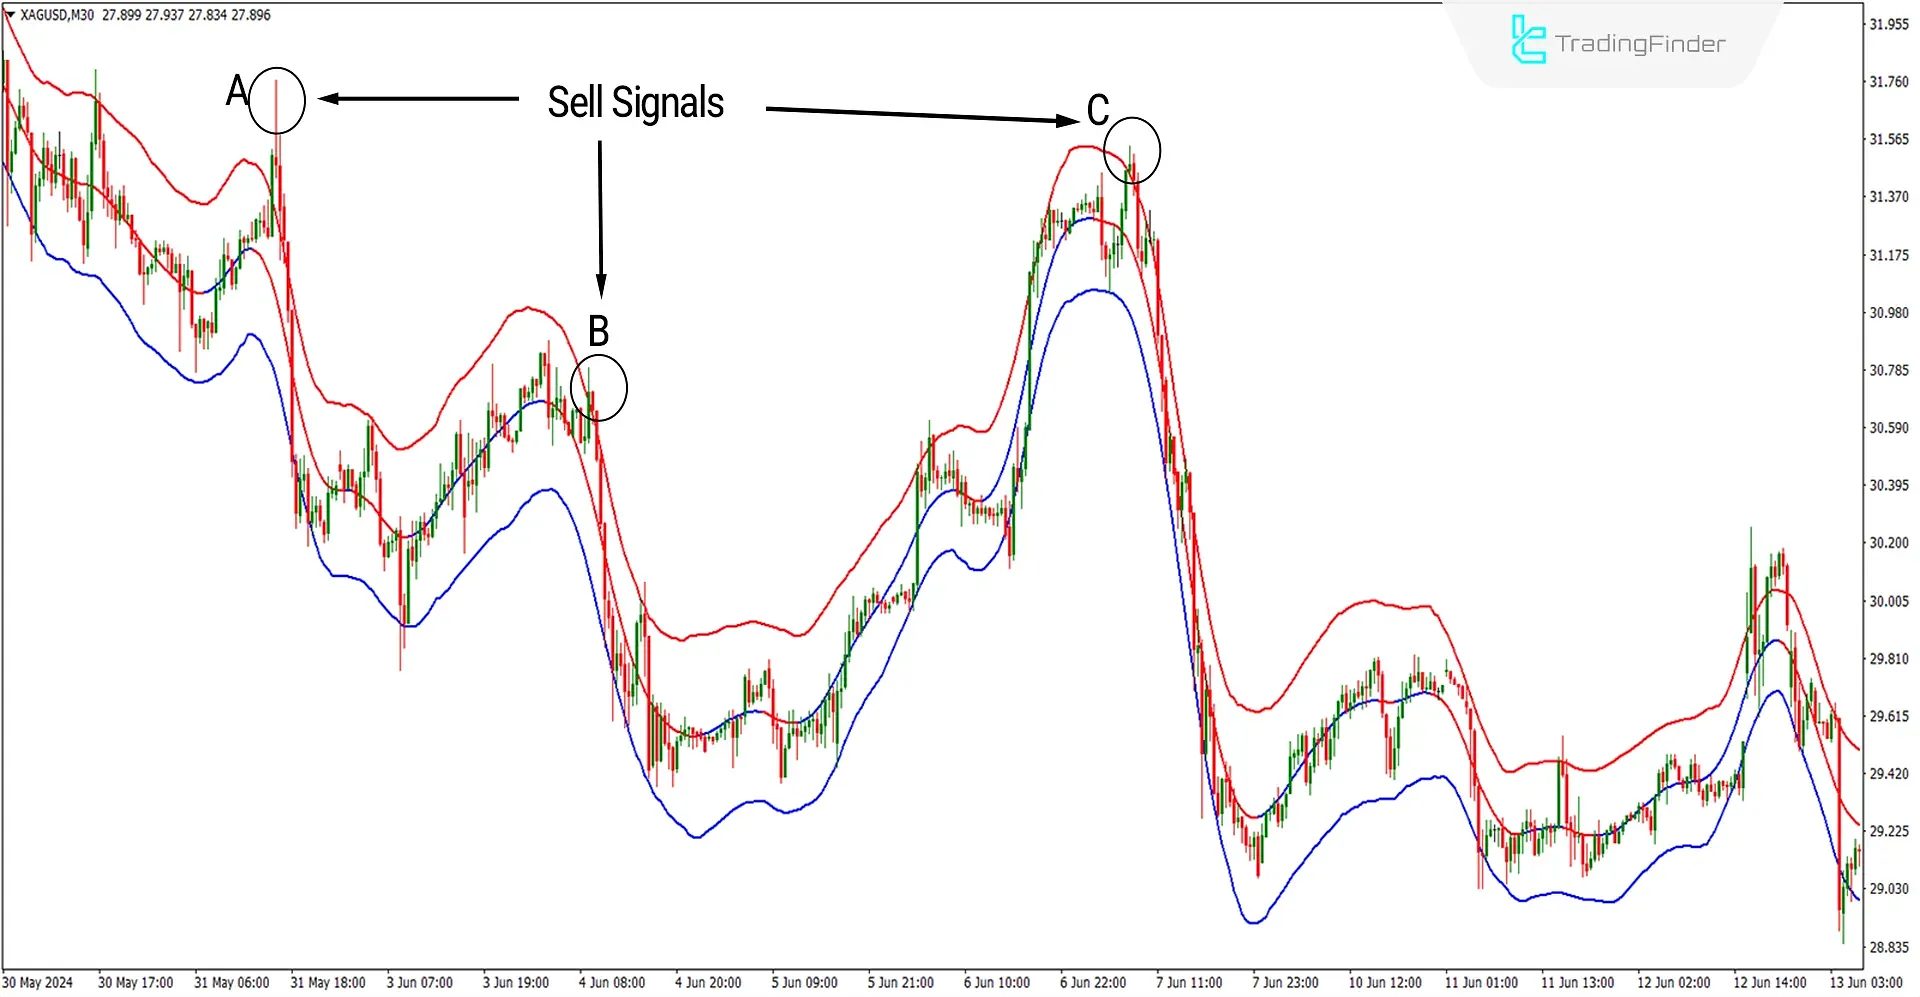
In the image below, the price chart for silver against the US dollar (XAGUSD) is displayed in a 30-minute timeframe. At points A, B, and C, the price exits the upper band of the indicator and then re-enters the band, causing the middle band to turn red. I
n this scenario, aSell Signal and Downtrend are issued. You can consider entering sell trades alongside other confirmations, such as the Stochastic indicator.

Settings of the TMA Indicator
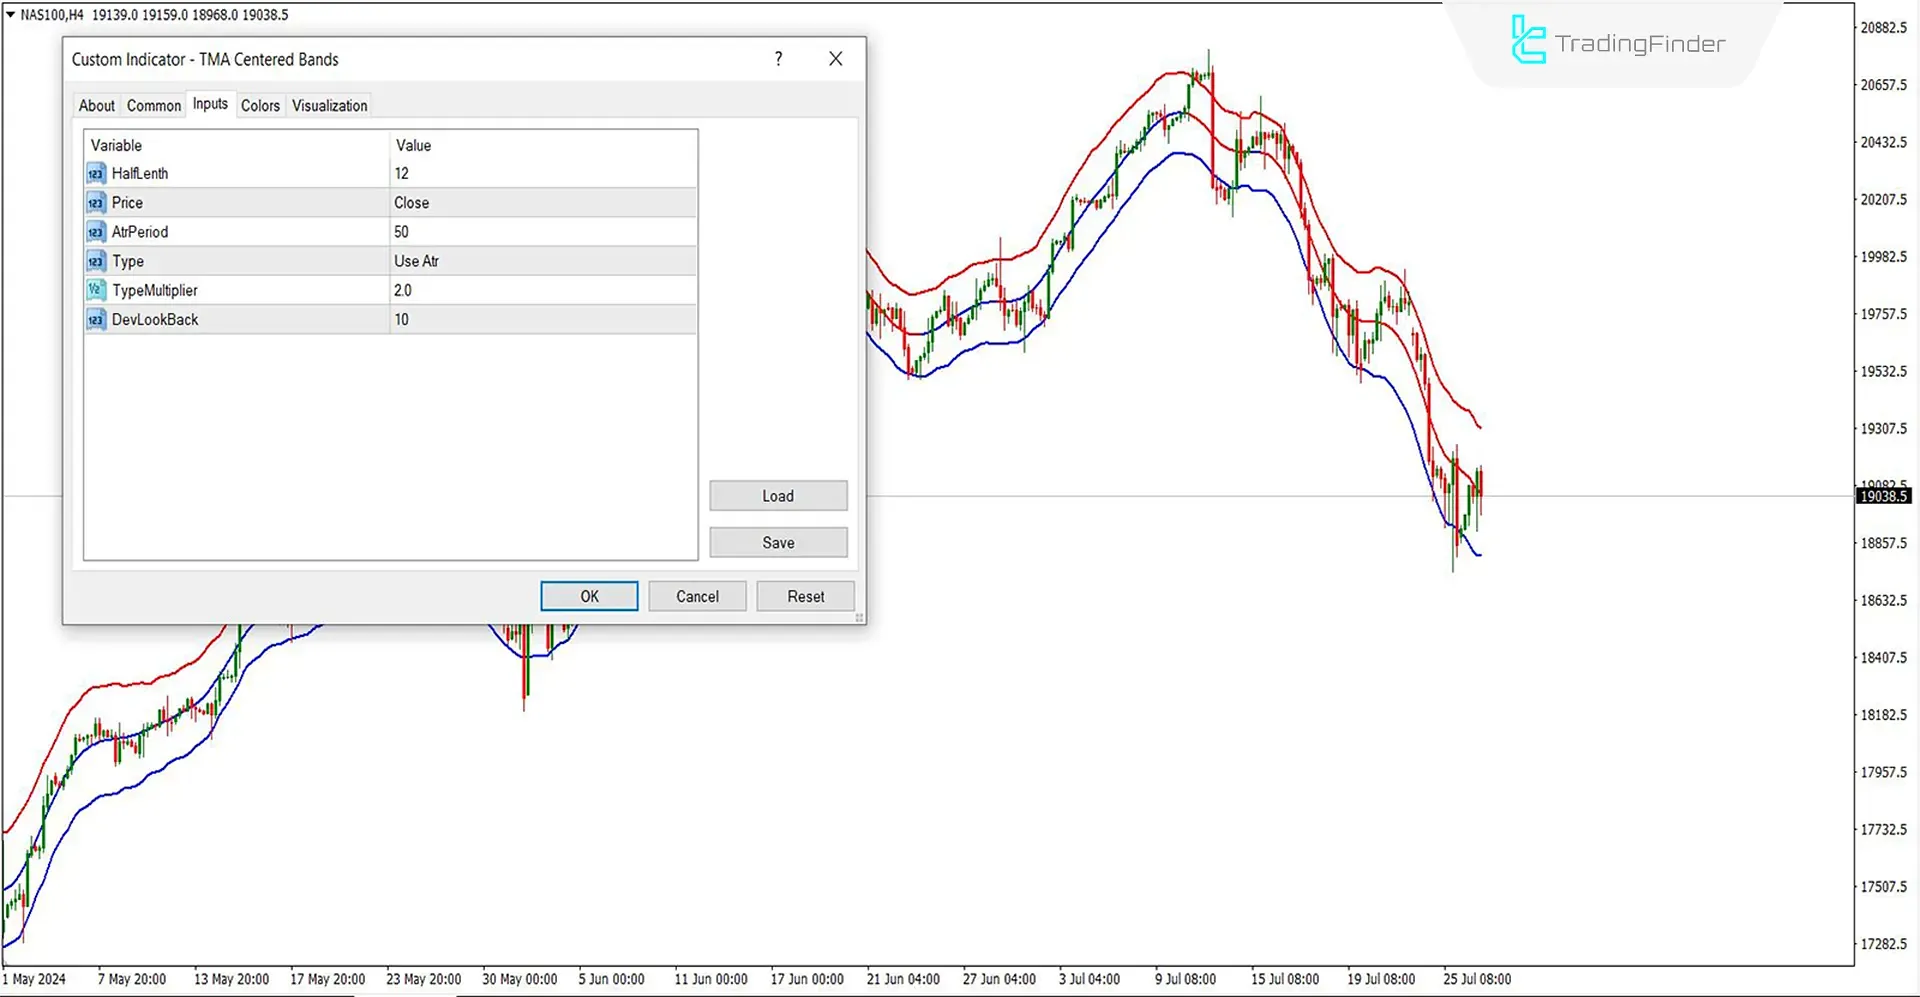
- HalfLength: The indicator considers 12 candles for averaging. This setting determines its sensitivity to recent price changes.
- Price: This setting uses the closing price ('Close'), which indicates that the indicator should use the closing price of each candle to calculate the moving average.
- AtrPeriod: The period for the Average True Range (ATR) indicator is set to 50. This extended period can help smooth out the ATR calculation, making it less sensitive to minor price fluctuations and providing a better indication of market volatility over a broader time frame.
- The ATR indicator is used to calculate the moving average, which implies that the volatility measured by the ATR is used to adjust how the moving average is calculated and plotted.
- TypeMultiplier: The bandwidth multiplier is set to 2. This multiplier affects the distance between the center and outer bands, determining how wide the bands are relative to the average true range. A higher multiplier makes the bands wider, potentially capturing more price action between them.
- DevLookBack: The default value is 10, which might be used to determine how many candles back the deviation calculation for the bands should consider. This helps refine how responsive the bands are to changes in price volatility.
Conclusion
The TMA-centered band's indicator is versatile and works across any timeframe, allowing it to be used in all trading strategies. Additionally, this MT4 Band and channel indicator provides a comprehensive overview of the trend direction.
You can also enhance its effectiveness by combining the TMA with confirming indicators such as the RSI or moving averages to validate the trend direction further. This integration helps refine your trading decisions by providing a more robust analysis of market movements.
TMA Centered Bands MT4 PDF
TMA Centered Bands MT4 PDF
Click to download TMA Centered Bands MT4 PDFDoes the TMA indicator alone provide valid buy and sell signals?
Yes, this indicator can be used to receive trading signals, but it is recommended that other indicators like RSI be used for better trend recognition.
Is this indicator applicable in MetaTrader 5?
Yes, it can also be used in MetaTrader 5. The link to this indicator is at the top of this page.


