![TMA True Indicator for MT4 Download – Free – [TradingFinder]](https://cdn.tradingfinder.com/image/566566/13-220-en-tma-true-mt4-01.webp)
![TMA True Indicator for MT4 Download – Free – [TradingFinder] 0](https://cdn.tradingfinder.com/image/566566/13-220-en-tma-true-mt4-01.webp)
![TMA True Indicator for MT4 Download – Free – [TradingFinder] 1](https://cdn.tradingfinder.com/image/566565/13-220-en-tma-true-mt4-02.webp)
![TMA True Indicator for MT4 Download – Free – [TradingFinder] 2](https://cdn.tradingfinder.com/image/566543/13-220-en-tma-true-mt4-03.webp)
![TMA True Indicator for MT4 Download – Free – [TradingFinder] 3](https://cdn.tradingfinder.com/image/566547/13-220-en-tma-true-mt4-04.webp)
The TMA True Indicator is designed for analyzing market trends and fluctuations in MetaTrader 4.
This tool is an enhanced version of the Triangular Moving Average (TMA) indicator, free from the repaint issue (signal changes after appearing on the chart).
Through a dynamic channel, the indicator displays price oscillation range and identifies overbought and oversold zones.
Specifications Table of the TMA True Indicator
The features of the TMA True Indicator are as follows.
Indicator Categories: | Bands & Channels MT4 Indicators Moving Average MT4 Indicators |
Platforms: | MetaTrader 4 Indicators |
Trading Skills: | Intermediate |
Indicator Types: | Overbought and Oversold MT4 Indicators Reversal MT4 Indicators |
Timeframe: | Multi-Timeframe MT4 Indicators |
Trading Style: | Day Trading MT4 Indicators Scalper MT4 Indicators Swing Trading MT4 Indicators |
Trading Instruments: | Binary Options MT4 Indicators Stock Market MT4 Indicators Cryptocurrency MT4 Indicators Forex MT4 Indicators |
TMA True Indicator at a Glance
The main application of the TMA True Indicator is to display overbought and oversold zones. When the price touches the upper band, it indicates an overbought condition, and conversely, when the price crosses the lower band, it indicates an oversold condition.
Buy Trade Setup
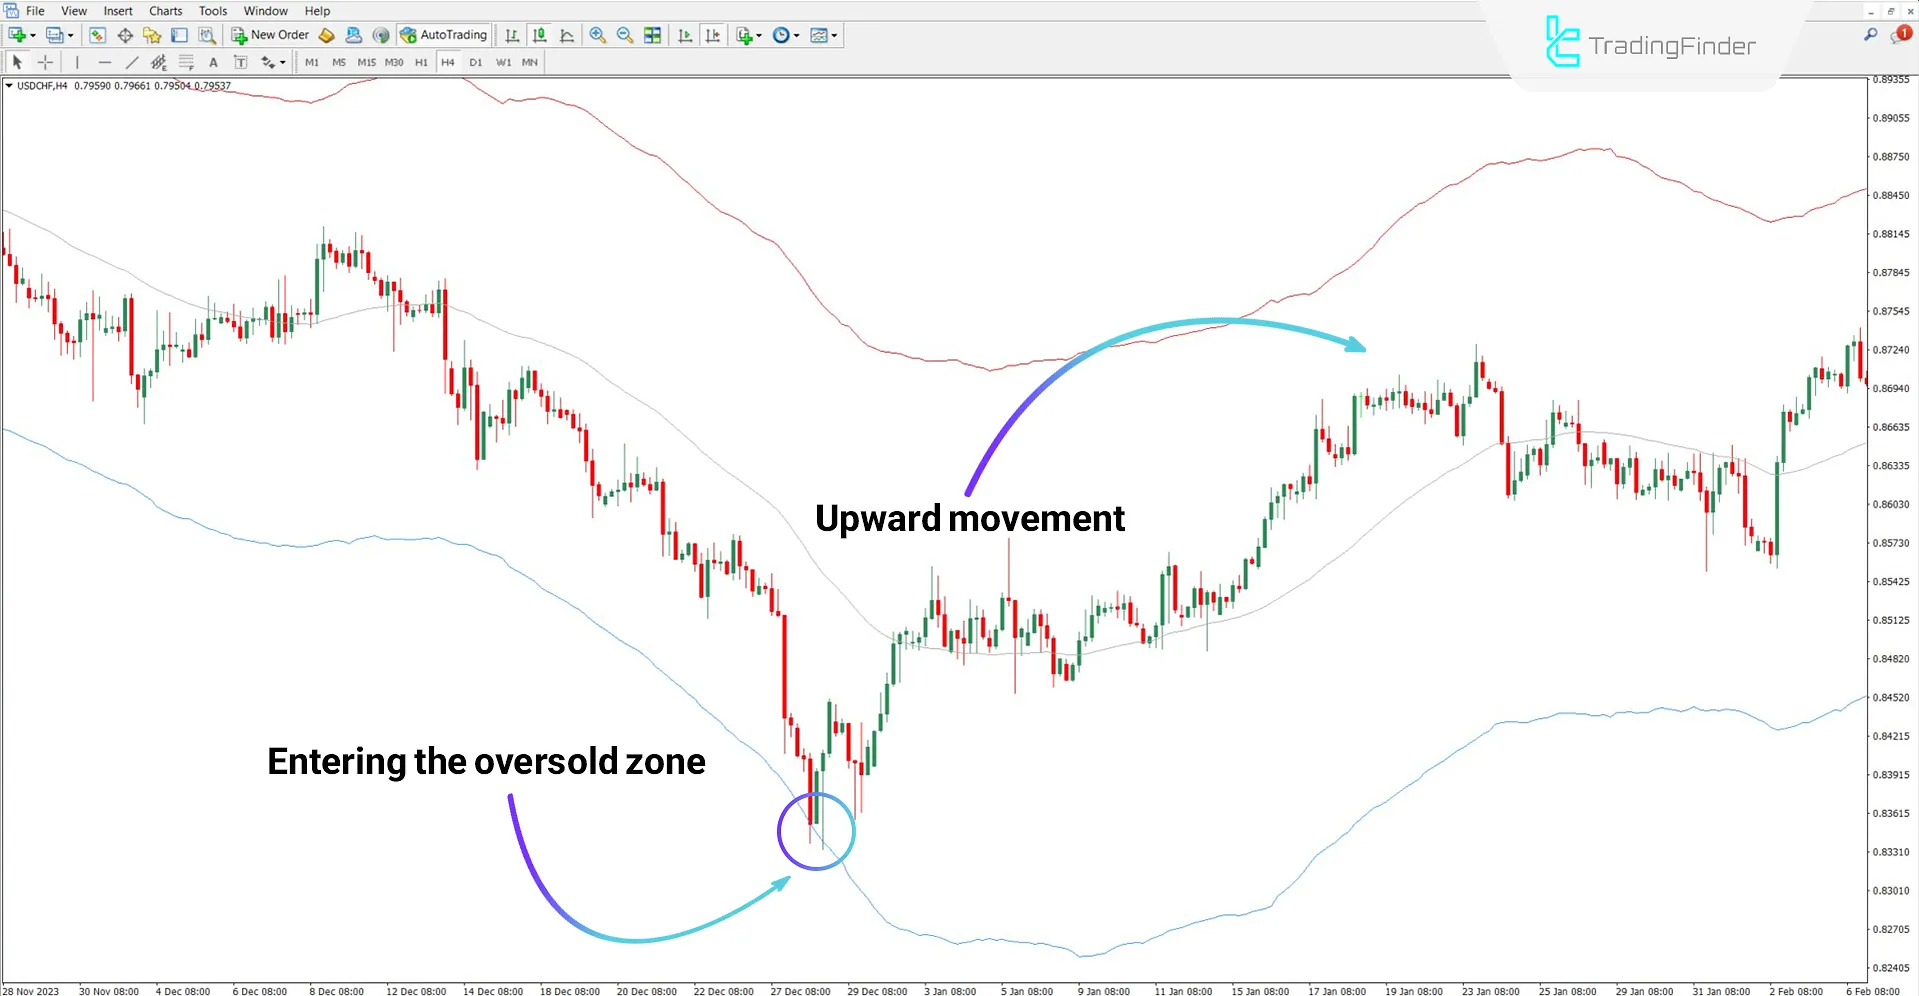
Based on the USD/CHF chart on a 4-hour timeframe, the behavior of TMA True in an uptrend is observable.
As illustrated, the price after the downward move touches the lower band, showing an oversold area. Under such conditions, traders may consider a possible reversal.

Sell Trade Setup
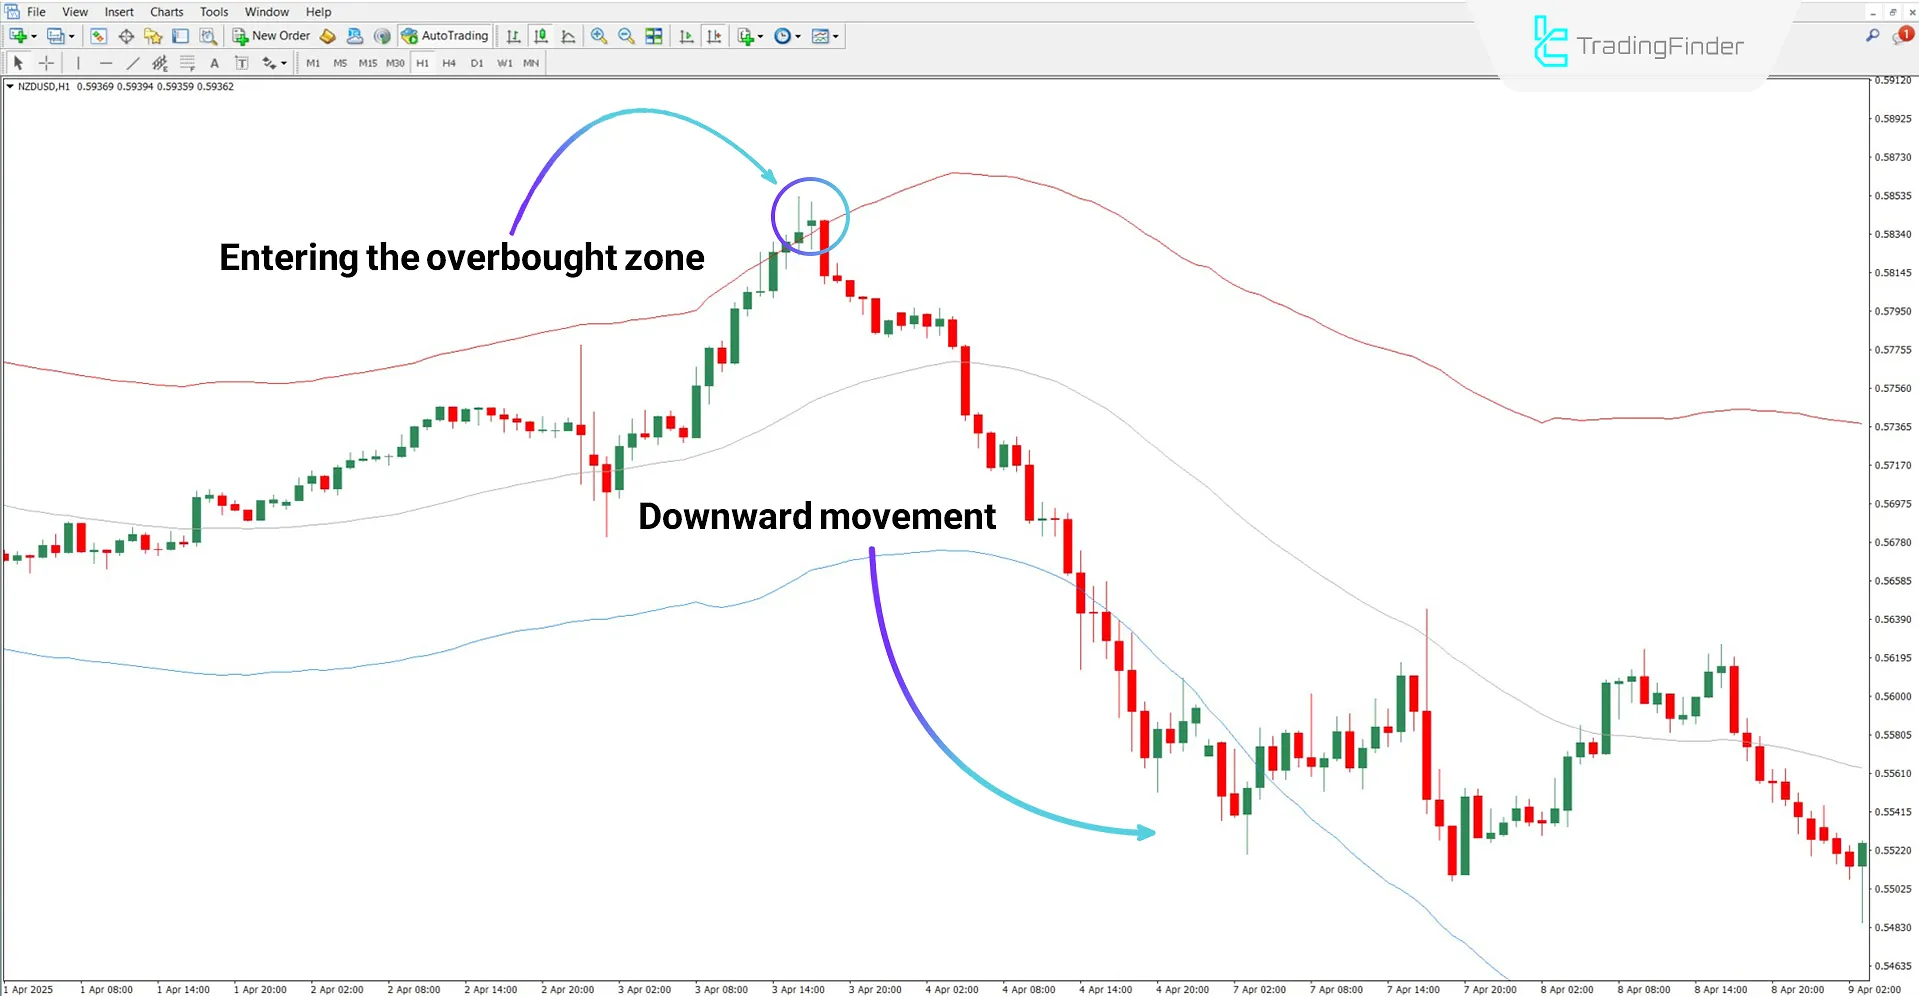
Based on the NZD/USD chart on a 1-hour timeframe, the price enters the overbought zone, creating a sell setup. As the chart shows, the price after entering this zone moves downward.

TMA True Indicator Settings
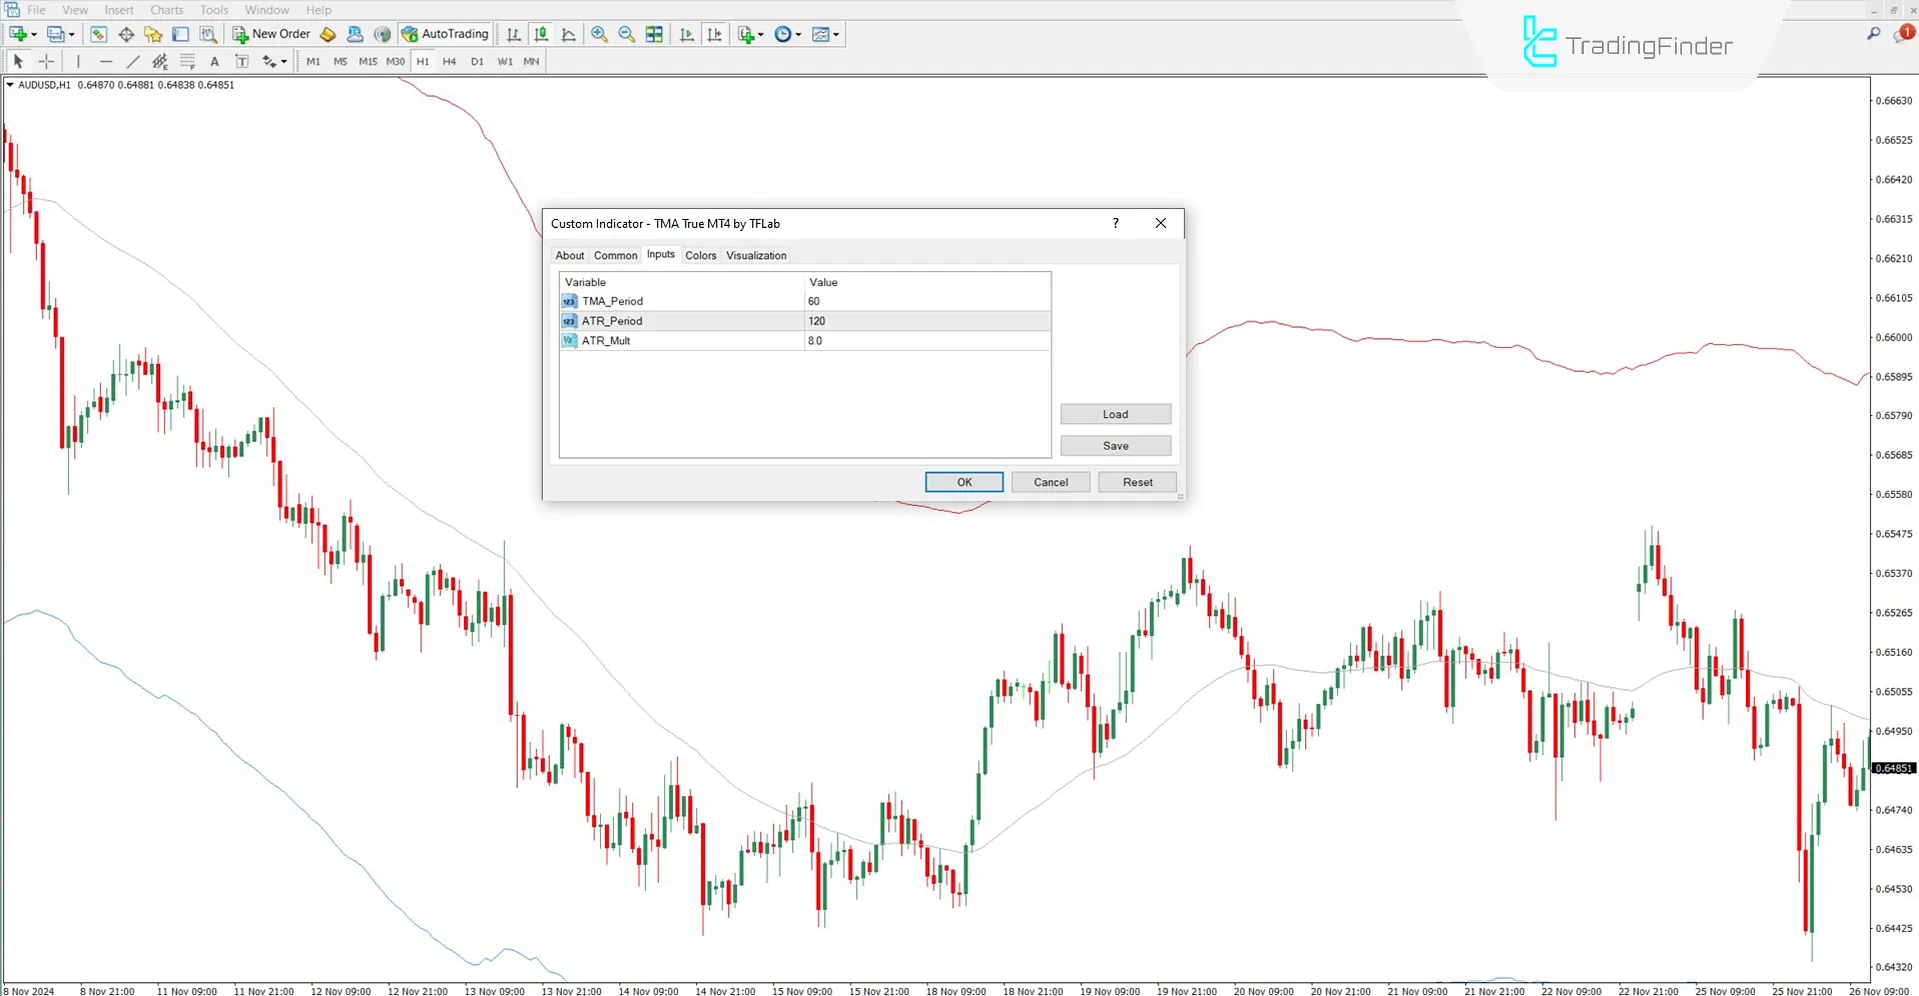
The adjustable parameters in the TMA True Indicator are as follows:

- TMA_Period: Triangular Moving Average calculation period
- ATR_Period: Number of candles for ATR calculation
- ATR_Mult: Multiplier for band expansion or scaling based on ATR value
Conclusion
The TMA True Indicator is a combination of the Triangular Moving Average (TMA) and the Average True Range (ATR). This trading tool uses a dynamic channel to display overbought and oversold zones. It also provides the possibility of adjustments and recalibration, allowing users to modify the values through the settings section.
TMA True Indicator for MT4 PDF
TMA True Indicator for MT4 PDF
Click to download TMA True Indicator for MT4 PDFDoes this tool generate buy and sell signals?
No, TMA True does not directly generate signals.
Which timeframe is best for this indicator?
TMA True: multi-timeframe, applicable across all periods.


