![TPO Volume Insights Indicator for MT4 Download – Free – [TradingFinder]](https://cdn.tradingfinder.com/image/394545/13-128-en-tpo-volume-insights-mt4-01.webp)
![TPO Volume Insights Indicator for MT4 Download – Free – [TradingFinder] 0](https://cdn.tradingfinder.com/image/394545/13-128-en-tpo-volume-insights-mt4-01.webp)
![TPO Volume Insights Indicator for MT4 Download – Free – [TradingFinder] 1](https://cdn.tradingfinder.com/image/394548/13-128-en-tpo-volume-insights-mt4-02.webp)
![TPO Volume Insights Indicator for MT4 Download – Free – [TradingFinder] 2](https://cdn.tradingfinder.com/image/394546/13-128-en-tpo-volume-insights-mt4-03.webp)
![TPO Volume Insights Indicator for MT4 Download – Free – [TradingFinder] 3](https://cdn.tradingfinder.com/image/394547/13-128-en-tpo-volume-insights-mt4-04.webp)
The TPO Volume Insights Indicator uses horizontal colored bars to display support and resistance levels, Point of Control (POC) zones, and market balance or imbalance areas.
This trading tool illustrates traded volume at different price levels using yellow bars and highlights POC levels with red bars.
TPO Volume Indicator Specifications Table
The table below outlines the specifications and features of the TPO Volume Insights Indicator:
Indicator Categories: | Volume MT4 Indicators Support & Resistance MT4 Indicators Trading Assist MT4 Indicators |
Platforms: | MetaTrader 4 Indicators |
Trading Skills: | Intermediate |
Indicator Types: | Reversal MT4 Indicators |
Timeframe: | Multi-Timeframe MT4 Indicators |
Trading Style: | Day Trading MT4 Indicators Scalper MT4 Indicators Swing Trading MT4 Indicators |
Trading Instruments: | Share Stocks MT4 Indicators Forward Market MT4 Indicators Indices Market MT4 Indicators Commodity Market MT4 Indicators Stock Market MT4 Indicators Cryptocurrency MT4 Indicators Forex MT4 Indicators |
TPO Volume Insights at a Glance
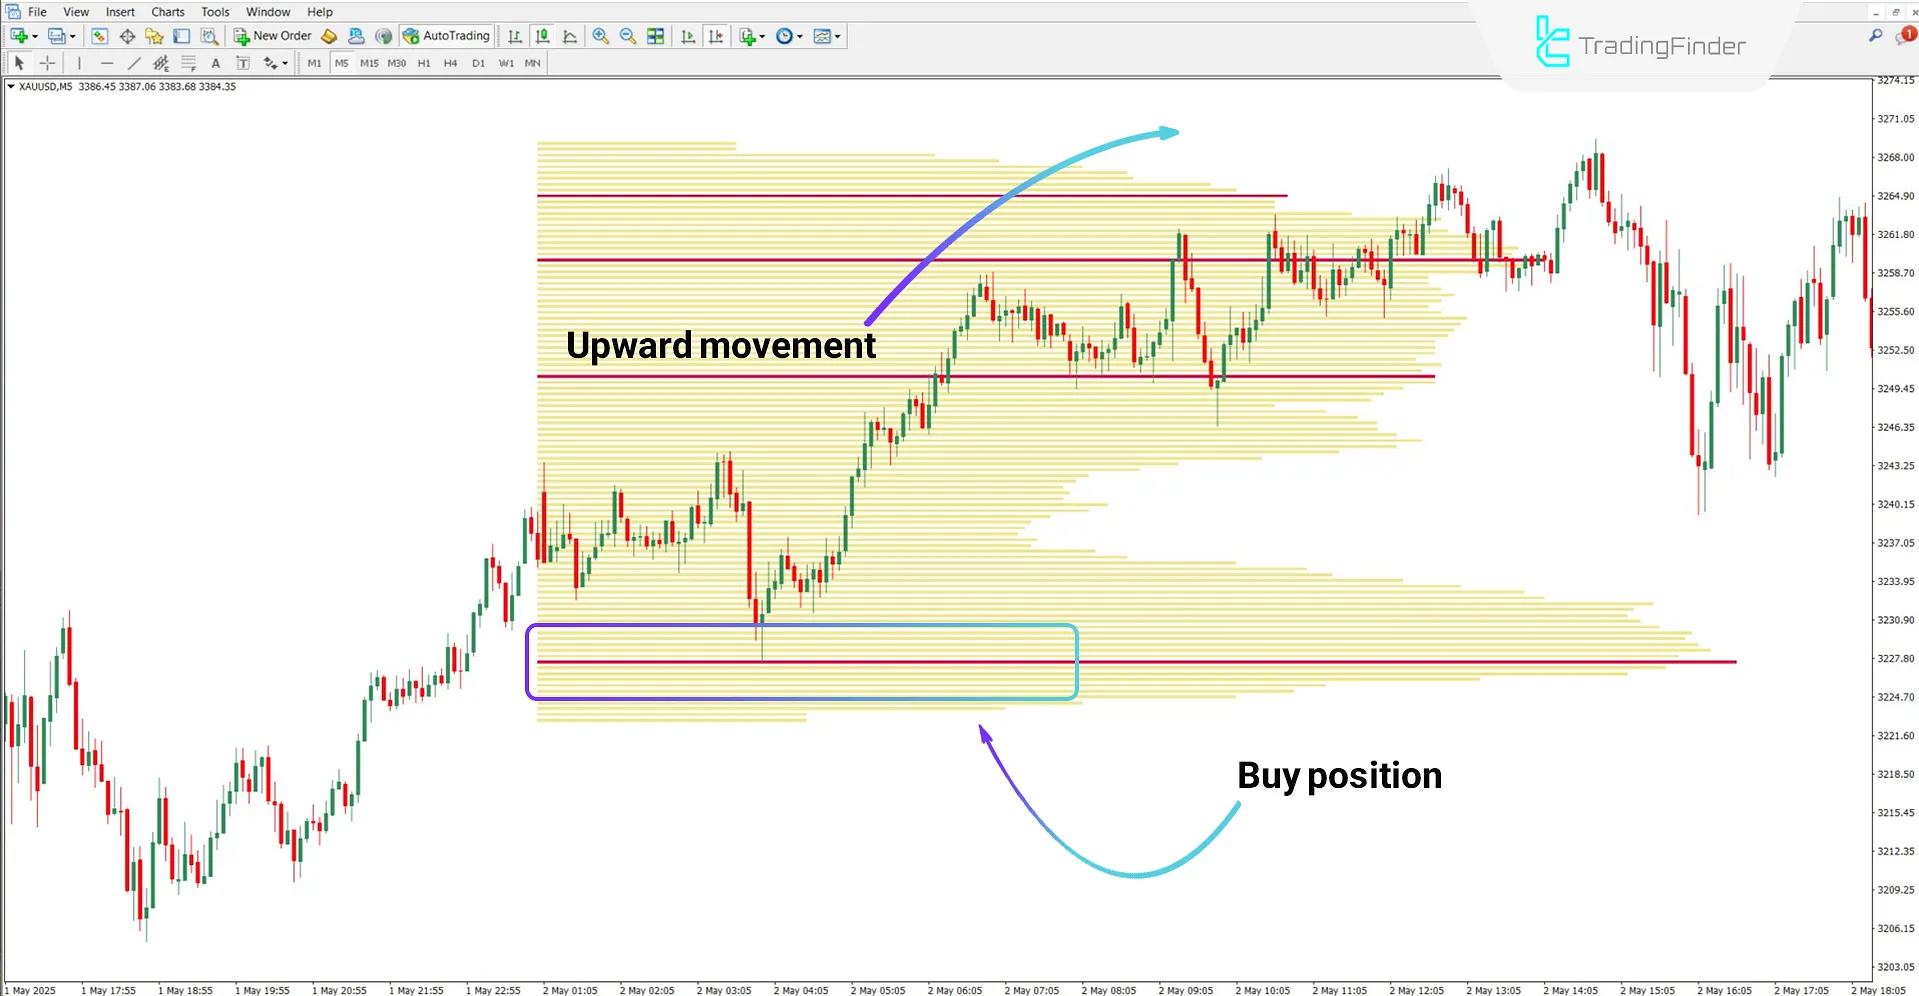
The Point of Control (POC) marks the price level with the highest trading volume. It is displayed with red bars and is considered a key support or resistance level. If the price revisits these zones, it will likely react to them.
Bullish Trend Conditions
In the 5-minute chart of Gold vs. US Dollar (XAU/USD), the price reacts positively after testing a POC level. Under such conditions, the marked zones represent good entry points for buy trades.

Bearish Trend Conditions
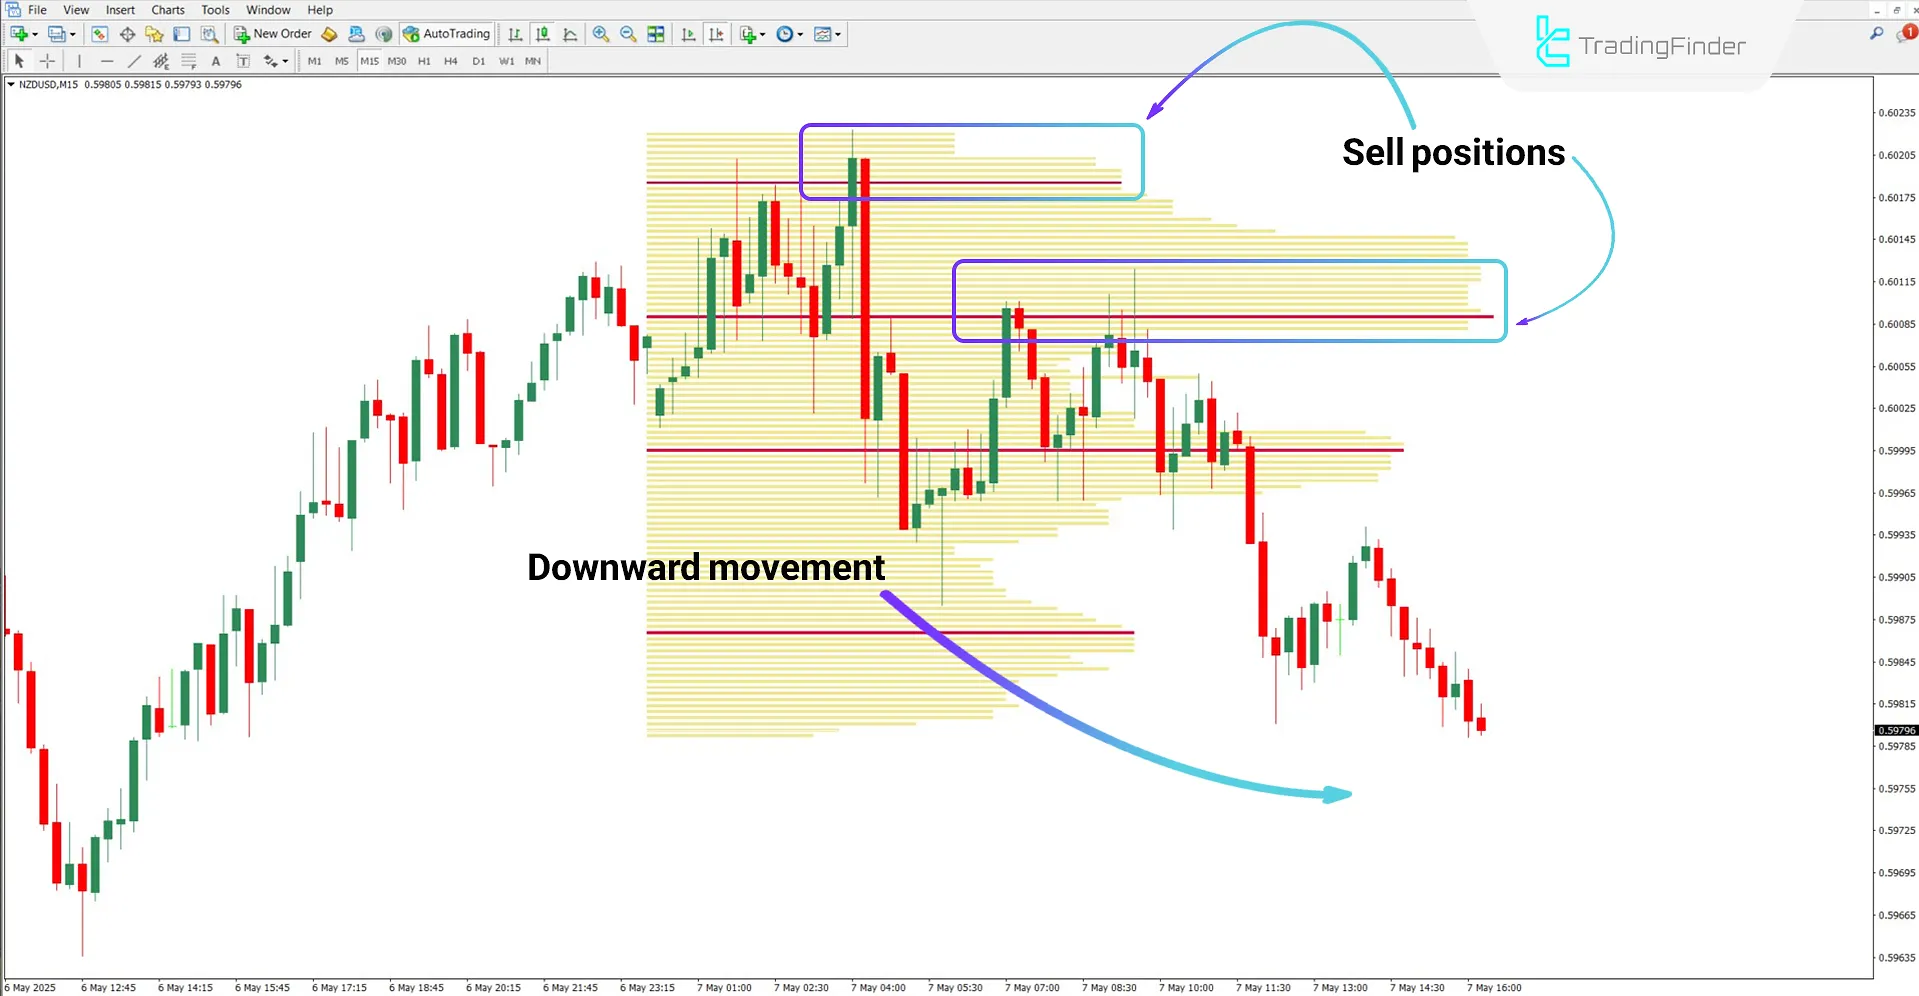
According to the 15-minute chart of NZD/USD, the price touches the POC levels twice and continues to decline. POC levels act as resistance in a downtrend, offering suitable entry points for sell positions.

TPO Volume Indicator Settings
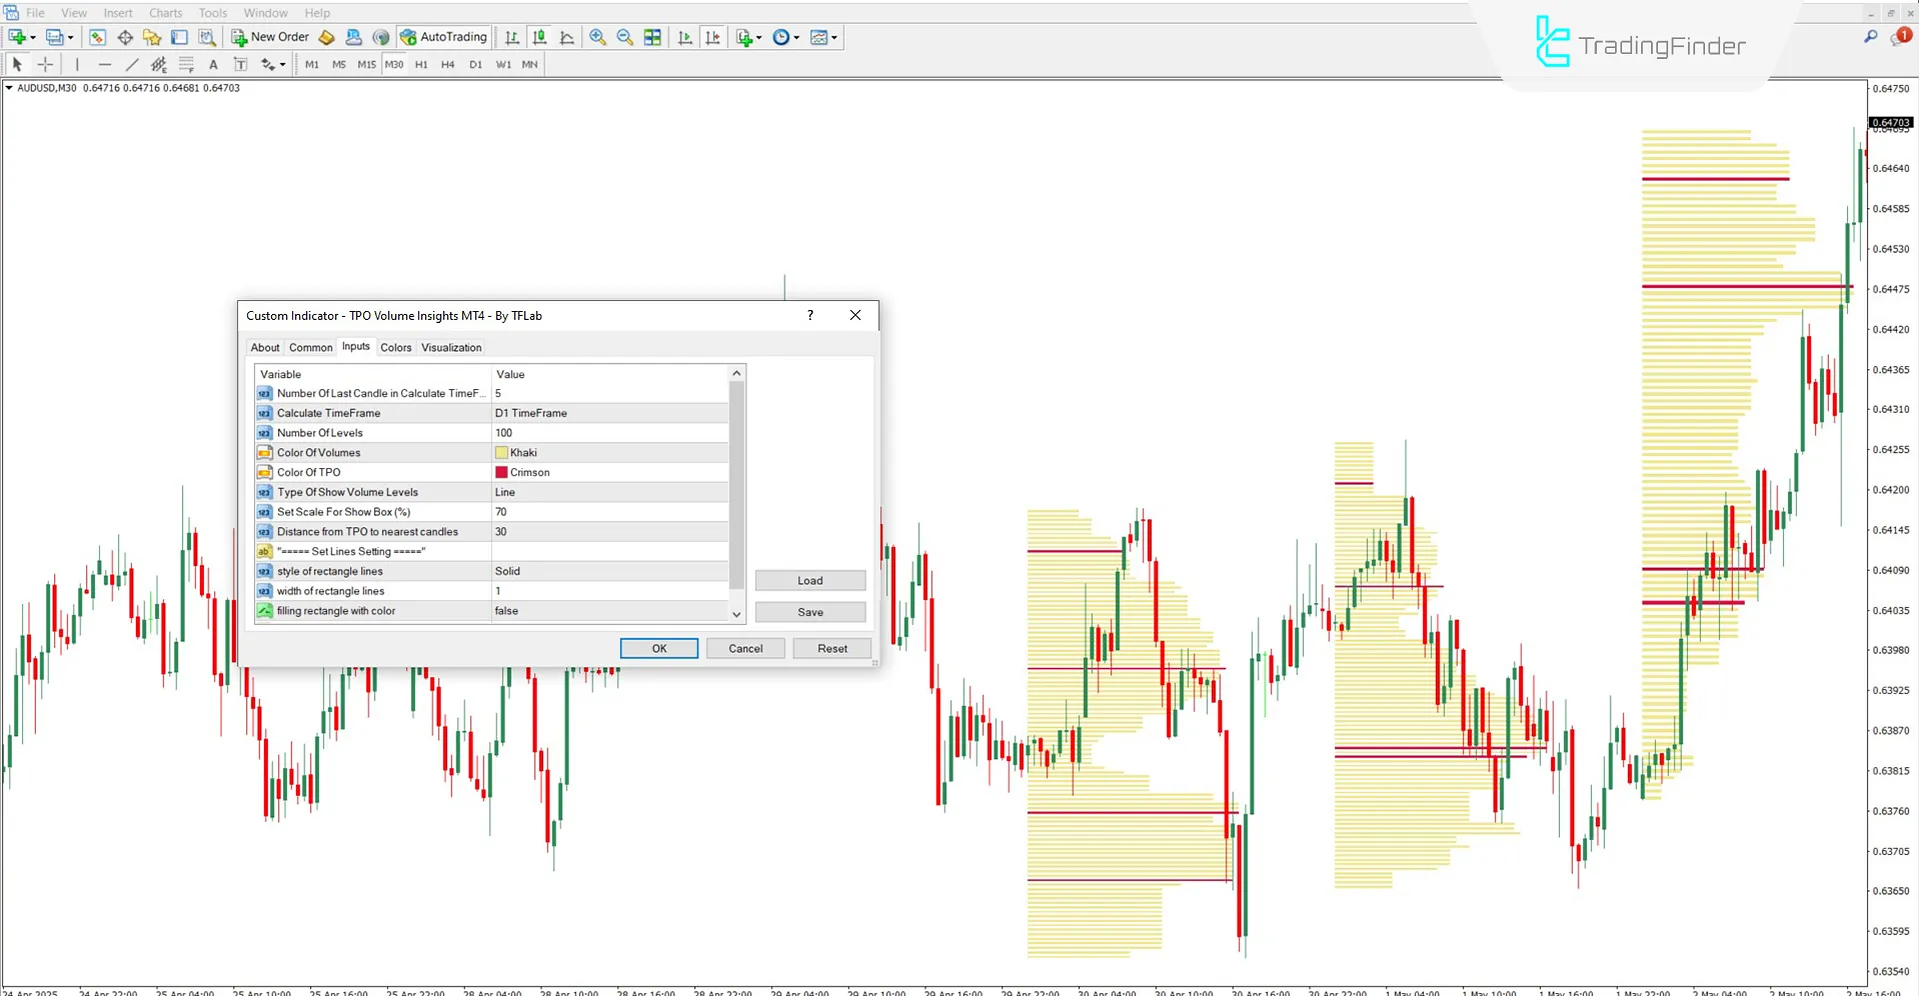
The image below shows the settings panel of the TPO Volume Indicator:

- Number of Last Candle in Calculate Time Frame: Number of candles used for calculation in the selected timeframe
- Calculate TimeFrame: Timeframe used for TPO/Volume calculation
- Number of Levels: Number of volume profile levels displayed on the chart
- Color of Volumes: Color of volume bars
- Color of TPO: Color of TPO bars
- Type of Show Volume Levels: Display mode for volume levels
- Set Scale for Show Box (%): Percentage scale of profile boxes on the chart
- Distance from TPO to nearest candles: Distance between TPO and nearest candles
Set lines Setting
- Style of rectangle lines: Style of drawn rectangle lines in the profile
- Width of rectangle lines: Line thickness
- Filling rectangle with color: Enable fill inside rectangles
Conclusion
The TPO Volume Insights Indicator is a powerful tool in technical analysis. It was built by combining the concepts of TPO (Time Price Opportunity) and Volume Profile.
This trading tool equips traders with price volume insights by visualizing volume bars across various levels. It enables market behavior analysis based on price, time, and volume.
TPO Volume Insights MT4 PDF
TPO Volume Insights MT4 PDF
Click to download TPO Volume Insights MT4 PDFDoes the TPO Volume Indicator generate entry or exit signals?
No, this indicator does not provide any trade entry or exit signals.
Can the TPO Volume Indicator be used in cryptocurrency markets?
Yes, this tool can be used in all markets without any limitations.


