![TPO Volume Range Indicator for MetaTrader 4 Download – Free – [TFLAB]](https://cdn.tradingfinder.com/image/397752/13-131-en-tpo-volume-range-mt4-01.webp)
![TPO Volume Range Indicator for MetaTrader 4 Download – Free – [TFLAB] 0](https://cdn.tradingfinder.com/image/397752/13-131-en-tpo-volume-range-mt4-01.webp)
![TPO Volume Range Indicator for MetaTrader 4 Download – Free – [TFLAB] 1](https://cdn.tradingfinder.com/image/397750/13-131-en-tpo-volume-range-mt4-02.webp)
![TPO Volume Range Indicator for MetaTrader 4 Download – Free – [TFLAB] 2](https://cdn.tradingfinder.com/image/397753/13-131-en-tpo-volume-range-mt4-03.webp)
![TPO Volume Range Indicator for MetaTrader 4 Download – Free – [TFLAB] 3](https://cdn.tradingfinder.com/image/397751/13-131-en-tpo-volume-range-mt4-04.webp)
The TPO Volume Range Indicator is designed for MetaTrader 4 to visualize volume distribution within specific price ranges. This trading tool uses two vertical lines and colored histograms on the right side of the chart to display volume levels.
The vertical lines are movable, allowing users to define the desired analysis range.
Additionally, green horizontal lines indicate high-volume areas on the chart; these levels are considered keysupport and resistancezones.
TPO Volume Range Indicator Specification Table
The technical specifications of the TPO Volume Range Indicator are as follows.
Indicator Categories: | Volume MT4 Indicators Support & Resistance MT4 Indicators Trading Assist MT4 Indicators |
Platforms: | MetaTrader 4 Indicators |
Trading Skills: | Intermediate |
Indicator Types: | Reversal MT4 Indicators |
Timeframe: | Multi-Timeframe MT4 Indicators |
Trading Style: | Day Trading MT4 Indicators Scalper MT4 Indicators Swing Trading MT4 Indicators |
Trading Instruments: | Forward Market MT4 Indicators Stock Market MT4 Indicators Cryptocurrency MT4 Indicators Forex MT4 Indicators |
TPO Volume Range at a Glance
Histogram calculations in the TPO Volume Range Indicator can be performed usingthree different methods, which users can select in the settings panel:
- Calculate the range between two lines: Calculate volume based on the distance between two adjustable vertical lines.
- Calculate range for the last few minutes: Automatically generates histogram bars based on a user-defined number of minutes.
- Calculate the range from a certain point to a line: The User selects a starting point, and the indicator calculates up to a single vertical line.(In this mode, the distance between two lines is not adjustable.)
Bullish Trend and Buy Setup
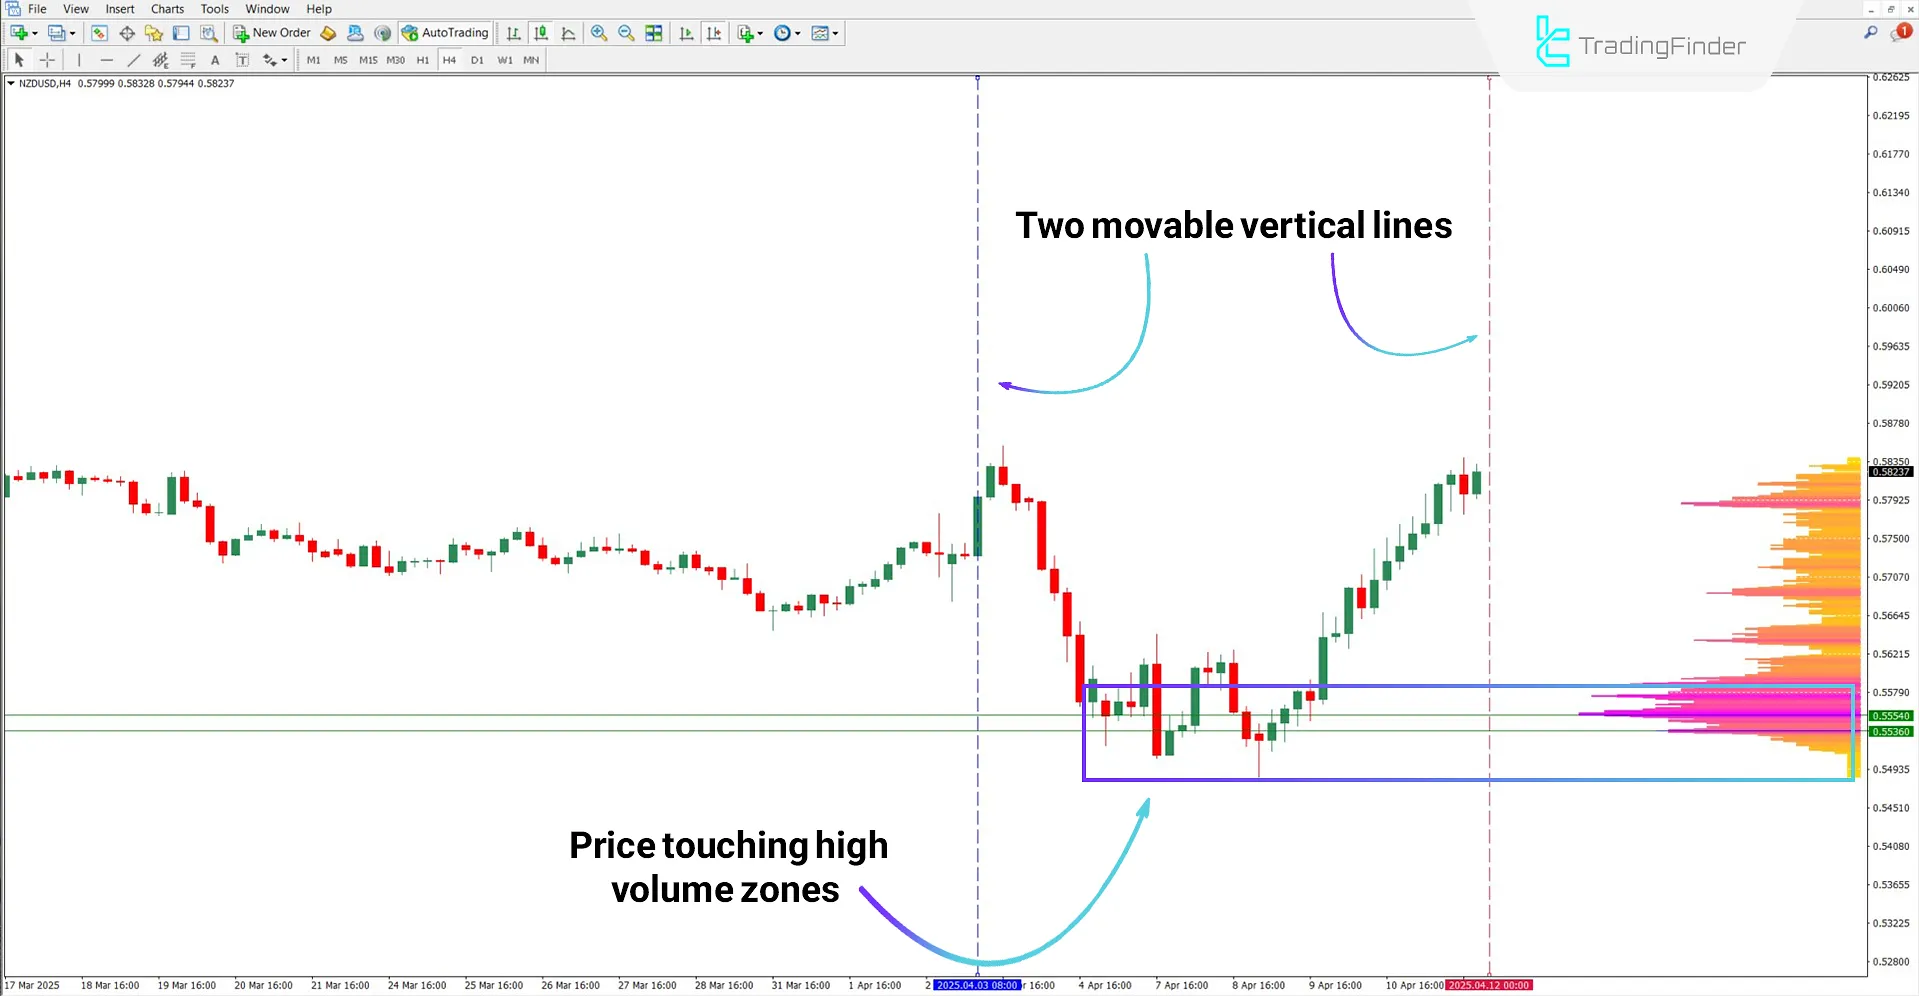
Based on the 4-hour chart of the NZD/USD pair, the blue and red vertical lines define the volume range.
The chart shows that the price reacts bullishly upon touching the green lines (high-volume zones), triggering a potential buy opportunity.

Bearish Trend and Sell Setup
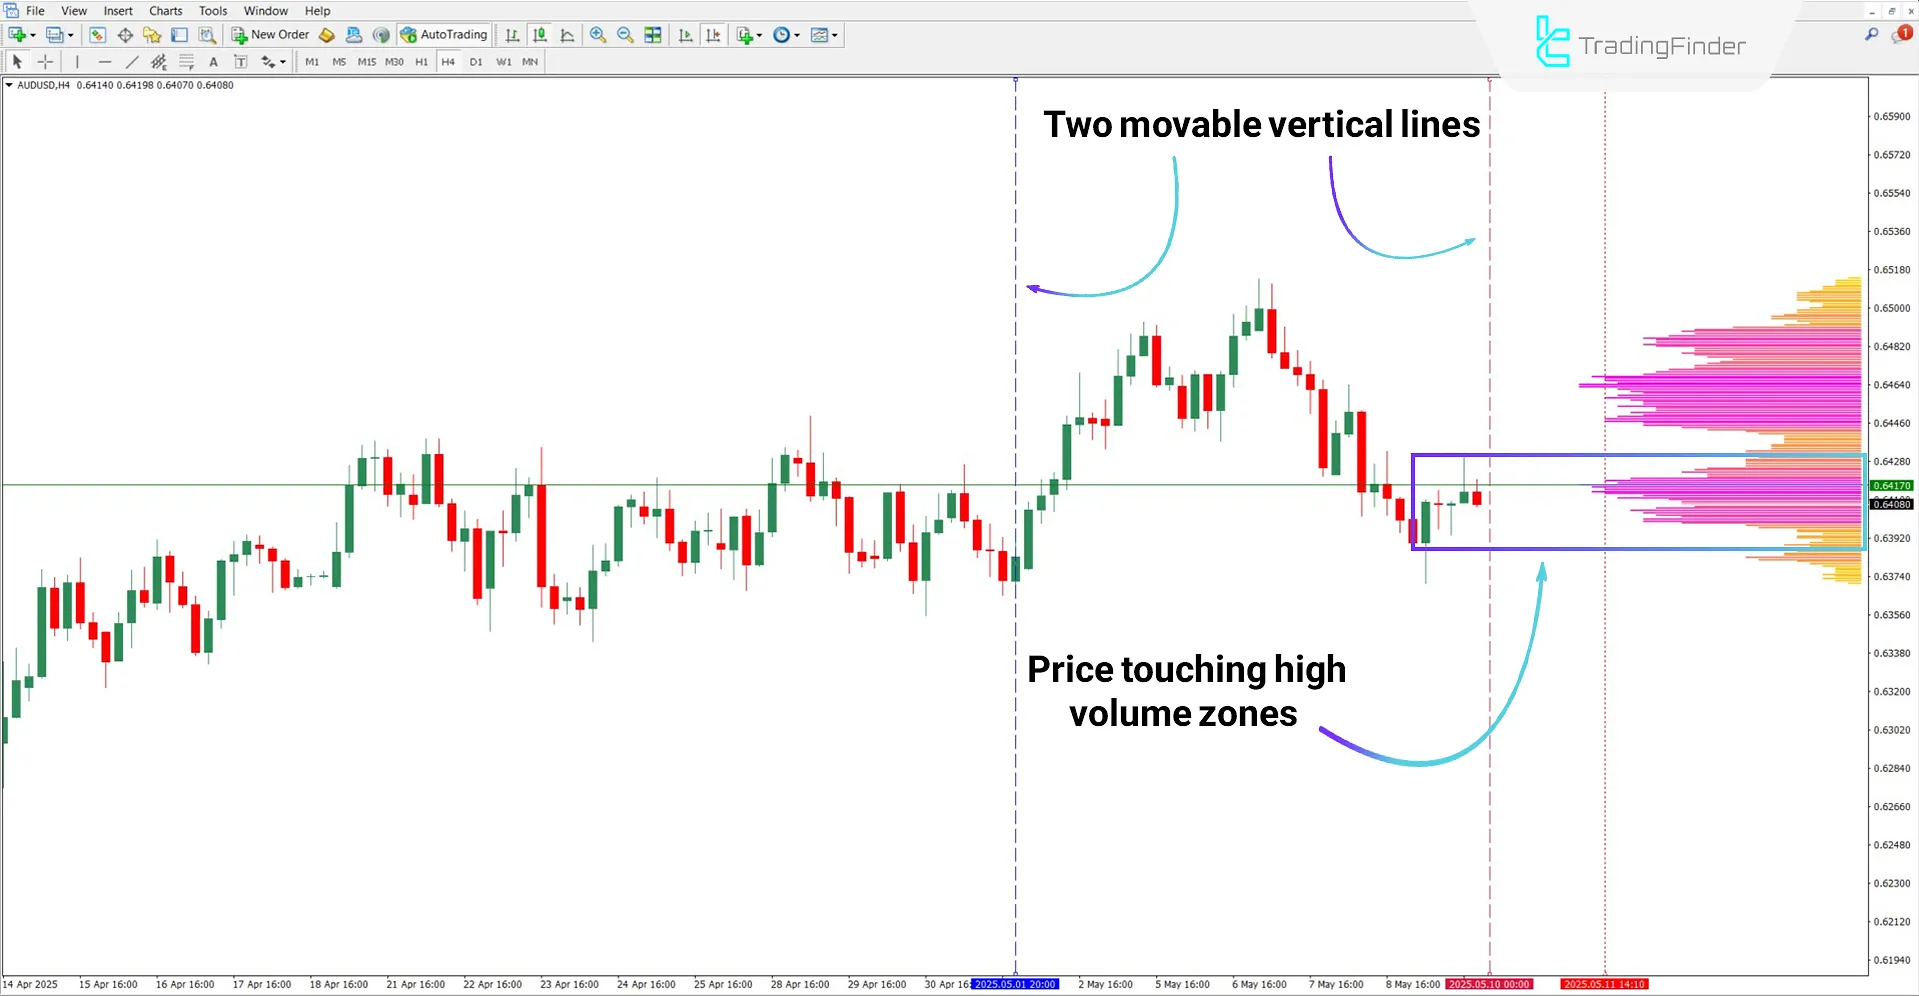
According to the 4-hour chart of AUD/USD, histogram bars are generated based on the selected range.
The chart shows that after a downward move, the price rebounds upward and hits a high volume level. In this case, the downtrend is likely to continue, and a further decline is likely.

TPO Volume Range Indicator Settings
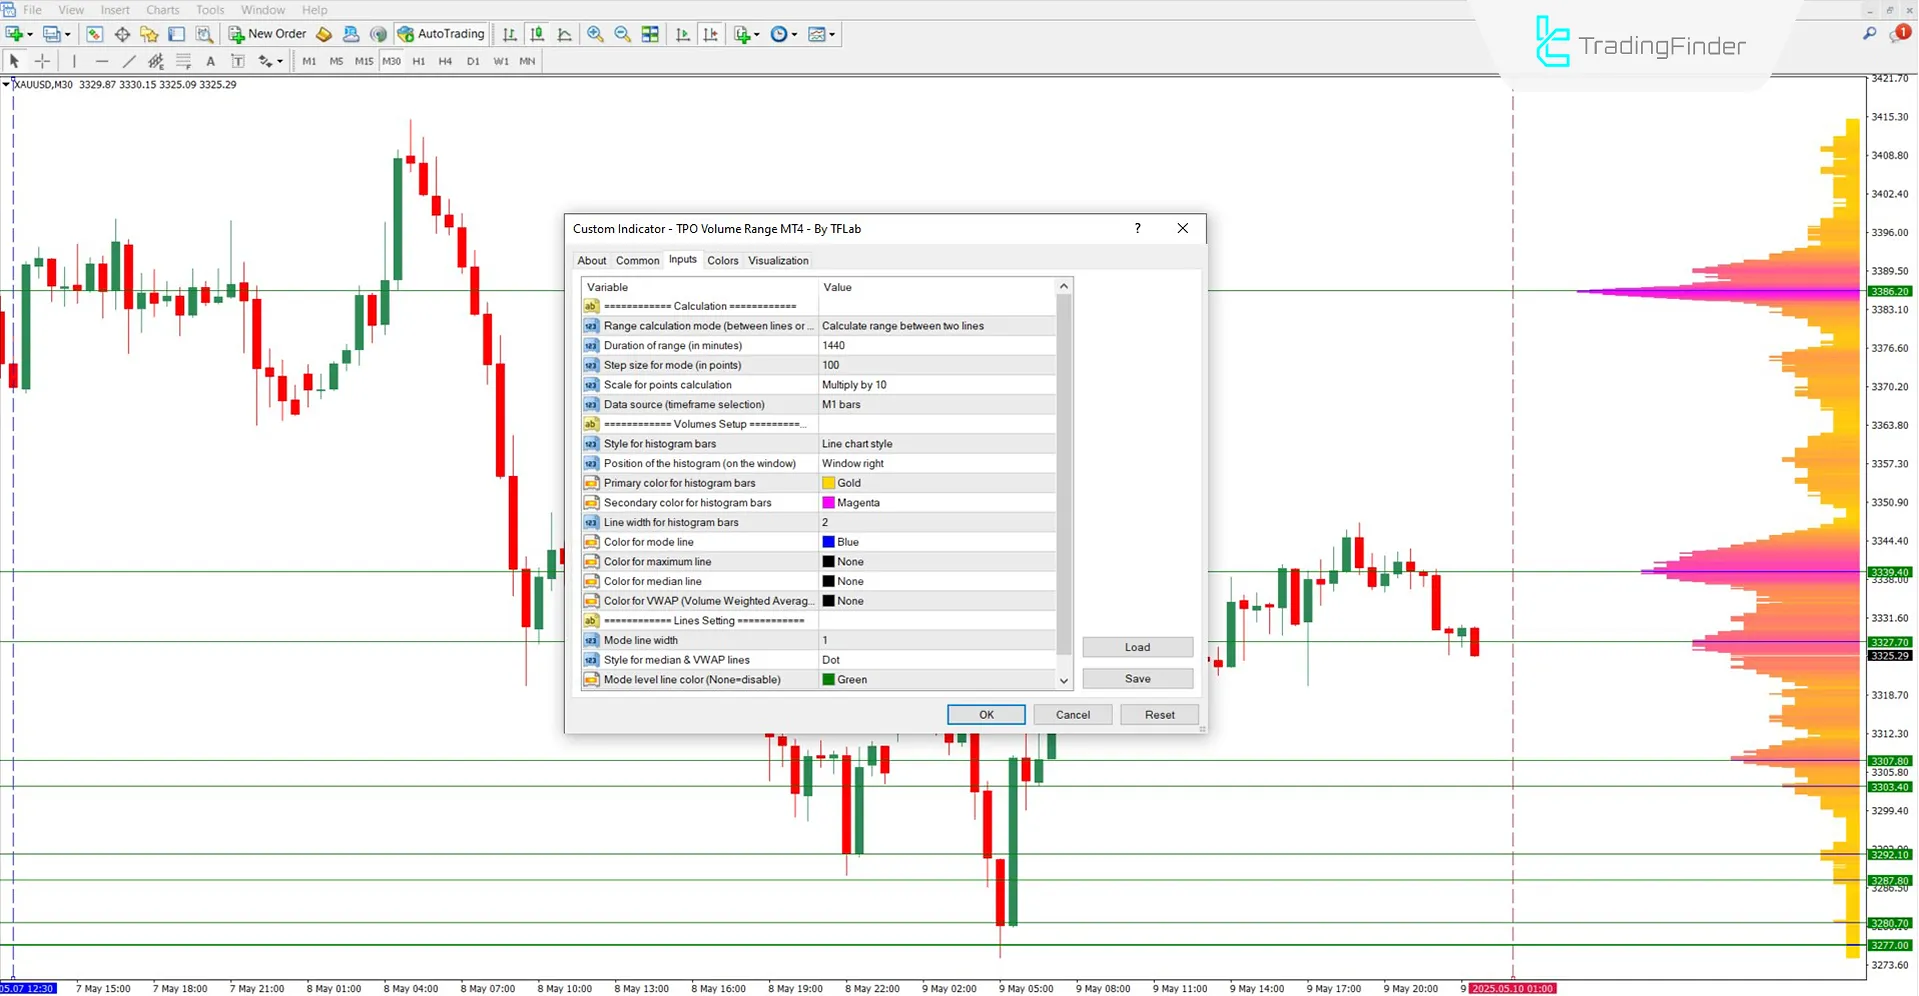
The settings panel items of the TPO Volume Range Indicator are as follows:

Calculation
- Range calculation mode: Selects the volume calculation range
- Duration of range (in minutes): Defines the period for auto mode
- Step size for mode (in points): Sets the price increment step
- Scale for points calculation: Conversion scale for point calculation
- Data source (timeframe selection): Specifies the source timeframe for the data
Volumes Setup
- Style for histogram bars: Defines how the volume bars are displayed
- Position of the histogram (on the window): Placement of the histogram on the chart
- Primary color for histogram bars: Main color for histogram bars
- Secondary color for histogram bars: Secondary color for bars
- Line width for histogram bars: Thickness of the volume bars
- Color for the mode line: Color for the bar with the highest trading frequency
- Color for maximum line: Color of the bar with the maximum volume
- Color for median line: Color of the median volume bar
- Color for VWAP (Volume Weighted Average Price): VWAP line color
Lines Setting
- Mode line width: Thickness of the mode line
- Style for median & VWAP lines: Style of the median and VWAP lines
- Mode level line color (None = disable): Color for the horizontal lines showing the highest volume levels
Conclusion
The TPO Volume Range Indicator, built upon Time Price Opportunity and Volume Profile concepts, visualizes volume distribution across a selected price range to highlight key price reaction levels.
This powerful tool in technical analysis enables traders to precisely detect support and resistance zones and evaluate potential entry points.
TPO Volume Range MT4 PDF
TPO Volume Range MT4 PDF
Click to download TPO Volume Range MT4 PDFDoes the TPO Volume Range Indicator provide trade entry/exit signals?
No, this tool does not generate trading signals.
What do the blue histogram bars represent?
Blue bars indicate areas with the highest trade clustering and volume.
Thank you very much for providing this indicator. However, when using TPO Volume Range MT4 - By TFLab.ex4, I noticed that when selecting M1 Bars as the data source, an extra vertical line appears on the right side of the chart and overlaps with the latest candlestick. Could this be optimized? The issue occurs on the MT4 platform using the 1-minute timeframe.
Kindly reach out to our support team to review this matter.


