![Triangle Pattern Indicator for MetaTrader 4 Download - [TradingFinder]](https://cdn.tradingfinder.com/image/348422/2-52-en-triangle-pattern-mt4-1.webp)
![Triangle Pattern Indicator for MetaTrader 4 Download - [TradingFinder] 0](https://cdn.tradingfinder.com/image/348422/2-52-en-triangle-pattern-mt4-1.webp)
![Triangle Pattern Indicator for MetaTrader 4 Download - [TradingFinder] 1](https://cdn.tradingfinder.com/image/348423/2-52-en-triangle-pattern-mt4-2.webp)
![Triangle Pattern Indicator for MetaTrader 4 Download - [TradingFinder] 2](https://cdn.tradingfinder.com/image/348426/2-52-en-triangle-pattern-mt4-3.webp)
![Triangle Pattern Indicator for MetaTrader 4 Download - [TradingFinder] 3](https://cdn.tradingfinder.com/image/348425/2-52-en-triangle-pattern-mt4-4.webp)
The Triangle Pattern Indicator on the MetaTrader 4 platform is based on price action and automatically detects peaks, troughs, and trendlines. Based on this data, it draws a triangle in the price compression zones using a blue fill.
Additionally, the indicator plots two converging lines on the chart, displayed as dashed red lines, predicting the potential breakout point.
Triangle Pattern Specifications Table
The table below outlines the features of the Triangle Pattern Indicator.
Indicator Categories: | Price Action MT4 Indicators Signal & Forecast MT4 Indicators Chart & Classic MT4 Indicators |
Platforms: | MetaTrader 4 Indicators |
Trading Skills: | Elementary |
Indicator Types: | Breakout MT4 Indicators |
Timeframe: | Multi-Timeframe MT4 Indicators |
Trading Style: | Intraday MT4 Indicators |
Trading Instruments: | Share Stocks MT4 Indicators Forward Market MT4 Indicators Stock Market MT4 Indicators Cryptocurrency MT4 Indicators Forex MT4 Indicators |
Triangle Pattern Uptrend Conditions
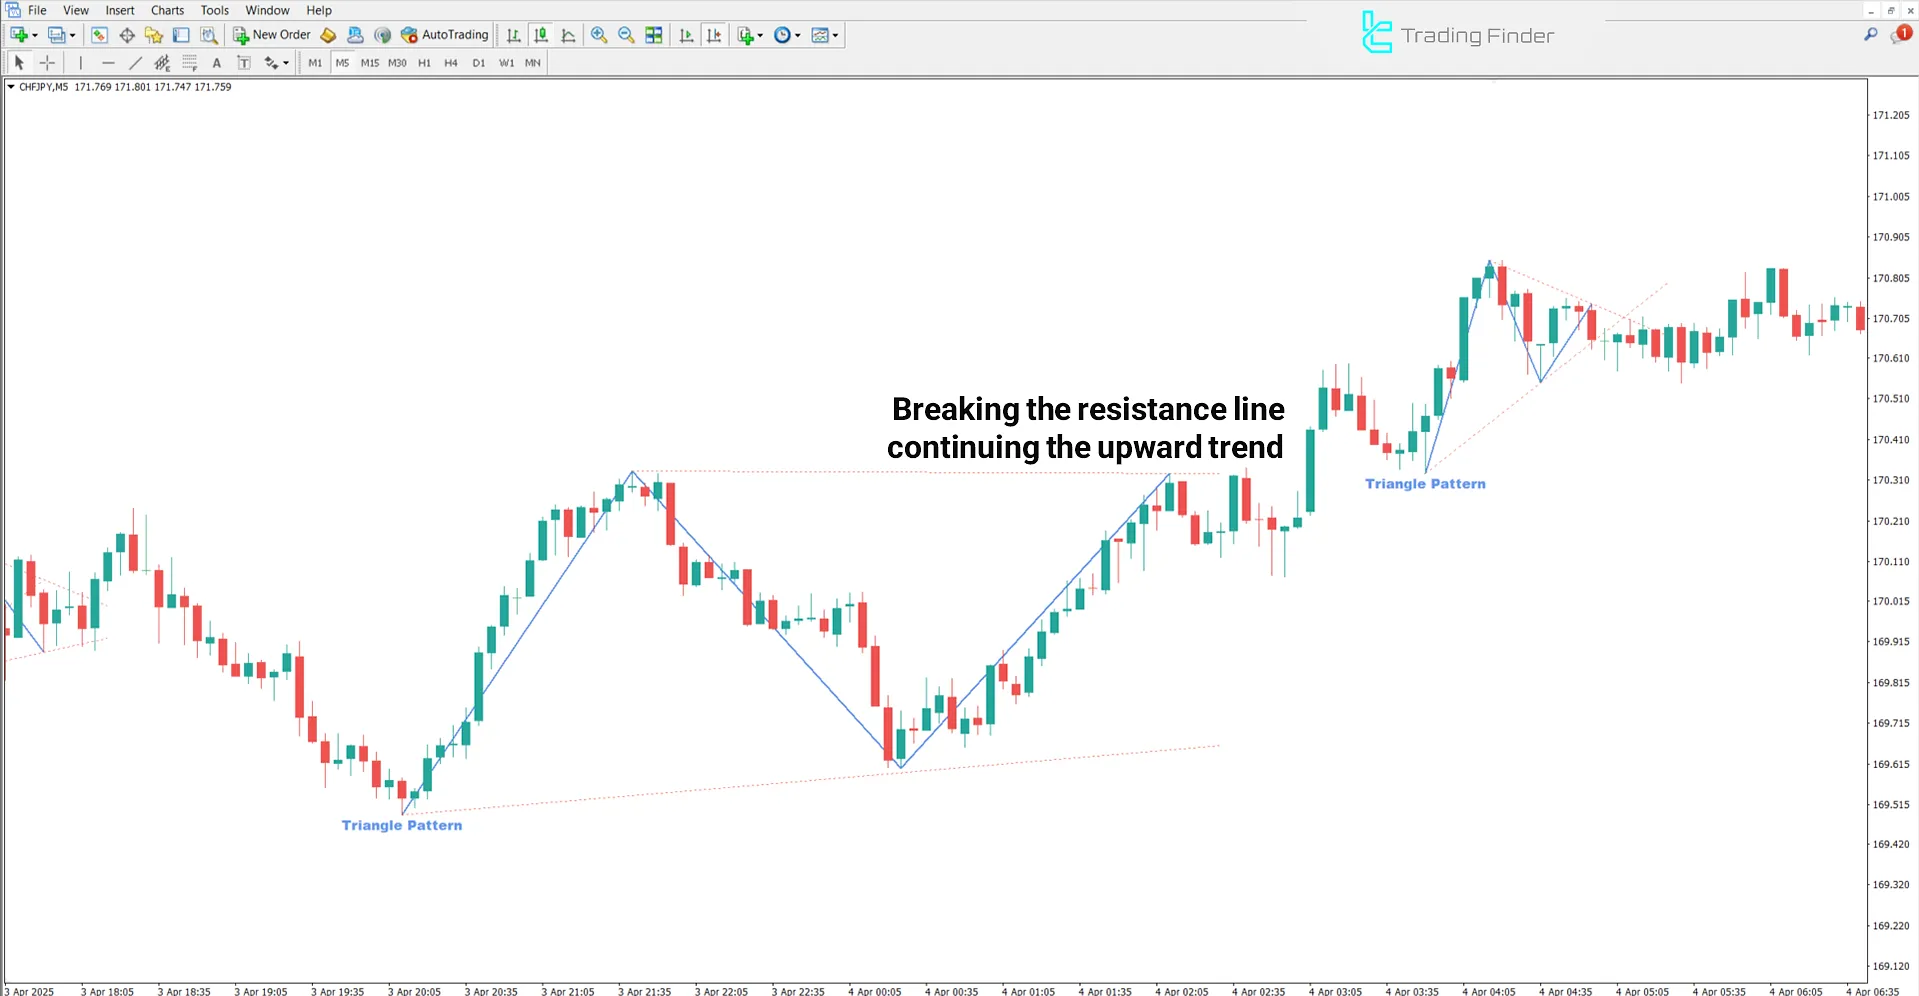
The chart below displays the CHF/JPY pair in a 5-minute timeframe.
An ascending triangle pattern in this indicator forms when the market faces a dynamic resistance level while simultaneously creating higher lows. Eventually, the price breaks above the resistance, signaling buyer strength.

Triangle Pattern Downtrend Conditions
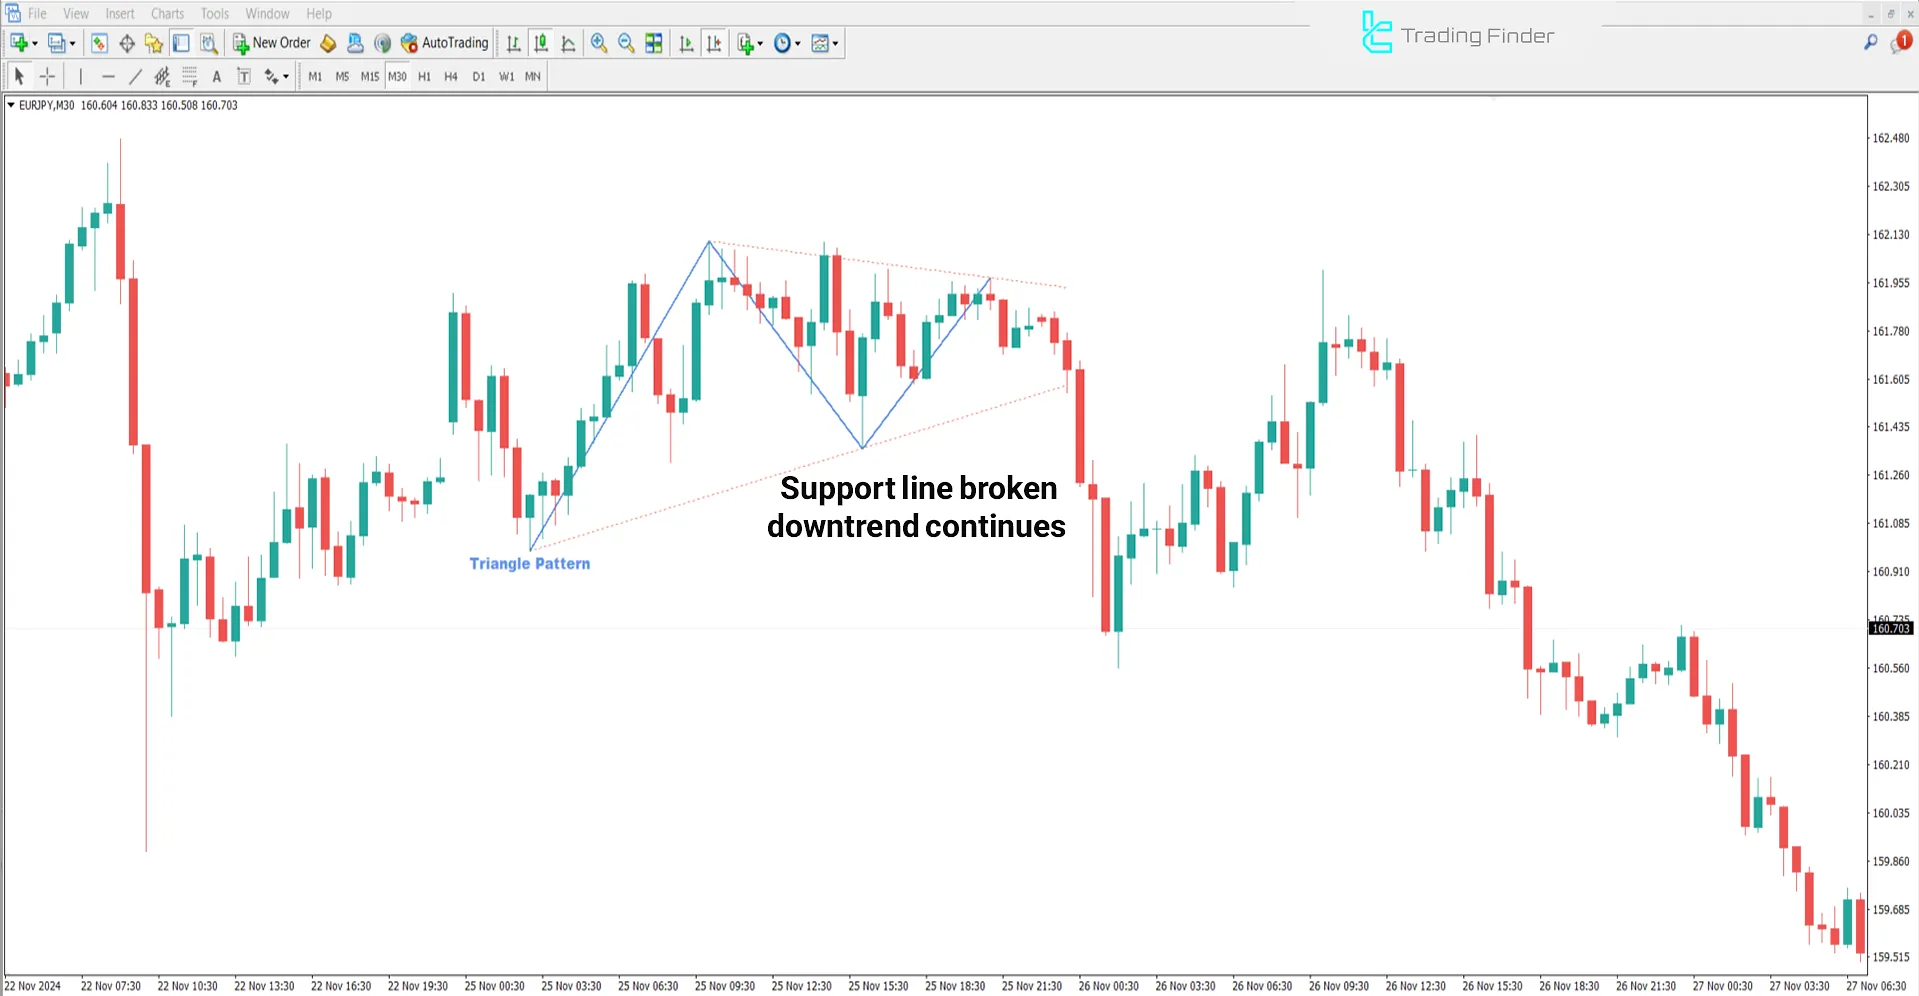
In the 30-minute EUR/JPY pair chart, price compression is illustrated by two converging lines.
The upper dashed red line is drawn by connecting lower highs and acts as resistance, while the lower dashed line is a dynamic support level that the price breaks, increasing the likelihood of a bearish move.

Triangle Pattern Indicator Settings
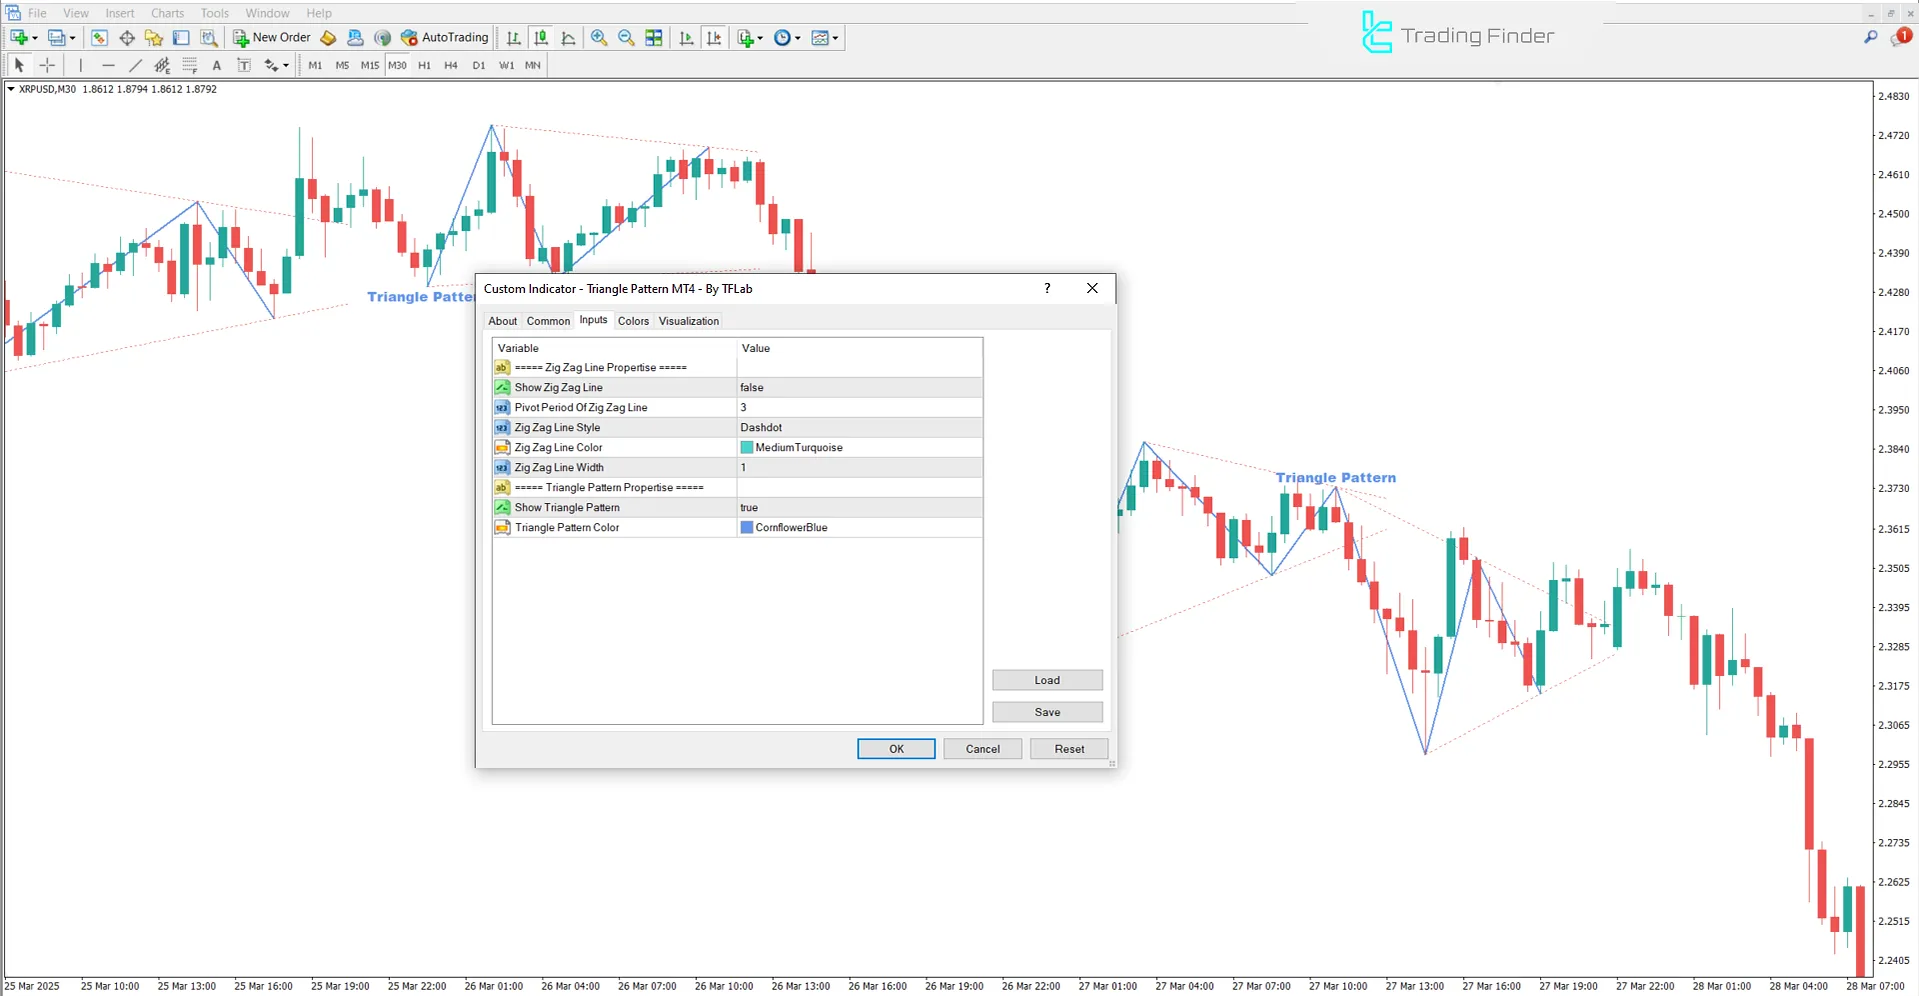
The image below shows the customizable parameters of the Triangle Pattern Indicator:

- Show Zig Zag Line: Displays the Zig Zag line
- Pivot Period Of Zig Zag Line: Pivot period of the Zig Zag line
- Zig Zag Line Style: Style of the Zig Zag line
- Zig Zag Line Color: Color of the Zig Zag line
- Zig Zag Line Width: Width of the Zig Zag line
- Show Triangle Pattern: Displays the triangle pattern
- Triangle Pattern Color: The color of the triangle pattern
Conclusion
The Triangle Pattern Indicator is a continuation pattern representing price consolidation before the next market move.
This indicator automatically detects and draws triangle patterns based on peaks, troughs, trendline slope, volume, and triangle structure. It also displays the potential breakout point using converging trendlines.
Triangle Pattern MT4 PDF
Triangle Pattern MT4 PDF
Click to download Triangle Pattern MT4 PDFIs the Triangle Pattern Indicator usable in all markets?
Yes, it is applicable across all markets, including Forex, stocks, and crypto.
What does the Triangle Pattern indicate in this indicator?
The triangle pattern in this indicator signifies price consolidation, which usually precedes a strong market move.


